

BTC $81,724.39 -0.37%
ETH $2,407.39 -0.27%
BNB $745.45 +1.52%
XRP $1.32 -0.50%
SOL $104.55 +0.67%
TRX $0.3297 -0.27%
DOGE $0.0800 +1.09%
ADA $0.2163 +0.25%
BCH $287.48 +4.42%
LINK $12.18 +0.77%
HYPE $78.44 +0.28%
AAVE $149.35 +0.83%
SUI $0.9945 +0.90%
XLM $0.1776 -0.36%
ZEC $1,230.50 -3.08%
AAPL $346.30 +0.40%
AMZN $251.08 -2.90%
GOOGL $325.98 -1.16%
MSFT $518.53 -1.95%
META $649.75 -6.34%
NVDA $215.28 -0.93%
TSLA $379.89 +2.93%
SNDK $1,313.73 -0.63%
INTC $88.06 -0.44%
SPCX $148.88 -4.10%
MU $884.66 +0.19%
AMD $520.41 -2.26%

Peter Brandt suggests that Bitcoin is showing a bullish pattern in the short term

2026-03-10 10:53:59

Renowned trader and chart analyst Peter Brandt, who successfully predicted the Bitcoin crash in 2018, released a chart showing the "big banana" pattern, which represents a massive upward-curving channel on the long-term weekly chart (2014-2027).

The "small banana" pattern is a smaller similar curve currently forming around $69,000 on the daily chart. The arrow clearly points upward, indicating higher targets.
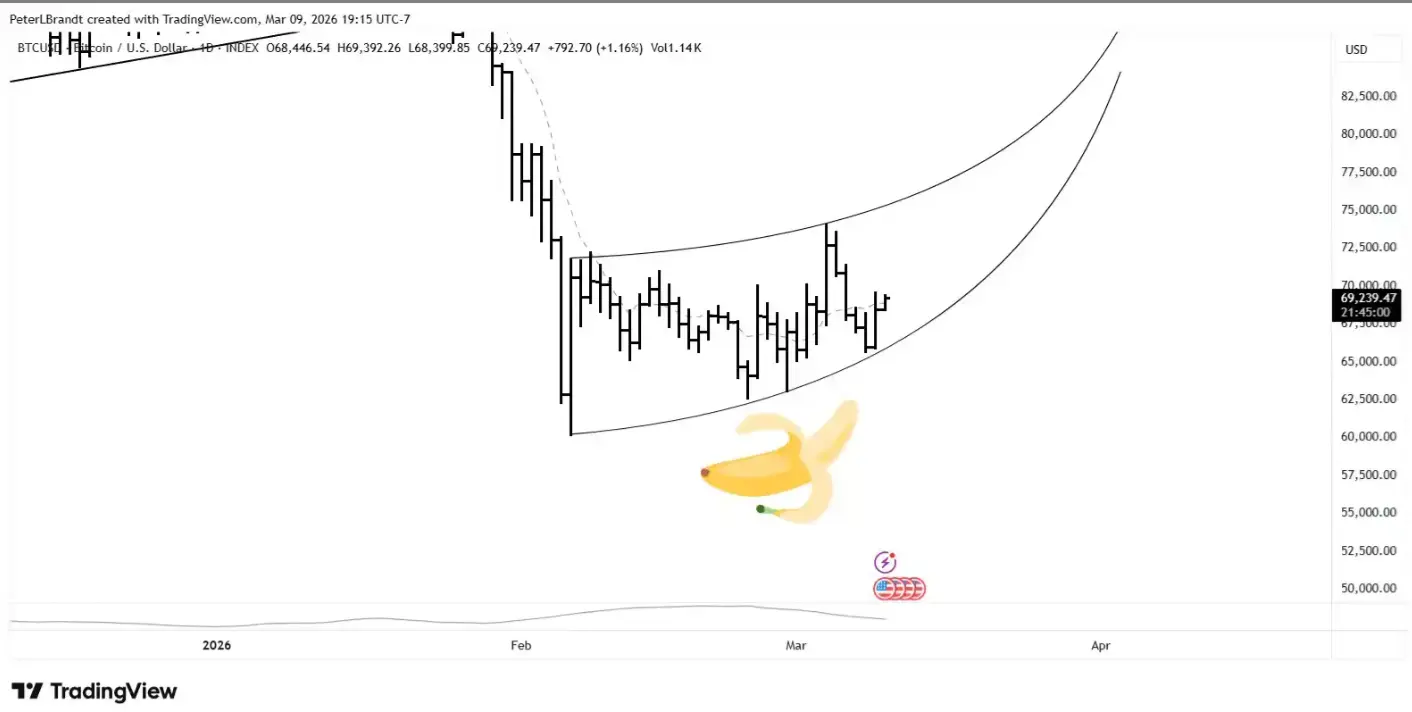
Peter Brandt suggests that Bitcoin is showing a bullish pattern in the short term

app_icon
ChainCatcher Building the Web3 world with innovations.