Footprint Pitfall Guide: How to Find Worthwhile DeFi Projects to Invest In

 With the development and rising popularity of the cryptocurrency market, an increasing number of DeFi projects are emerging, attracting a large number of investors as well.
Written by: Bella, Footprint Analyst
With the development and rising popularity of the cryptocurrency market, an increasing number of DeFi projects are emerging, attracting a large number of investors. The growth of DeFi in 2021 can be described as rapid, with the TVL (as of the time of writing) increasing by 860.42% from $21.4 billion at the beginning of the year; the number of on-chain DeFi projects has grown from 174 at the beginning of the year to 554, a growth rate of 218.39%. The prosperity of the DeFi market not only allows investors to gain returns higher than traditional financial investments but also enhances confidence.
Due to the decentralized nature of DeFi, the launch of a new project does not require approval from relevant authorities, and the costs are very low. Projects that engage in fraudulent activities under various pretenses are not uncommon, and a small mistake can lead to falling into the trap of scam platforms. With so many projects available, knowing how to avoid pitfalls and identify projects with investment value is a necessary lesson for individual investors participating in DeFi investments.
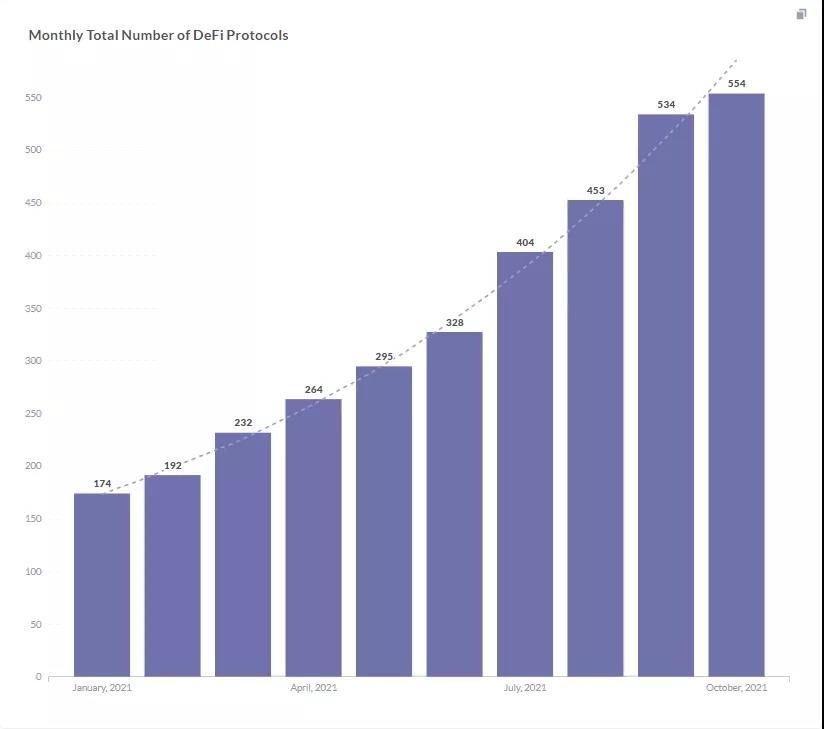
Monthly Changes in DeFi Project Numbers in 2021
Part 1: Characteristics of Basic Indicators
To better understand the evaluation significance of different indicators, let's first look at the characteristics of various basic indicators of the top 10 platforms ranked by TVL:
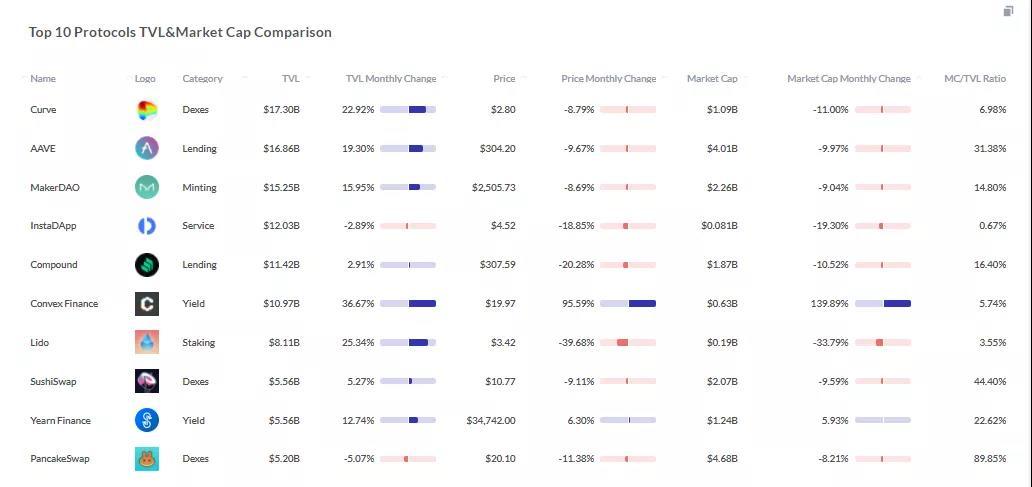
Comparison of Indicators of the Top 10 TVL Platforms (Locked Amount, Price, Market Cap)
1. Total Value Locked (TVL)
For those participating in DeFi investments, the TVL indicator is not unfamiliar, and the required DeFi platform TVL data can be obtained from major data platforms (such as DeFi Llama, CoinGecko, CoinMarketCap). TVL refers to the total amount of assets deposited and locked in the protocol. A larger value indicates that more assets are aggregated in the project, reflecting higher user trust in the project and a greater willingness to deposit assets into the platform for various economic activities (such as providing liquidity, collateral, etc.), leading to a larger user base and higher popularity.
From the above chart, we can see that the top ten platforms by TVL not only have large volumes (over $5 billion) but also maintain a monthly growth trend in TVL, proving that the projects are continuously maintaining their vitality and strength.
2. Market Cap
Market cap reflects a project's market value in the DeFi industry. This indicator is calculated similarly to traditional stock markets and is mainly influenced by token price and the number of tokens in circulation available for trading.
As shown in the chart above, due to the influence of circulation and supply and demand on the number of tokens, token prices fluctuate, affecting market cap changes. However, the market cap's increase or decrease remains within a reasonable range of about 20%, without experiencing explosive growth followed by a cliff-like drop.
Part 2: Identifying Quality Projects
After understanding the basic indicators, let's see how to use these indicators for project evaluation to discover potential and worthwhile investment projects.
1. TVL Ranking Should Not Be Too Low; Choose Projects Higher Up the List
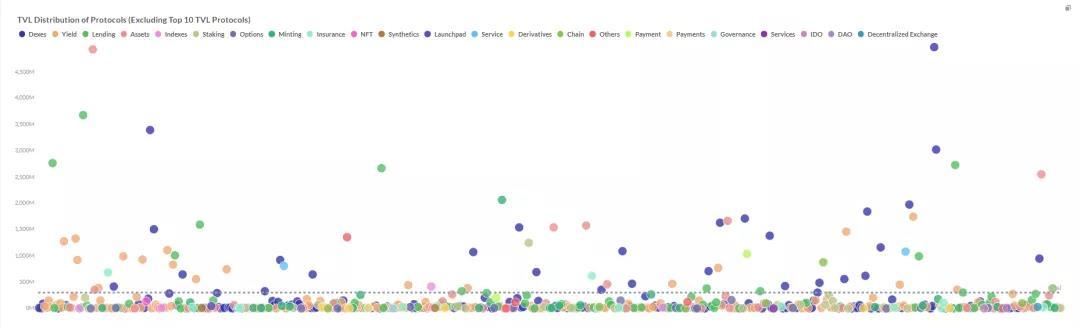
Distribution of TVL Platforms
As shown in the scatter plot, there are over 500 current DeFi projects, among which many newly emerged projects have small TVL (platforms with TVL below $5 million account for as much as 33%). How to select suitable investment projects from the many available? For safety, to prevent the risk of small-scale projects running away with funds, individual investors should try to select projects from the mid-range and above in the TVL ranking (around $20 million).
For DeFi projects, those with a TVL of $1 million to $10 million are suitable for institutional seed round investments but are not suitable for individual investors, as the future development positioning and strategic direction of such projects are unclear.
Projects with a TVL of $1 million to $20 million may have found suitable development strategies, and investors can access data on these projects. However, from a stability perspective, such projects may face growth obstacles. Once growth is insufficient, there is a high risk of stagnation or decline.
Projects with a TVL of $20 million to $50 million have, to some extent, found clear product mechanisms and growth points, and community and technical support are gradually improving. If one wishes to achieve returns higher than leading platforms, such platforms are a good choice. If the risk tolerance is low and there is no high demand for returns, one can select projects for investment from leading platforms based on personal preferences for DeFi project categories (such as providing liquidity for DEX, lending for lending, etc.).
2. Token Price Stability and Reasonable Token Distribution Mechanism
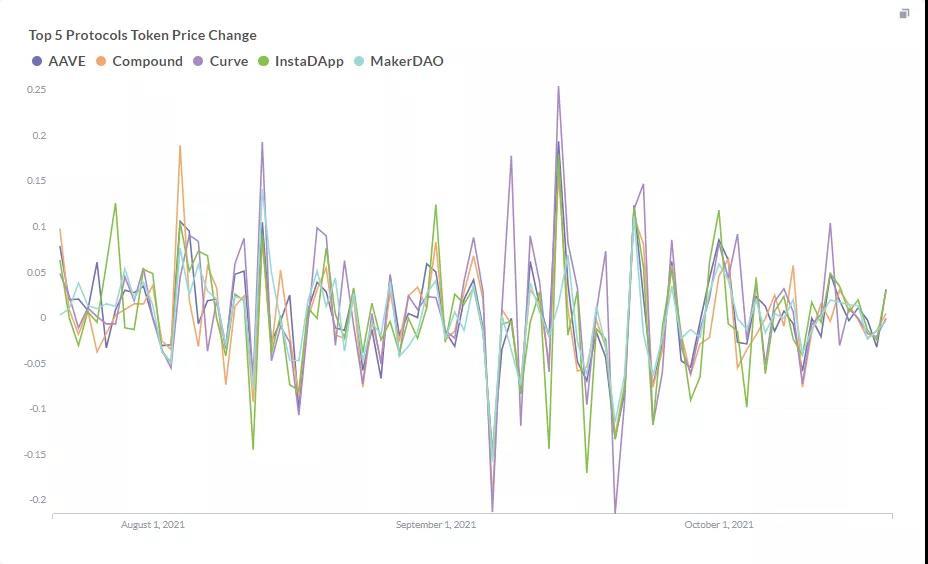
Price Changes of the Top 5 TVL Platform Tokens
After selecting suitable candidate projects based on the TVL indicator, further screening is needed based on the token situation of the projects. According to the price change patterns of tokens from leading platforms (as shown in the chart above), evaluation can be conducted from two aspects:
First, whether the token price maintains a relatively stable trend of increase or decrease (the increase or decrease should not exceed 20%). If the token price remains relatively stable, it indicates that the token's liquidity is stable, reducing the likelihood of significant damage to the project from a single investor's large-scale token sell-off.
Second, whether the token issuance mechanism is reasonable. For example, whether the team's or foundation's holding ratio is too high; if it is too high, the project's purpose of "raising funds" increases. Whether the token release speed is too fast; if released too quickly, it can lead to severe price dilution, increasing the likelihood of token sell-offs, which is detrimental to the sustained development of the token price.
3. Confirming the MC/FDV Ratio for Long-Term Holding Suitability
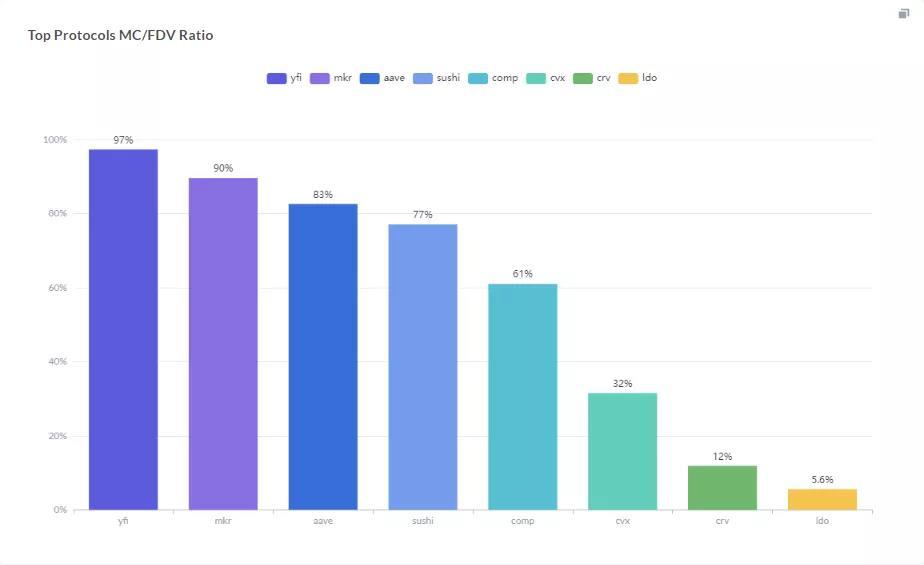 Market Cap / Fully Diluted Valuation Ratio of Leading Platforms
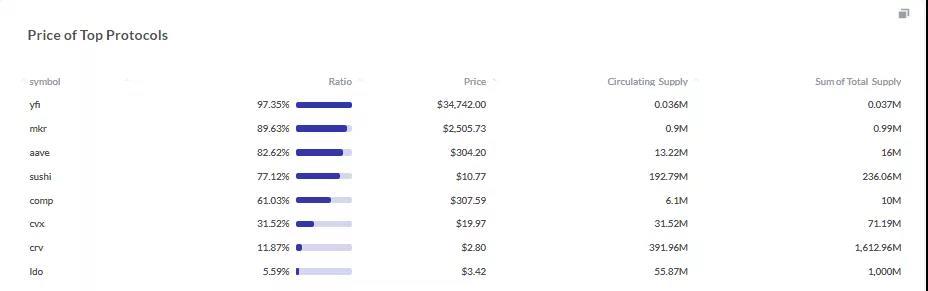
Comparison of Market Cap / Fully Diluted Valuation Ratio, Price, Token Circulation, and Total Token Supply of Leading Platforms
Fully diluted valuation refers to the product of the token price and the maximum supply of tokens. When all tokens are released, the market cap equals the fully diluted valuation. If the "MC/FDV" ratio of a project's token (i.e., the ratio of market cap to fully diluted valuation) is too low, it indicates that a large number of tokens have not yet been released. At this point, investors need to consider carefully, focusing on the project's launch duration, token supply schedule, and whether the price increase is overheated.
For individual investors with long-term investment needs, it is necessary to assess the project's "MC/FDV" ratio. As new tokens are released and gradually flow into the market, when the supply of tokens exceeds actual demand, the valuation becomes unreasonable. With market adjustments, token prices will decline, leading to greater sell-off pressure for long-term holders, making the tokens held become worthless.
Taking leading projects as examples, for platforms with an "MC/FDV" ratio above 60%, such tokens are more suitable for long-term holding, ensuring safety, but the downside is a high entry price. In contrast, platforms with lower ratios, such as Curve (CRV), although the ratio is not high, the token price is within a reasonable range, making it a platform worth considering. Comparatively, Lido's "MC/FDV" ratio is 6.32% lower than Curve's, but its token price is 43.75% higher than Curve's, indicating a high market cap valuation, making it currently unsuitable for long-term holding, as the token price may decline with market self-adjustment.
4. Assessing Investment Worthiness with MC/TVL Ratio
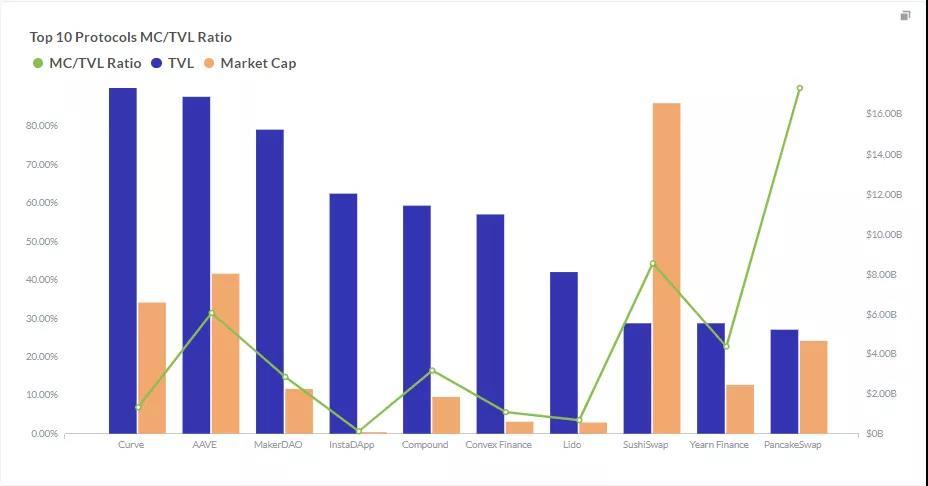
Market Cap / Locked Amount Ratio of the Top 10 Leading Platforms
According to data provided by Footprint, the current "MC/TVL" ratio (i.e., the ratio of market cap to locked amount) of the top ten projects by TVL is generally less than 1, indicating that the projects are undervalued and worth investing in, especially since InstaDapp's ratio is only 0.65%. From an economic perspective, the higher the project's TVL, the higher the MC should be, as a high TVL indicates that the project is favored and can bring greater economic benefits, thus the market cap should increase to match the TVL.
Therefore, when searching for investable projects, investors can evaluate the investability of projects from the perspective of the "MC/TVL" ratio. A ratio greater than 1 indicates that the valuation may be too high and the investability is low, while a ratio less than 1 indicates that the project is undervalued, increasing potential returns. Additionally, investors can compare the determined investment projects with the ratios of leading platforms in the same category to see where the differences lie.
Conclusion
Readers can use the evaluation indicators in this article to assess the projects they are investing in, summarized as follows:
- TVL ranking is in the mid-range or above, approximately above $20 million
- Token price is relatively stable: monthly increase or decrease should not exceed 20%
- Token distribution mechanism is reasonable: team holding situation and token release speed should be reasonable
- MC/FDV ratio is less than 5%, indicating that the project token is not suitable for long-term holding
- MC/TVL ratio is less than 1, indicating that the project is suitable for investment
For the indicators involved in the above calculations, readers can directly click to read the original text without additional calculations.
After analyzing with the above indicators, it will be found that DeFi, as a new type of investment market, due to its "newness" and inclusiveness, creates more investment possibilities compared to traditional finance, with increasingly diverse styles. Many investable projects are known and understood, while many potential projects remain undiscovered.
However, opportunities and risks coexist. We cannot solely rely on the above indicators to conclude whether a project is worth investing in or has development potential, as the DeFi market is unpredictable, and the speed of updates is too fast. Indicators may also fail at times. To reduce the possibility of pitfalls, it is still necessary to conduct more research and understanding of the project's background, business model, etc., before investing, and avoid blindly following trends.
 Risk warning
 Risk warning