Banksea Finance: Degraded Ape NFT Market Analysis Report

 In this analysis report, we use the historical transaction data of the Degraded Ape project to conduct statistical analysis on the trading data, exploring the trading trends of the Degraded Ape project and providing some references for users who wish to make a purchase.
Author: Banksea Finance
1. Introduction
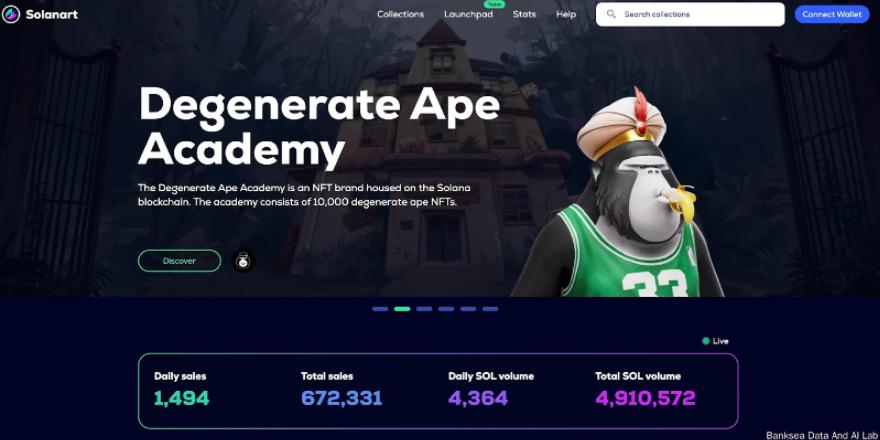
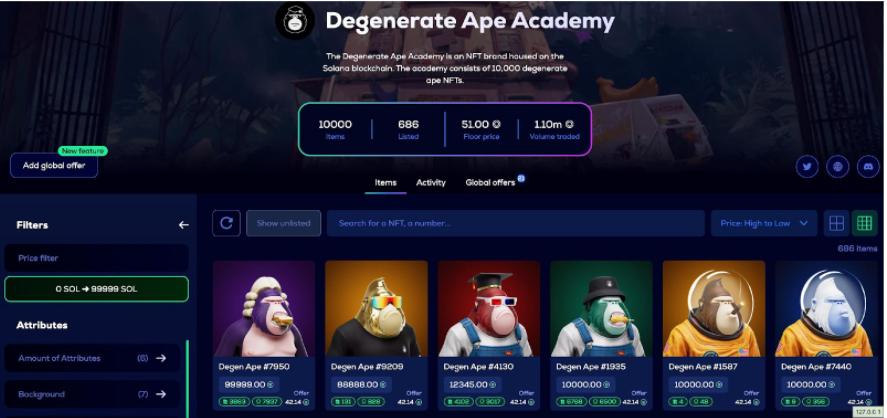
In recent years, the NFT market has become very popular, with more and more users choosing to invest in NFTs. Among these NFT projects, the Degenerate Ape Academy project is very representative. Degenerate Ape Academy is an NFT brand located on the Solana blockchain. This brand consists of 10,000 Degenerate Ape NFTs. According to statistics from the solanart marketplace, the total trading volume of this project has reached 1.11M SOL. In this analysis report, we use the historical transaction data of the Degenerate Ape project to conduct statistical analysis on the trading data, exploring the trading trends of the Degenerate Ape project and providing some references for potential buyers.
Banksea Finance has developed an NFT AI Oracle to assess NFT prices and provides a pool-based NFT collateral loan solution. By using the NFT Oracle, users can obtain real-time NFT price assessments. Banksea is one of the winners of the Solana Ignition Global Hackathon and has established partnerships with projects like Parrot, Moonbeam, and Slope.
2. Data Description
The analysis data is obtained from the Solanart trading market, collecting 17,985 transaction records of the Degenerate Ape Academy project from November 21, 2021, to March 19, 2022, covering 7,936 active NFTs. By analyzing these active NFTs, we explore information such as the rarity of active attributes, NFT liquidity, and appreciation potential.
SOL---Solanart Trading Market - DAPE Series Trading Situation
3. Preliminary NFT Analysis
3.1 Transaction Data Analysis
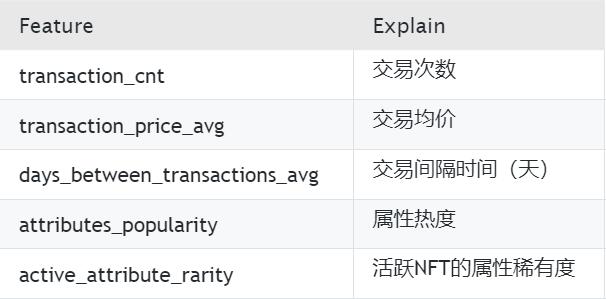
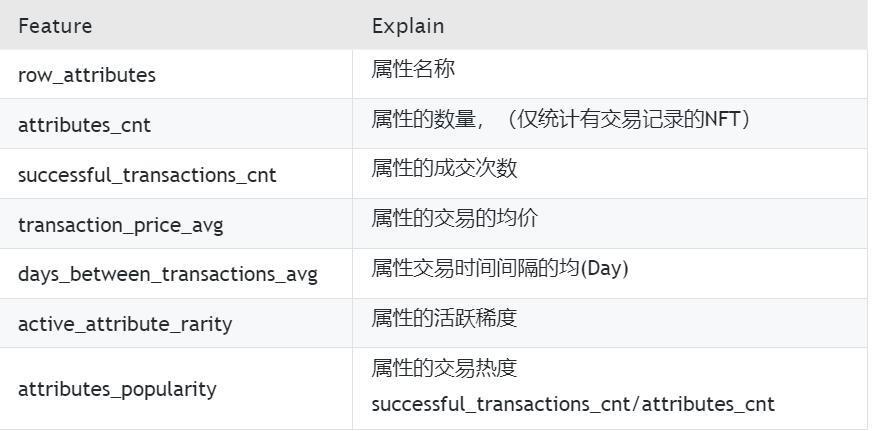
First, we cleaned and processed the historical transaction data of the NFTs and calculated aggregated data, including transaction counts, average transaction prices, transaction intervals, rarity, and attribute popularity values. The relevant explanations are as follows:
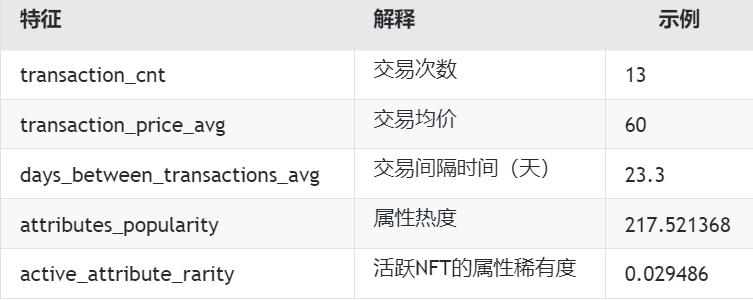
Active attribute rarity (activeattributerarity) ranges from 0 to 1. Active attribute rarity indicates the percentage of rarity of active NFT attributes. Since we only count NFTs with transaction history, the rarity will be lower than that in solanarpopularityt.io, but it is closer to the real market situation.
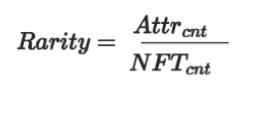
The lower the active attribute rarity, the rarer the attribute.
3.2 Introduction to Pearson Correlation Coefficient
In statistics, the Pearson correlation coefficient measures the linear correlation between two datasets. It is the ratio of the covariance of two variables to the product of their standard deviations; therefore, it is essentially a normalized value of covariance, resulting in values always between -1 and 1. We can use the Pearson correlation coefficient to analyze the correlation of statistical features and find the linear relationships between features.
The Pearson correlation coefficient, when applied to the population, is usually represented by the Greek letter ρ (rho) and can be referred to as the population correlation coefficient or population Pearson correlation coefficient. Given a pair of random variables (X, Y), the formula for ρ is:
Where:
cov is the covariance
σx is the standard deviation of X
σY is the standard deviation of Y
ρ can be expressed in terms of mean and expectation.
3.3 Correlation Analysis of Transaction Data
Based on historical transaction data, we can calculate some statistical indicators, including transaction counts, average prices, transaction time intervals, rarity, and popularity, and then calculate the correlation between these indicators using the Pearson correlation coefficient. The specific results are shown in the figure below:
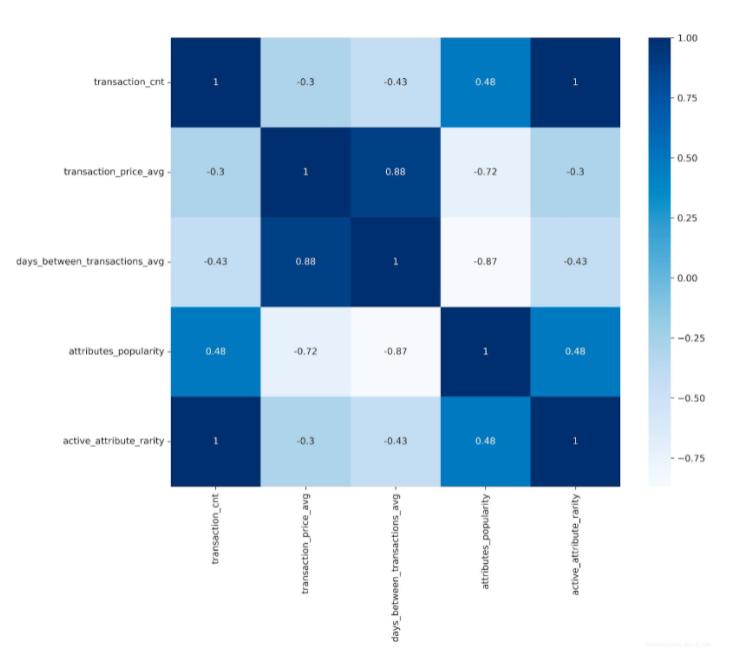
The statistical results form a square matrix where both the X and Y axes represent statistical indicators. The diagonal from the top left to the bottom right indicates all values are 1, representing the self-correlation of attributes being 1. Looking horizontally or vertically represents the correlation coefficients with other features, with coefficients ranging from -1 to 1, where 1 indicates perfect positive linear correlation, and -1 indicates perfect negative correlation. The specific feature explanations are as follows:
Conclusion:
Transaction counts (transactioncnt) show a significant positive correlation with active attribute rarity (activeattribute_rarity), meaning that the rarer the attribute, the more transaction counts there are, indicating higher market activity.
Attribute popularity (attributespopularity) shows a clear negative correlation with average transaction price and a significant negative correlation with average transaction interval days (daysbetweentransactionsavg), meaning that the rarer the attribute, the higher the average transaction price, and the shorter the selling time interval. It can be inferred that the market favors rare attributes more, which have stronger liquidity, and buyers are more willing to pay high prices.
Average transaction price (transactionpriceavg) shows a clear positive correlation with average transaction interval days (daysbetweentransactions_avg), meaning that for most transactions, the higher the price, the worse the liquidity, and the longer the time interval between each transaction. Of course, this is not a completely linear conclusion, as many other factors can also affect price and liquidity.
4. NFT Data Insights
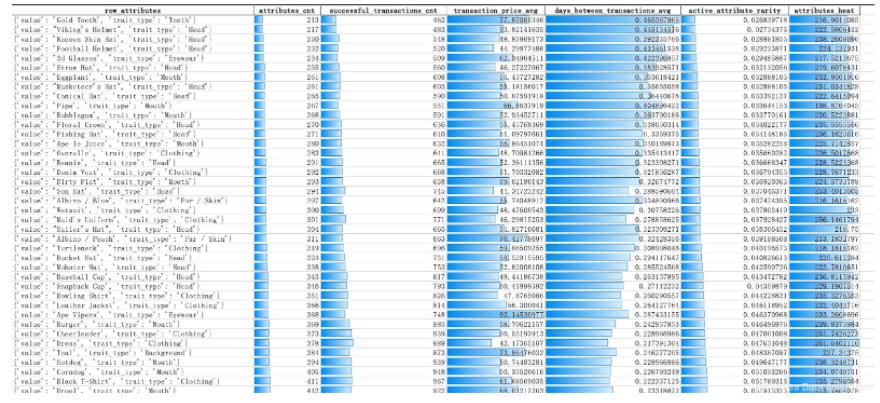
Based on the historical transaction data of NFTs, we statistically analyze the rarity of active attributes, average transaction prices of attributes, and average transaction intervals by the dimension of NFT attributes, and then perform linear fitting on the statistical data to identify undervalued NFT attributes.
4.1 Data Statistics
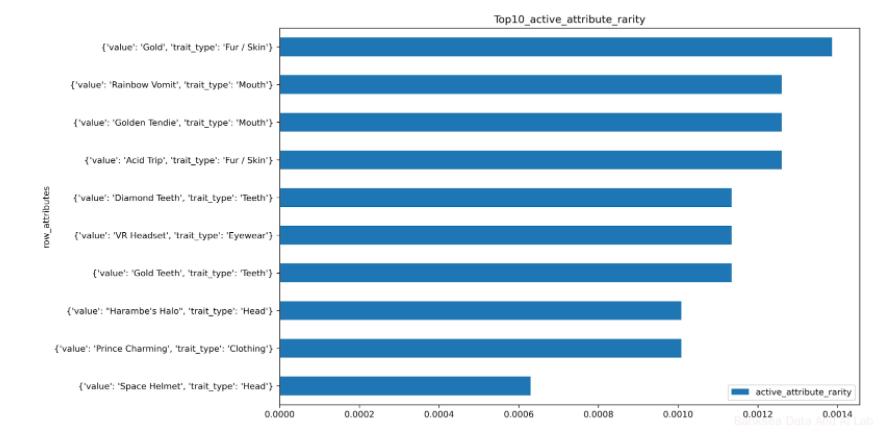
Top 10 Active Attribute Rarity
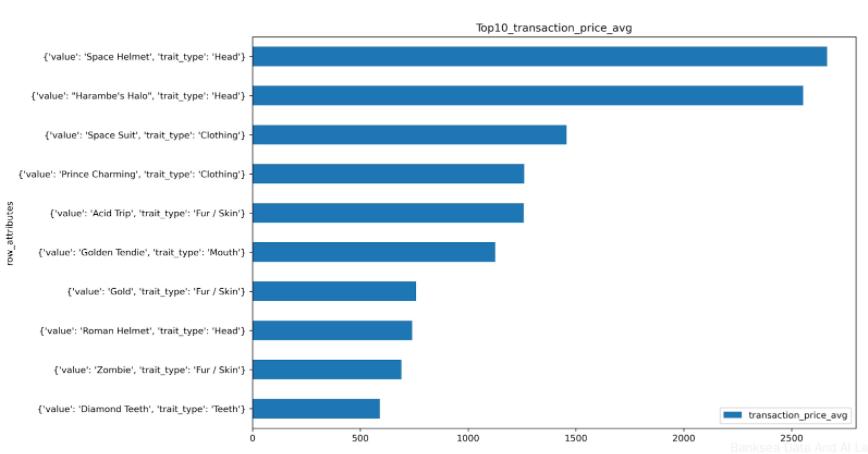
Top 10 Average Transaction Prices of Attributes
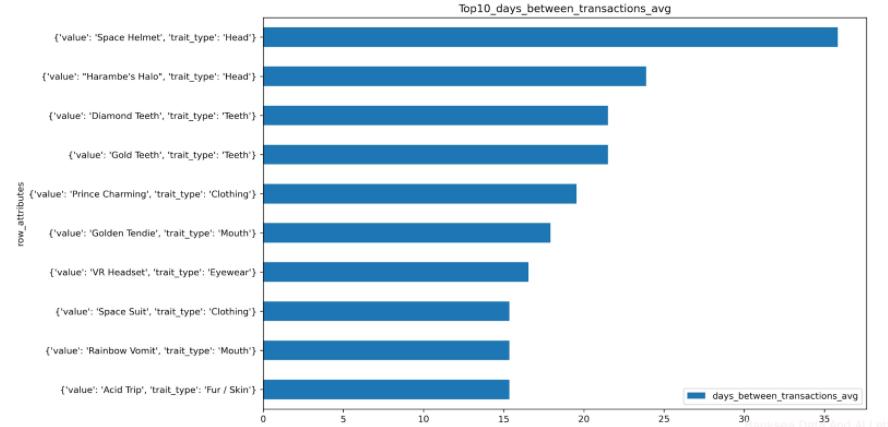
Top 10 Average Transaction Interval Days
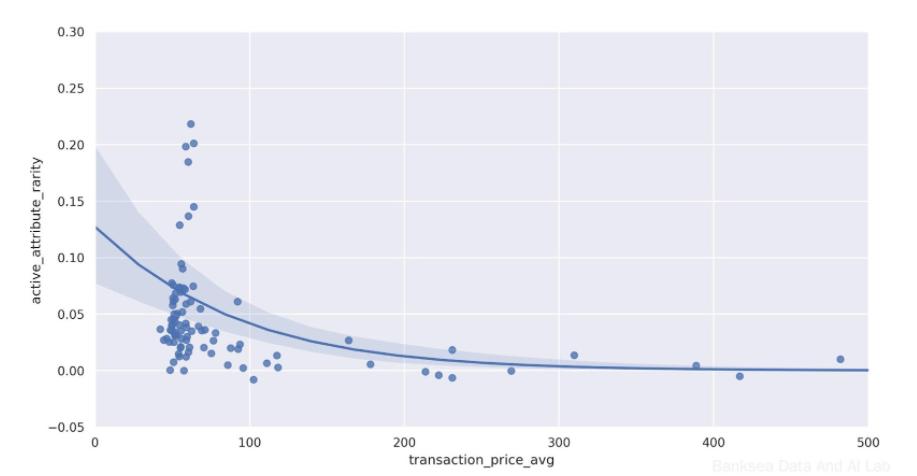
4.2 Rarity & Average Transaction Price Analysis
Based on the above analysis, we know that the rarer an NFT's attribute is, the higher its average transaction price, showing a significant negative correlation. We then perform linear fitting to find attributes that deviate from the fitting curve and are potentially undervalued (i.e., attributes below the fitting curve). When these attributes are traded, the average transaction price is lower than the average fitting price, indicating a possibility of price undervaluation. For example, by applying simple filtering criteria, we filter for active rarity (activeattributerarity) < 0.04 and average transaction price < 100 SOL, and then select NFTs containing these attributes for purchase.
4.3 Rarity & Transaction Interval Time Analysis
Based on the above analysis, we know that the rarer an NFT's attribute is, the higher its price will be, but excessively high prices will suppress transactions, leading to longer transaction intervals and decreased liquidity. Therefore, we need to find those attributes that have acceptable rarity and valuation but strong liquidity (short transaction intervals), which deviate from the fitting curve and lie to the left of the fitting curve, and then filter out these liquid attributes for purchase.
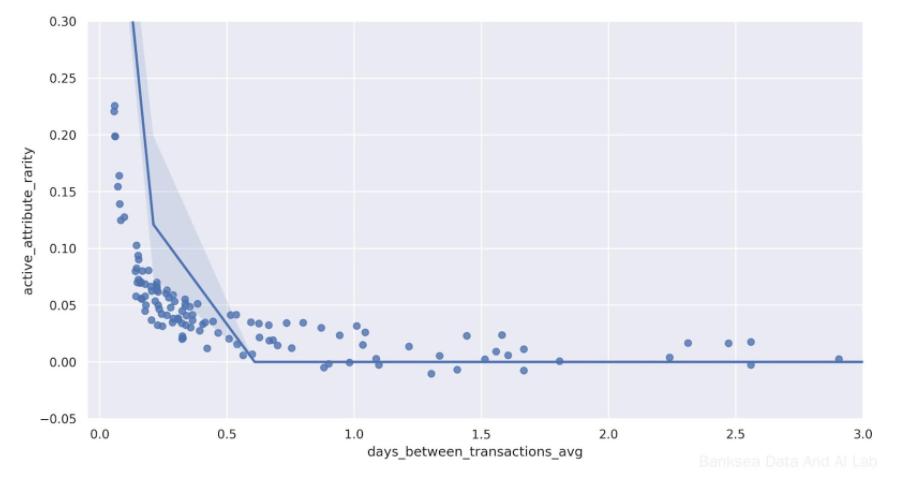
Combining the above analysis of price, liquidity, and rarity, we conduct the following filtering:
Active rarity (activeattributerarity) < 0.4
Average transaction days (daysbetweentransactions_avg) < 0.5 day
Average transaction price (transactionpriceavg) < 100 SOL
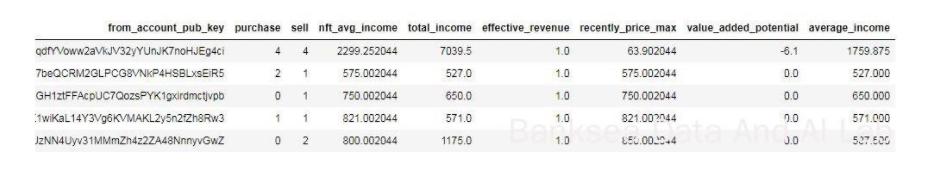
The following is a screenshot of some filtered data; for detailed complete data, please refer to the data acquisition method at the end.
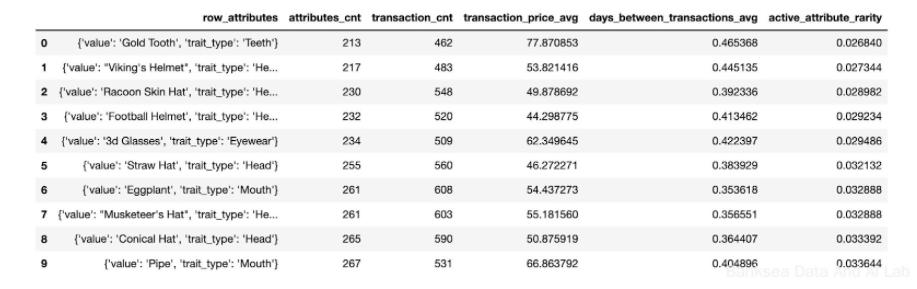
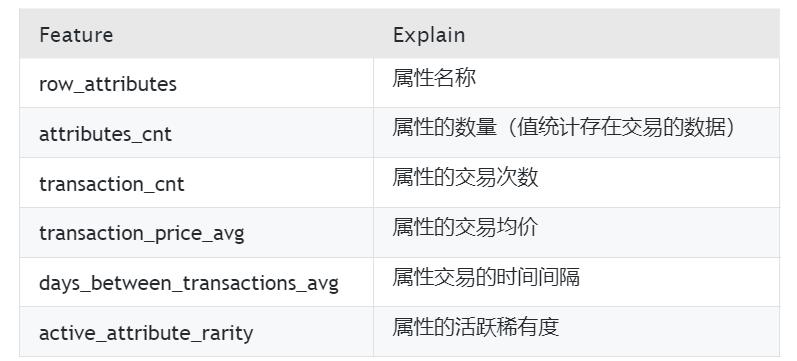
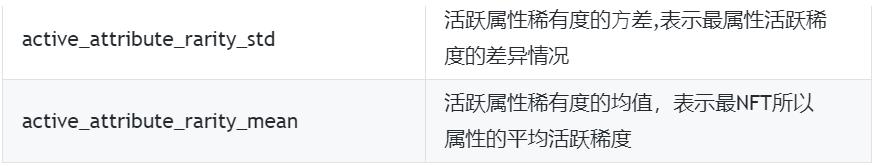
Explanations of some fields
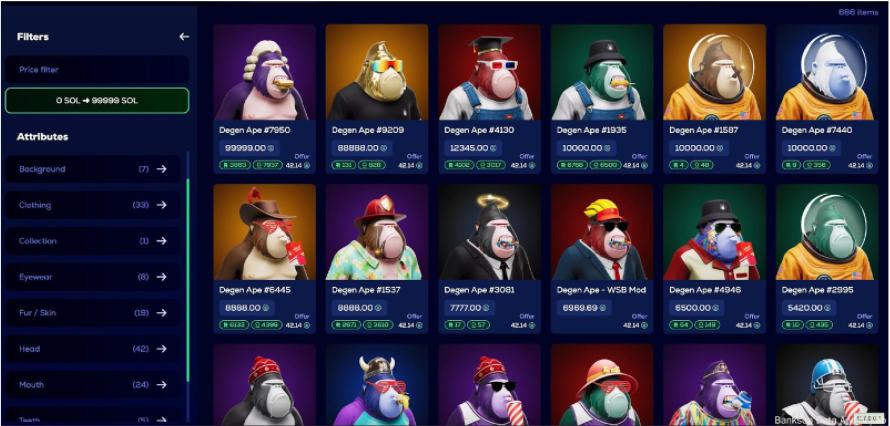
Based on the above analysis results, filter NFTs containing the corresponding attributes on the Solanart platform, and then purchase according to personal preferences.
Degenerate Ape Academy NFT Purchase Link
4.4 Trader Analysis
Holder Selling Efficiency
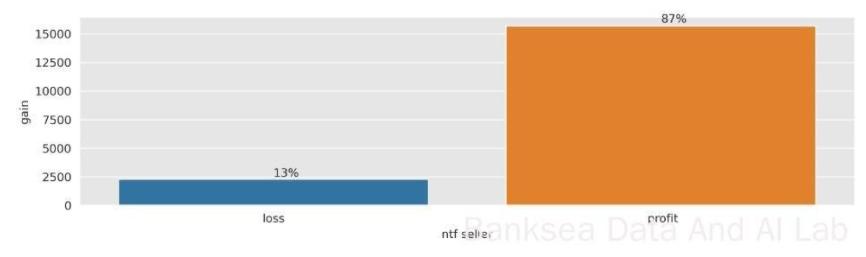
When NFTs are sold, only 13% of the transactions are sold at a loss, while most are sold at a profit during price increases, indicating that most NFT holders are profitable and are also firm holders who recognize the value of NFTs, able to wait for opportunities to realize effective profits.
Top 20 Holders by Total Earnings and their transaction inflow and outflow situation (number of buys and sells)
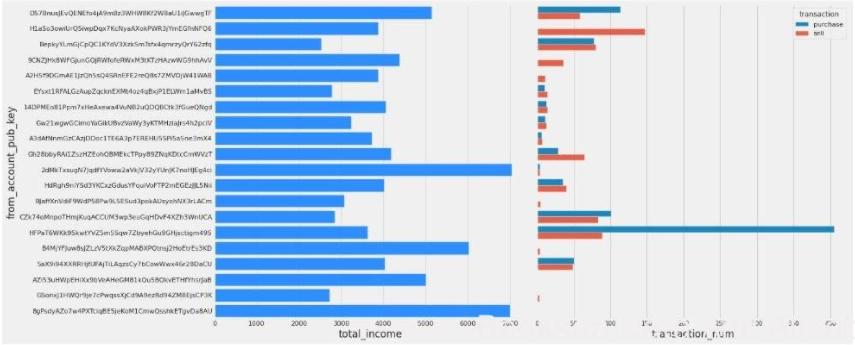
Among the top 20 earners, many are holders who only sell and do not buy, which can be reasonably inferred to be NFT creators. This group of traders appears to have zero cost, but they are not the largest beneficiaries of the entire trading market. The largest beneficiaries come from extreme speculators who buy and sell or hold only a few NFTs but sell them at sky-high prices over a period of time. Therefore, to some extent, NFTs are similar to lotteries; buying the right ones can indeed bring huge returns.
Earnings per NFT Sold for the Top 20 Holders by Total Earnings
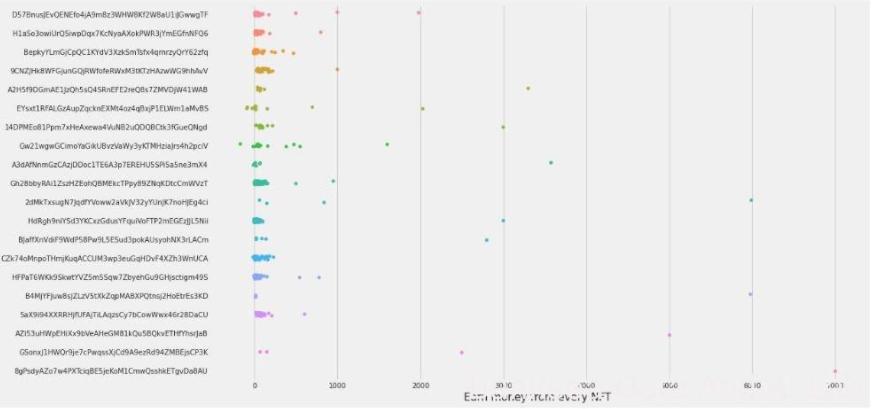
The majority of earnings for the top twenty profitable individuals are concentrated between 0 and 1000, with relatively few NFTs earning more than 1000. Therefore, when selecting NFTs, if it is merely for value investment, the cost can be limited to within 1000, as the profit range of NFTs is limited, and the number of NFTs that can truly skyrocket is very small. If investing steadily, one can still enter the top 20 in earnings.
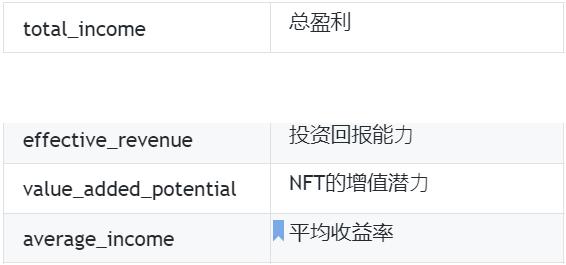
Top 20 Holders by Average Return Rate
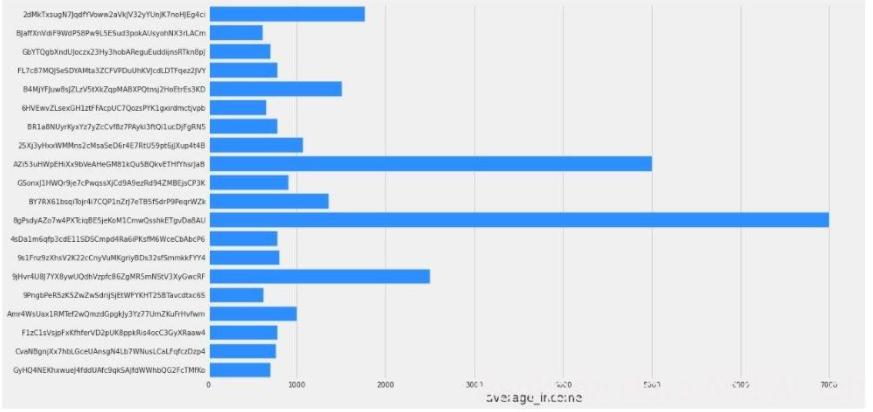
The highest total earnings do not necessarily indicate the best investors. As seen from the above analysis, many investors with extremely low transaction volumes have obtained returns far greater than some NFT creators. These investors either have better insight, better luck, or possibly stronger public opinion control and analytical abilities. Therefore, these investors holding NFTs may become a barometer for other investors. Studying the trading characteristics of these investors can help investors choose NFTs more effectively. By analyzing the average return rate of NFTs, we can clearly identify these investors. If one wants to engage in value investment, they can continuously monitor the investment situations of these NFT holders.
For example, filtering:
Average return rate (average_income) > 500
Investment return capability (effective_revenue) > 0.8

- Advanced NFT Analysis
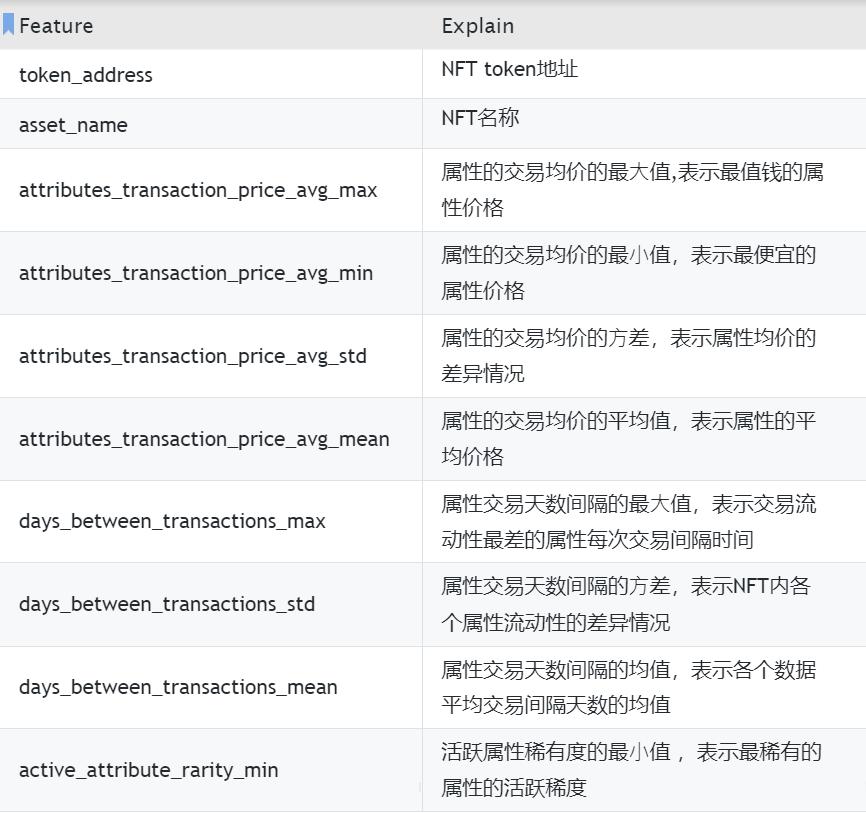
Based on the above analysis, we aggregate the characteristics of NFT attributes and calculate relevant statistical indicators of NFTs to provide data references for NFT purchasers.
Attribute Related Fields:
NFT Related Fields:

TODO
The above text only provides a brief analysis based on market data, and there are many dimensions yet to be analyzed:
- What time periods are loss sales occurring, is there a panic selling situation, and is it a risk period? Are there undervalued NFTs in loss sales?
- What attributes do high earners tend to choose in NFTs?
- What is the final revenue situation for traders who bought in large quantities?
- Which holders' sold NFTs show significant potential? What characteristics do NFTs purchased by holders with the highest average return rates have?
Conclusion
Based on the analysis of the Degenerate Ape NFT series, it can be found that the final transaction prices, rarity, and liquidity have very strong correlations, which to some extent affect the final transaction prices and provide certain references for NFT purchases. However, many factors influence NFT prices. To obtain a reasonable NFT valuation, in addition to transaction data, it is also necessary to consider cryptocurrency market fluctuations, social media data, community opinion data, and other data, and to construct a real-time NFT valuation model to predict and monitor price trends in real-time, thereby reducing holding risks.
 Risk warning Risk warning