LUCIDA × SnapFingers DAO: A Review of 21 Leading Public Chains in the Bull Market

 The market performance of public chain tokens is both explosive and具有良好的抗风险性, making it a very important sector in asset allocation.
Authors: Lisa Yao@SnapFiners DAO, Aao@SnapFingers DAO;
LiHui@LUCIDA, George@LUCIDA, ZnQ_626@LUCIDA, LUCIDA
Continuing from the last time, in the “5 Million Lines of Data Review of the Crypto Bull Market Over Three Years”, LUCIDA analyzed the macro performance of the entire Crypto market over the past three years through data analysis.
In this article, LUCIDA collaborates with the research team from SnapFingers DAO to review the "Public Chain" section.
Introduction
The tremendous success of Ethereum has made smart contract public chains the holy grail pursued by capital. Currently, Ethereum remains the largest and most important platform among smart contract public chains, but due to low performance and high fees, many applications are not suitable for running on Ethereum.
New public chains have taken on the overflow demand from Ethereum due to their performance and cost advantages. Especially during the bull market of 2021, a large number of applications emerged, and new public chain ecosystems exploded one after another, from BSC to Polygon, and then to Solana, while Avalanche, Fantom, and Terra ecosystems also saw significant growth. As Vitalik Buterin stated on Twitter, "the future will be multi-chain," the growth paradigm of public chains during this bull market may provide some insights into the future "multi-chain" landscape.
1. Performance of Public Chains in the Bull Market from 2020 to 2022
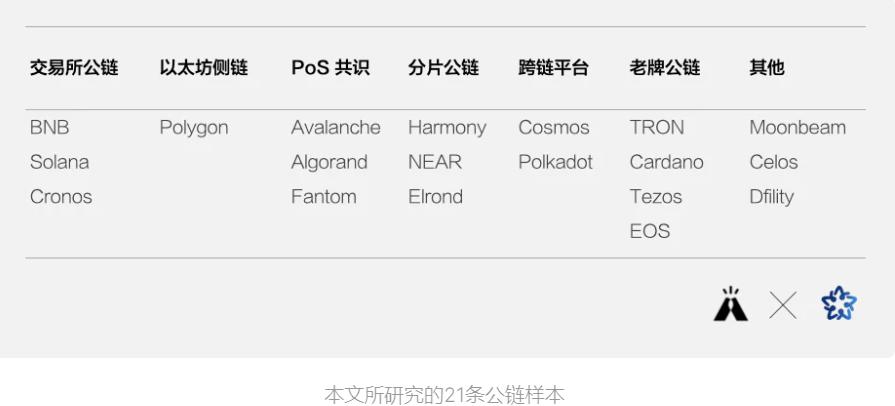
Public chains are the infrastructure of the crypto market and the most important component. The public chains discussed in this article include: smart contract platforms and cross-chain platforms, totaling 21 chains. Apart from Ethereum, the other selected samples and classifications are as follows. The criteria for sample selection are the top 100 by market capitalization, having established their own ecosystems, and possessing a certain level of attention.
For subsequent analysis, we also performed data cleaning and preprocessing.
1.1 Formulation of Public Chain Price Index
The price changes of the 21 public chains are varied and fluctuate. To make it easier for everyone to observe the overall performance of the sector, we created a public chain index (ChainIndex) using a weighted algorithm. The specific algorithm for the public chain index (ChainIndex) is as follows:
Daily Public Chain Index Price = ∑ Daily Closing Price of Target Assets * Daily Weight Coefficient of Target
Daily Weight Coefficient of Target = Average Daily Trading Volume of Target Assets over the Past 30 Days / ∑ Average Daily Trading Volume of Target Assets in the Sample over the Past 30 Days
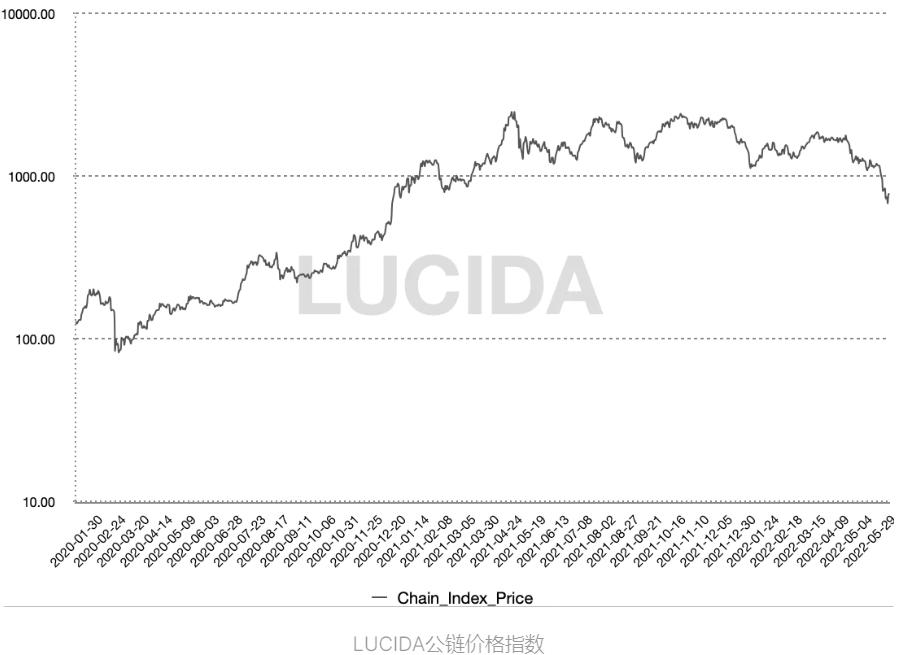
To facilitate the observation of the overall situation of the public chain sector, we created a chart for the public chain index price and changed the axes to logarithmic scales.
1.2 Public Chain Sector Achieves Better Excess Returns and Risk-Reward Ratios in the Bull Market
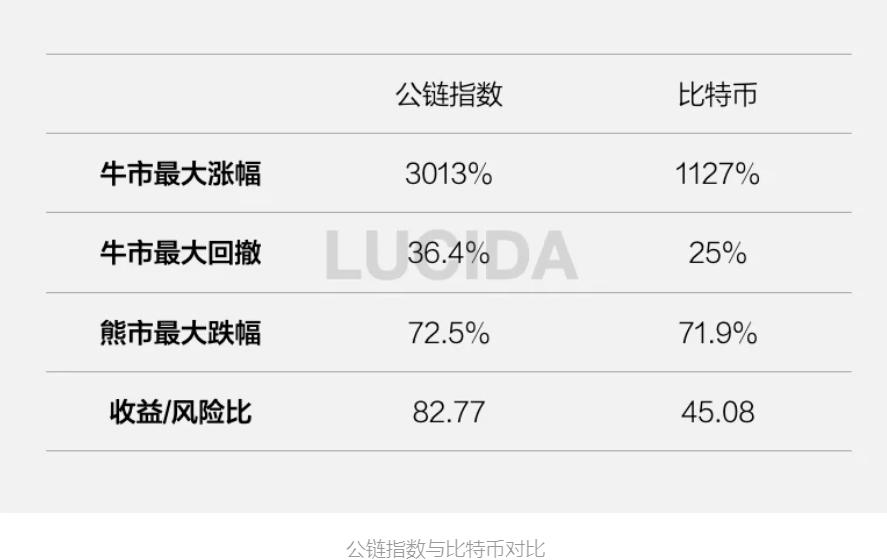
- In this bull market, the maximum increase of the public chain index was 3013%, with the lowest point occurring on March 16, 2020, right after the 312 crash, and the highest point occurring on May 11, 2021.
- The maximum drawdown of the public chain index was 36.4%, occurring between February 18, 2021, and February 28, 2021.
- The maximum decline in the bear market for the public chain index (as of the data acquisition date, June 20, 2022) was 72.5%.
If we compare the maximum increase, maximum drawdown, and maximum decline in the bear market with Bitcoin's performance during the same period, we find that the public chain sector overall has a better risk-reward ratio than Bitcoin. Moreover, as of now, the public chain sector has not shown signs of excessive decline in the bear market, indicating that public chains are not inferior to Bitcoin in terms of defensiveness during bear markets (however, if the bear market continues, the possibility of public chains experiencing a correction cannot be ruled out).
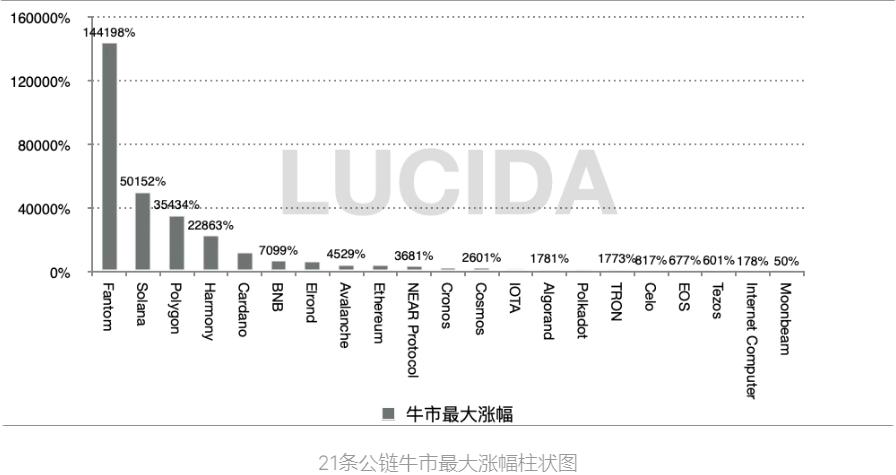
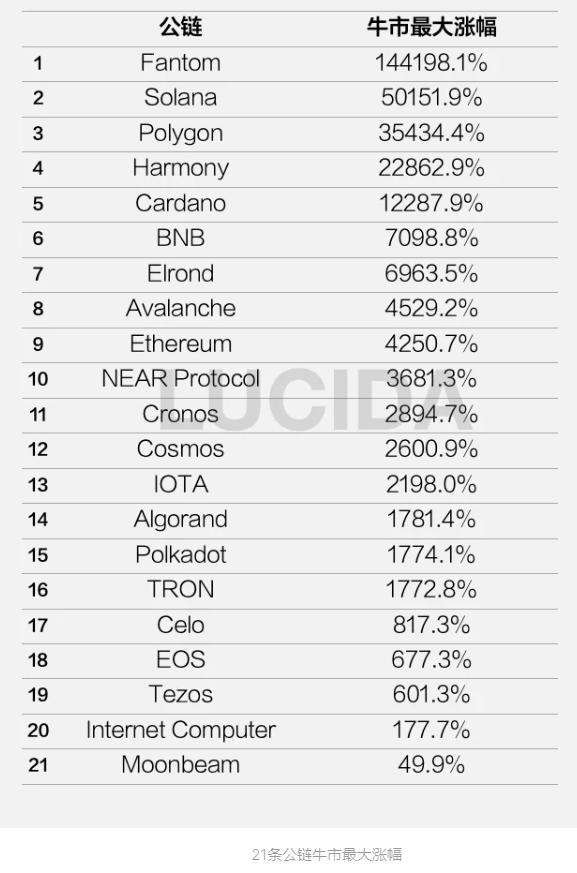
1.3 Significant Divergence in Maximum Increases Among Public Chains: Some Have Increased by Thousands of Times, While Others Peaked Upon Listing
Next, LUCIDA will conduct individual data analysis on these 21 public chains.
First, let's look at the returns.
The above chart shows the maximum increases of the 21 public chains against the backdrop of the bull market. The first place is Fantom (FTM), which reached 144198%, followed by Solana, with a maximum increase of 50152%.
LUCIDA also found that the distribution of maximum increases in the public chain sector is quite dispersed:
- First tier with hundredfold increases: Fantom 144198%, Solana 50151%, Polygon 35434%, Harmony 22862%, Cardano 12287%
- Second tier: represented by Binance, Avalanche, and Ethereum, with maximum increases within 100 times.
- Third tier: represented by Internet Computer and Moonbeam, which peaked upon listing.
Therefore, LUCIDA believes that investing in public chains requires careful selection; otherwise, one may end up being deeply trapped.
1.4 Maximum Drawdown of Each Public Chain is 60%, Lasting 2 Months; BNB is the Most Resilient Public Chain
Having discussed the distribution of returns, let's take a look at the risk aspect.
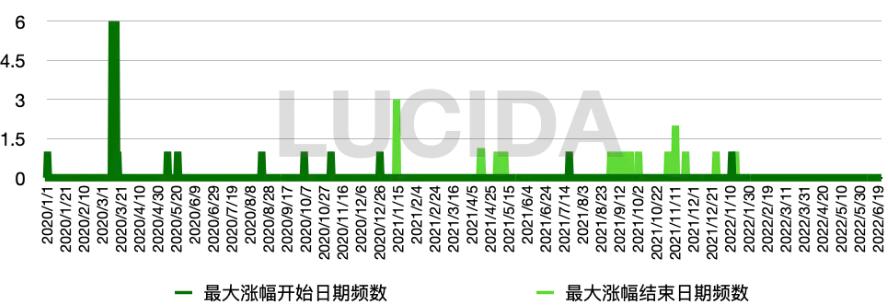
The green chart below shows the time distribution of the maximum increases of the 21 public chains; the vast majority of public chains began to rise from March to August 2020 and peaked successively from September to December 2021, with an average rising period of 467 days.
The red chart below shows the time distribution of the maximum drawdowns of the 21 public chains; the vast majority of public chains experienced maximum drawdowns from February to May 2021 and stabilized and rebounded from June to August 2021, with an average drawdown period of 69 days and an average drawdown magnitude of 59.9%.
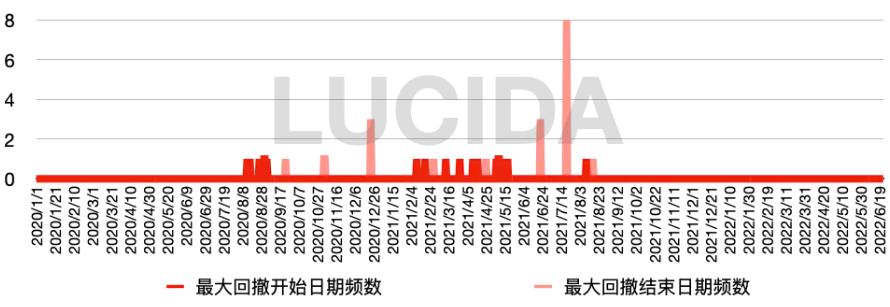
It is worth mentioning that BNB's maximum drawdown was only 36.9%, and it recovered from the decline in just 9 days, making it the most resilient public chain in the bull market.
2. Development Pattern of Public Chain Sector from 2020 to 2022 Bull Market
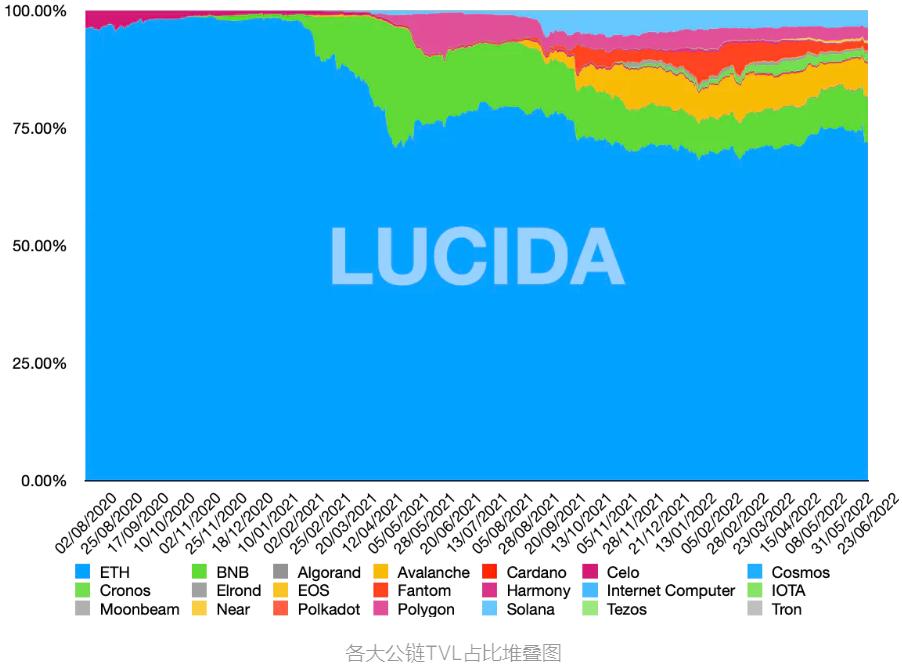
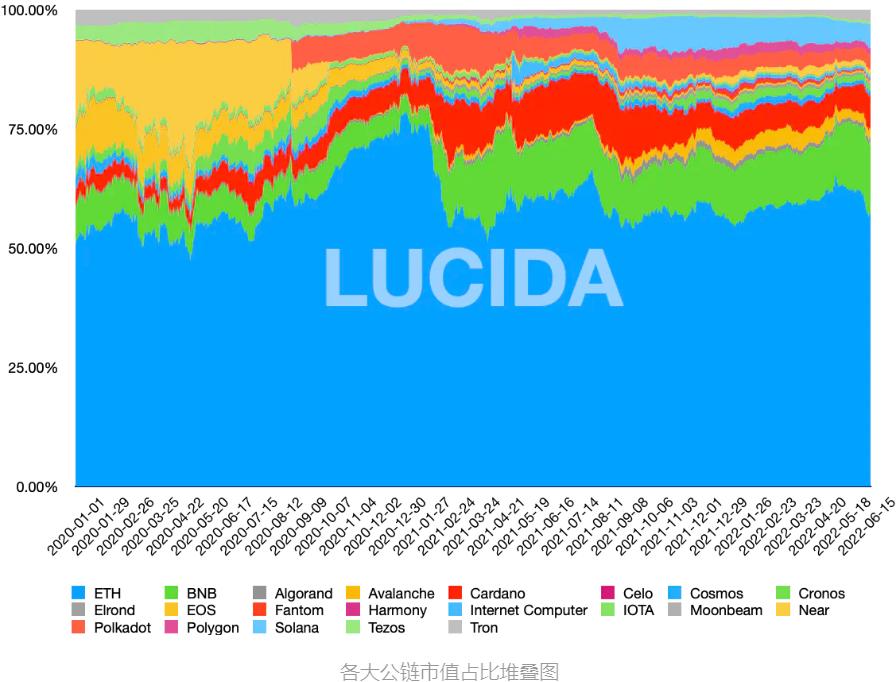
After discussing the overall performance of the sector, LUCIDA will further outline the structure within the sector. In the public chain sector, Ethereum is undoubtedly the leader, consistently maintaining over 50% market share. However, if we break down the public chain sector by TVL share and market capitalization share, we discover some interesting facts.
Starting from February 2021, Ethereum's TVL share suddenly decreased, while the BNB chain suddenly rose. With the rise of the BNB chain, public chains such as Polygon, Solana, Tron, and Avalanche began to squeeze Ethereum's dominance.
From the perspective of market capitalization statistics, starting from February 2021, Ethereum's market capitalization share also saw a significant decline.
Note: The above data is sourced from DefiLiama, which does not provide TVL data for Internet Computer, IOTA, and Polkadot, and the TVL data only starts from August 2020, which may slightly affect the quantitative calculation of TVL share but should not impact the qualitative analysis of the text.
3. Logic Behind the Explosion of Public Chains in the 2021 Bull Market
3.1 DeFi Caused Overcrowding on Ethereum
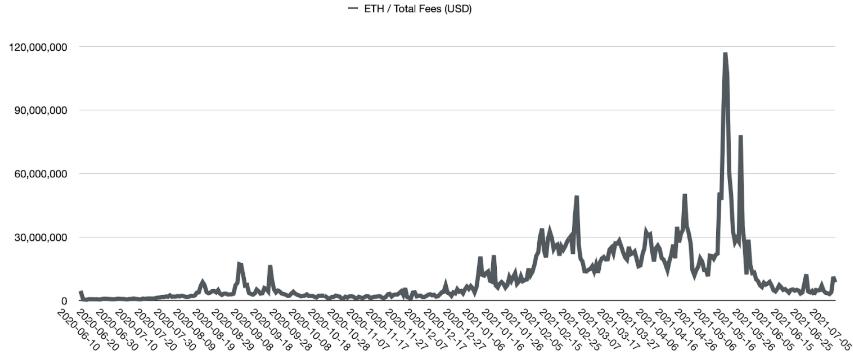
After DeFi Summer in June 2020, the demand for interactions on Ethereum surged, leading to skyrocketing Ethereum Gas fees. The liquidity mining launched by Compound ignited DeFi, and in July, food-themed token mining swept the entire crypto space. High yields completely ignited the passion of the crypto world, and although high yields could not be sustained, DeFi, having undergone a round of cleansing, rose again in the fourth quarter. By the end of the year, not only were numerous new projects launched, but existing leading projects also became more dynamic.
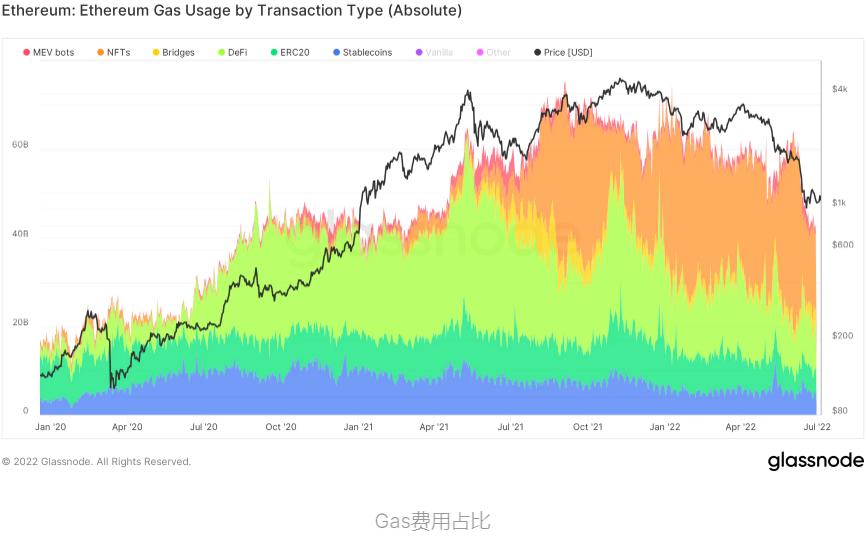
With the prosperity of DeFi, Ethereum's daily Gas fees increased from $447,000 to $49.55 million, a rise of over 100 times (from June 2020 to February 2021), with the highest proportion and fastest growth coming from DeFi transactions.
3.2 BSC Was the First to Seize the Opportunity in the Public Chain Sector
With Ethereum's Gas remaining high and the DeFi wealth effect in full swing, the enormous demand provided an opportunity for new public chains to catch up. The first to seize this opportunity was BSC (later renamed BNB Chain), which officially launched in September 2020. Subsequently, Binance announced the establishment of a $100 million seed fund to support DeFi projects and developers on the BNB chain, further supporting the synergy between CeFi and DeFi ecosystems. On February 2, 2021, just 5 months after its launch, BNB chain reached a milestone—1 million independent addresses. On February 9, the number of transactions on the BNB chain exceeded 1.6 million, surpassing Ethereum's 1.32 million transactions.
The BNB chain, by being EVM-compatible, took on the overflow demand from Ethereum and empowered the BNB chain ecosystem by allowing participation in new projects through the BNB token. In February 2021, the explosion of the DeFi ecosystem on the BNB chain and the BNB market formed a mutually reinforcing relationship.
3.3 Public Chains Like Polygon, Fantom, Harmony, and Avalanche Adopt Incentive Mechanisms to Promote Development
Subsequently, Polygon, which exploded in April-May, also became EVM-compatible. Unlike the BNB chain's method of empowering through the BNB token, Polygon launched a $150 million incentive fund at the end of April, with $40 million directly allocated to liquidity mining incentives for the leading DeFi protocol Aave on Ethereum. In just 2 months, its TVL increased by as much as 68 times.
Ecosystem incentives became standard for the subsequent development of public chains. In September and October 2021, Fantom, Harmony, Avalanche ($180 million), Celo, and NEAR successively launched incentive programs. Some public chains chose to be EVM-compatible, such as the previously mentioned BNB chain and Polygon, as well as Fantom, which can better attract traffic from the Ethereum ecosystem.
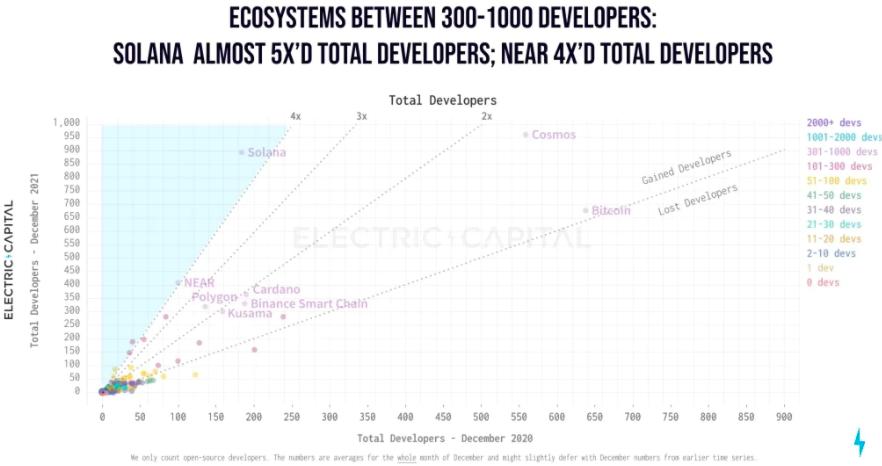
3.4 Solana's "Light Technology, Heavy Ecosystem" Strategy Achieves Overtaking
Solana is among the top tier of public chain tokens in terms of price increase, and its rise is attributed to its strategy of "light technology, heavy ecosystem." Compared to well-known PoS public chains like Avalanche and Algorand, Solana opted for a more centralized technical solution, significantly reducing the difficulty of implementation and allowing for rapid deployment to meet demand. To foster a thriving ecosystem, the Solana team and its investors implemented a series of incentive measures to encourage users to experience their platform, such as introducing liquidity mining, providing subsidies for developers, hosting hackathons, and offering funding for donations.
As shown in the chart below, the Solana chain attracted numerous developers. In 2021, the number of developers in the Solana ecosystem and its growth rate were among the highest.
3.5 NFTs Ignite Demand for Public Chains Again
From the second half of 2020 to the first quarter of 2021, NFTs were the largest source of demand for public chains.
In the second quarter of 2021, NFTs took over from DeFi as the second application area generating significant trading demand. With the involvement of various celebrities, NFTs began to spread and gain traction, leading to a surge of investors and projects, and the trading volume of NFTs continued to expand. As the first public chain, Ethereum holds an absolute advantage in terms of funding, number of developers, and ecosystem scale, thus hosting the most NFT projects. Meanwhile, other public chains' NFT sectors are also developing rapidly. For instance, during the market downturn in May 2021, NFT trading volume on the Solana chain even increased against the trend, making it the second-largest NFT ecosystem after Ethereum.
3.6 Specific Reasons for the Rotation Logic of Public Chains
Therefore, it can be said that the explosion of public chains in this bull market was driven by the prosperity of applications and the insufficient scalability of Ethereum. The rotation logic of public chains can be summarized as follows:
- The prosperity of DeFi caused Ethereum's Gas fees to soar and congestion, a situation that continued into 2021, with the rotation of prosperity in NFTs and GameFi continuously demanding scalability from public chains.
- The enormous demand for various applications during the bull market allowed public chains with rapid technological implementation and abundant funding to seize the opportunity and attract various applications to join their ecosystems.
- Different public chains have different resource endowments; even when using the same "EVM compatibility/cross-chain bridge + ecosystem incentives" formula, the specific strategies differ. The BNB chain and Solana empower through platform tokens, while Polygon introduces leading DeFi protocols from Ethereum.
- EVM compatibility allows for quicker enjoyment of Ethereum's achievements, including fork protocols and developers.
3.7 The Technical Difficulty and Slow Implementation of Cosmos and Polkadot Are Among the Reasons for Their Limited Price Increases
An example of the opposite is Cosmos and Polkadot, which did not benefit much from this bull market. Firstly, the technical difficulty of public chains is high, and implementation is slow. Secondly, their compatibility with Ethereum is not sufficient, requiring separate cross-chain bridges to connect with Ethereum.
LUCIDA believes this also explains why Cosmos and Polkadot ranked only 12th and 15th in the earlier statistics of "1.3 Maximum Increases of Each Public Chain."
4. Moats of Public Chains
After a round of bull market cleansing, new public chains have attracted developers and users, establishing their own infrastructure and application ecosystems. As Vitalik said, the future will be a multi-chain landscape, so what kind of moats have each public chain established after this bull market?
4.1 Ethereum
Ethereum ranks second in market capitalization in the crypto market, with its market share consistently between 17% and 22%, making it highly significant for the entire crypto market. According to the "Q1 2022 Ethereum Ecosystem Report," there are 4011 DApps operating stably on Ethereum, with over 7220 smart contracts.
Ethereum is the public chain with the highest moat, possessing a high degree of network decentralization and security, a large user base, and a significant number of developers. Its infrastructure is well-developed (wallets, oracles, developer tools), and it has a rich variety of applications, forming a network effect and providing a fertile ground for innovation, consistently leading the trend of blockchain applications:
- (2017 - 2018) At the end of 2015, Ethereum proposed the ERC20 standard, which ultimately led to the bull market triggered by the ICO issuance in 2017. In 2017, the issuance of smart contracts expanded the boundaries of blockchain technology, bringing blockchain into mainstream visibility as an underlying technology. During this round of market activity, Ethereum's second-place market capitalization laid the foundation and boosted the valuations of other smart contract platforms and infrastructure sectors; within the ETH ecosystem, the number of DApps exploded, with notable upward trends in NFTs, blockchain games, and forked coins, establishing ETH as a benchmark target in the altcoin market.
- (2020 - 2021) During this cycle, the total market capitalization of cryptocurrencies peaked at $3 trillion, with Ethereum's network transaction volume exceeding $3.6 trillion. Ethereum's market share rose from about 11% at the beginning of 2021 to around 20%. The rotation of sectors within the Ethereum ecosystem during this round of market activity included DeFi (DEX, AMM, liquidity mining, collateral lending), NFTs, memes, GameFi, and the metaverse.
- (2021 - Q1 2022) In the small cycle of the crypto market, in addition to the continuation of NFT and DeFi hotspots, the market's reconstruction of public chain valuation logic propelled the upward trend of public chains.
Throughout this process, every project that emerged in each cycle of the Ethereum ecosystem would experience a reshuffle during bear markets, with only 10%-20% of projects surviving and growing to become important blue-chip projects and commonly used infrastructure in the next cycle.
Despite the trend towards multi-chain, the total locked value (TVL) on the Ethereum network has been somewhat diluted, and the implementation of layer 2 scaling solutions has occurred. As new public chains continue to siphon off Ethereum's developers, users, and applications, Ethereum itself has reduced GAS volatility and the issuance rate of ETH through the EIP-1559 upgrade, paving the way for multiple L2 protocols, including Optimism, Arbitrum, and dYdX.
4.2 Binance Smart Chain
BSC officially launched in September 2020. Shortly after its TVL surpassed $15 billion in the second quarter of 2021, due to the significant price increase of BNB and its derivatives (such as CAKE and XVS), its TVL more than doubled within ten days, reaching $35 billion.
After the major crypto market crash on May 19, BSC became the most active platform for hackers, experiencing six consecutive attacks, with flash loans being the primary attack method, resulting in significant losses and a temporary impact on token prices. Following a series of negative catalysts that impacted the market, including the $200 million Venus liquidation incident and the $45 million PancakeBunny flash loan attack, the euphoria generated by the historical highs quickly dissipated. The increase in exploitations drained user confidence, leading to a sharp decline in token prices and TVL. From March to September 2021, the average market share of TVL remained around 15%.
The advantage of the BNB chain lies in its large user base and the support of Binance's resources, including funding, technology, and manpower. However, its drawback is the high degree of centralization of the network, with the ecosystem heavily reliant on the Ethereum developer community.
4.3 Solana
The Solana protocol's mainnet Beta version was launched in March 2020. As of now, there are nearly 2700 projects on the Solana chain, covering eight major areas including DeFi, wallets, NFTs, infrastructure, and decentralized games, as well as fifteen sub-sectors such as stablecoins, DEXs, and derivatives.
Solana has developed a relatively complete NFT ecosystem foundation, including project tools and trading markets. Magic Eden is an NFT trading market based on Solana. In its early development, it chose to build on the non-EVM Solana due to its high-performance advantages, focusing heavily on the gaming vertical. Currently, trading volume accounts for over 97% of the entire Solana ecosystem. It is noteworthy that Opensea, which previously only supported Ethereum, began supporting Solana in April this year, but the majority of transactions for its leading project, Okay Bears, still occur on Magic Eden.
Due to the relatively low revenue from network fees on Solana, unless dApps and usage increase or fees rise, it may not support a cash flow-based valuation model. Similar to the BNB chain, the Solana network is also highly centralized. As the user base expands, the persistent instability of the Solana network has become evident, with multiple instances of downtime and block production halts. From last year to this year, Solana has experienced several prolonged downtimes, leading to growing skepticism that Solana's innovative mechanisms have not truly resolved the "impossible triangle," but merely preserved "efficiency" at the cost of "security."
5. Conclusion
The market performance of public chain tokens is both explosive and resilient, making them a very important segment in asset allocation. From the perspective of the public chain rotation explosion in this bull market, although Ethereum has a first-mover advantage, the public chain landscape has not yet been determined. Whether through ecosystem incentives, better connections to Ethereum, or the introduction of blockbuster applications, public chains can quickly capture market share. Public chains that have overshot expectations before their official launch or ecosystem explosion tend to perform slightly worse, indicating that the public chain sector is demand-driven.
In this bull market, public chains benefited from the explosion of DeFi and NFT applications, as well as Ethereum's insufficient processing capacity. Those that can provide the performance and funding support needed for new applications will develop rapidly. This logic is expected to differ slightly in the next cycle, as high-quality applications that have weathered market fluctuations will occupy more market share, and the public chains hosting these applications will benefit accordingly.
 Risk warning
 Risk warning

Popular articles