Messari: Ethereum Merge Successful, Q3 Data Worth Noting

 Data analysis of Ethereum's network performance and ecological progress in the third quarter.
Original Title: 《State of Ethereum Q3 2022》
Written by: Tom Dunleavy, Kunal Goel, Messari
Compiled by: Moni, Planet Daily
The Ethereum protocol transitioned from proof-of-work to proof-of-stake on September 15, 2022, and has gained widespread recognition in terms of development depth, decentralized finance ecosystem, and Web3 use cases. However, there are still some key metrics and data to pay attention to before entering the last quarter of 2022.
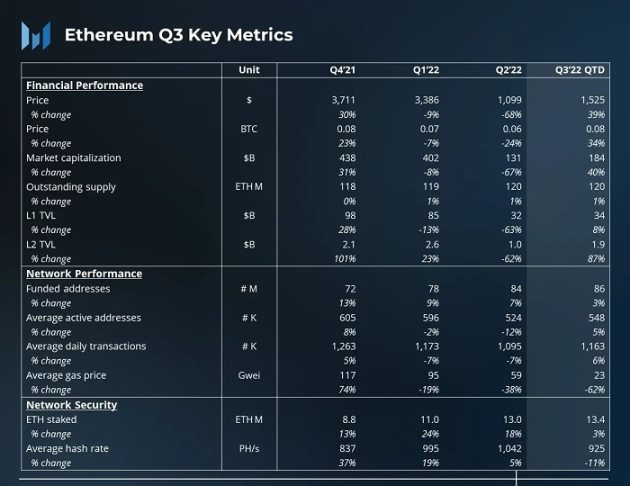
Key Metrics of Ethereum Q4 2021 - Q3 2022
Ethereum Network Performance Analysis
1. Highlights of Q3
After the Ethereum merge, daily block rewards dropped from about 13,500 ETH to around 2,000 ETH, significantly reducing the network's security costs. The number of active addresses and transactions on Ethereum remained relatively stable, with minor month-over-month changes. While the number of addresses may increase with broader crypto adoption, Ethereum's network expansion still primarily comes from L2 rather than higher-performing L1.
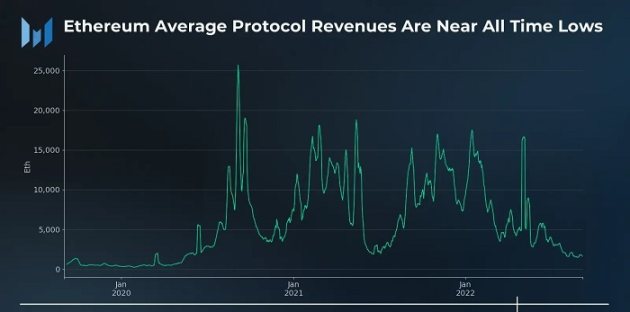
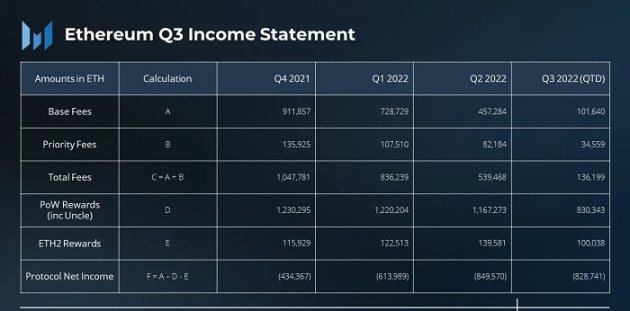
It is noteworthy that Ethereum's total network fees in Q3 2022 plummeted to the lowest level since 2020. If this trend continues into the second half of the year, it will directly impact the staking yield of Ethereum post-merge.
2. Network Performance
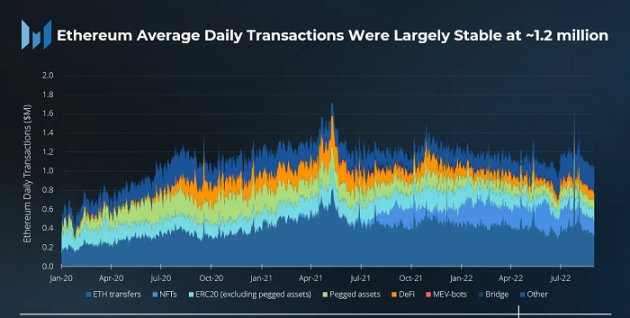
In Q3 2022, the average daily transaction volume on the Ethereum network was 1.2 million, a 6% increase from the previous quarter, with ETH transfers and DeFi transactions growing by 7% and 14%, respectively, averaging 415,000 and 82,000 transactions per day. On the other hand, NFT and bridging transaction volumes saw a decline. NFT transactions fell by 17% to 181,000 transactions per day, while bridging transactions decreased by 41% to 9,000 transactions per day.
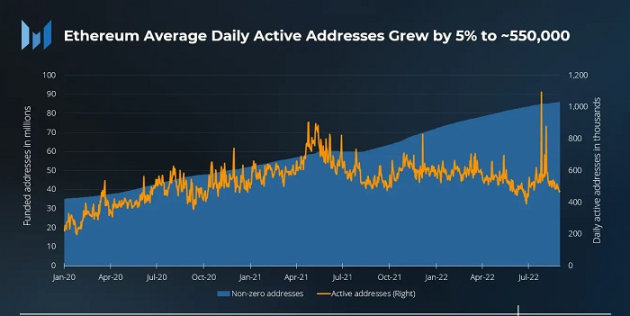
The growth in the number of active addresses on the Ethereum network mirrored the transaction growth trend, with an average of 550,000 active addresses per day in Q3, a 5% increase from the previous quarter. However, this growth was mainly due to a surge in active addresses on July 27, 2022, when the well-known miner Guo Hongcai (Bao Er Ye) announced plans for an Ethereum PoW fork, along with some "maintenance activities" from Binance wallets, suggesting that these active addresses may not be due to an influx of new users or new applications.
During this period, the ETH supply increased by 0.7%, with an annualized growth rate of 4.2%. All inflation came from PoW rewards, as the consumption of transaction base fees slightly exceeded the inflation from beacon chain rewards.
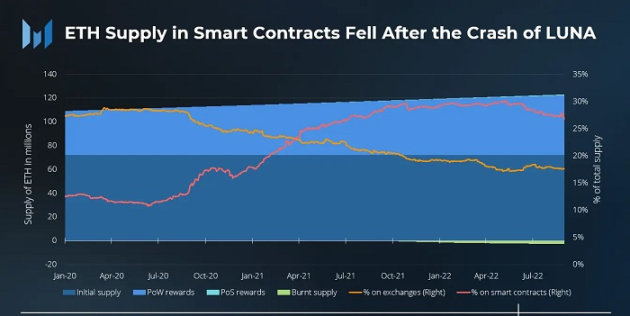
Since 2020, the use of ETH in smart contracts has been on the rise due to the increasing number of digital assets used in DeFi and other applications. However, the collapse of Terra seems to have weakened market trust in smart contracts, even across the entire ecosystem. On May 9, 2022, the same day as the Terra collapse, the percentage of ETH in smart contracts peaked at 30% and has been on a downward trend since. By the end of August, the proportion of ETH in smart contracts dropped to 27%, a 2% decrease from the end of June.
3. Market Indicators
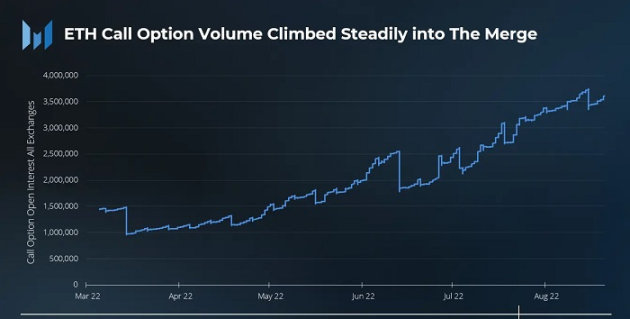
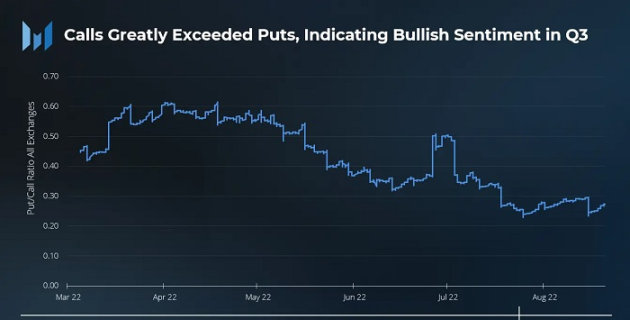
The Ethereum merge event led to an increase in bullish bets in Q3, with the ratio of call options to put options rising. Data shows that the strike price of call options expiring on September 30 reached a high of $5,000, while those expiring on December 30 reached $2,500. The strike prices of call options indicate that investors may be more focused on Ethereum options contracts expiring in December this year.
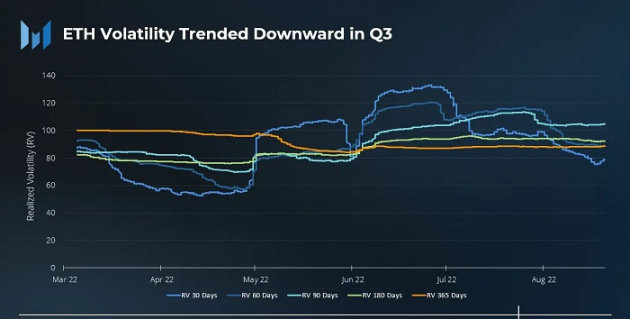
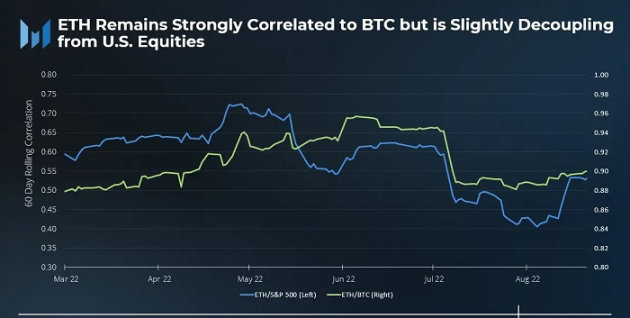
Throughout July and August, the daily volatility of ETH was much lower. Following a challenging second quarter, both the cryptocurrency and stock markets experienced a decrease in absolute volatility. The correlation between Ethereum and Bitcoin remained around 90%, while the correlation with the S&P 500 index slightly decreased.
4. Layer 2 Analysis
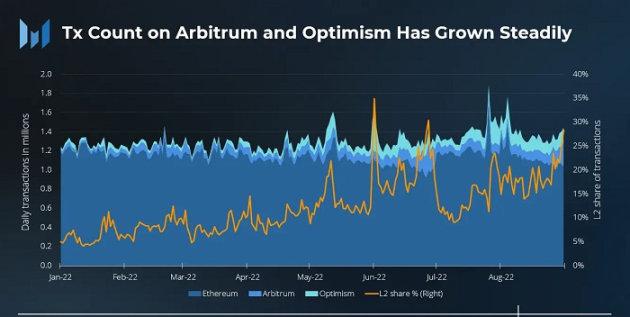
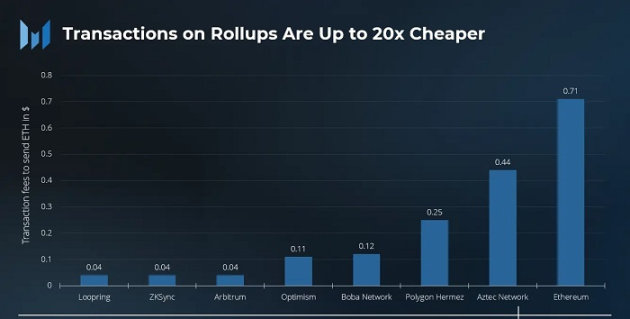
While the average transaction volume on Ethereum may remain within a reasonable range, L2 transactions have seen significant growth. The average transaction volume on Arbitrum increased nearly threefold, from 39,000 transactions in January 2022 to 115,000 transactions in August 2022. During the same period, Optimism's transaction volume also grew nearly 3.5 times, from 41,000 transactions to 142,000 transactions.
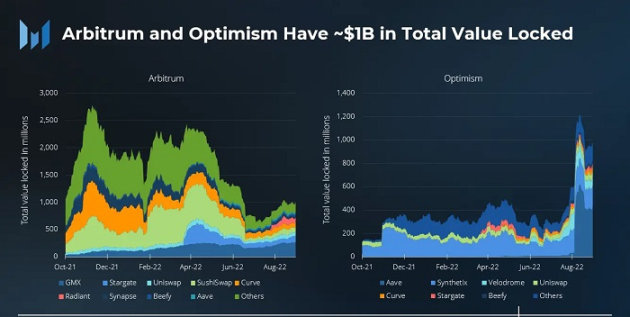
The emerging underlying ecosystems are driving L2 activity, with L2 applications attracting considerable usage and attention, such as GMX on Arbitrum and Synthetix on Optimism, which are also among the largest drivers of TVL on their respective platforms. However, with OP incentives going live and an anticipated Arbitrum airdrop, we find that the growth of L2 may not be coming from organic users.
5. Other Factors Contributing to L2 Growth
- The Arbitrum Nitro upgrade has gone live, and Arbitrum Odyssey is expected to resume.
- Three different teams announced breakthroughs on zkEVM: Polygon, zkSync, and Scroll. zkSync's zkEVM is expected to launch its mainnet in Q4.
- StarkNet announced plans to launch its own token.
Subdomain Analysis
1. DEX
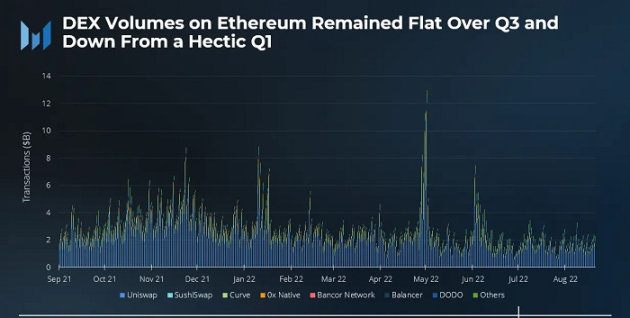
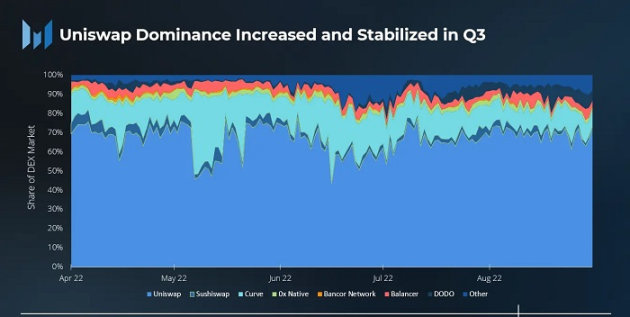
In Q2 2022, the average daily trading volume of DEX was $2.78 billion, which dropped to $1.83 billion in Q3, with year-on-year trading volume declining to about $800 million. During this period, Uniswap's dominance increased from 60% at the end of Q2 to 72% by the end of August, maintaining around 75% of the DEX market share throughout Q3.
2. Lending
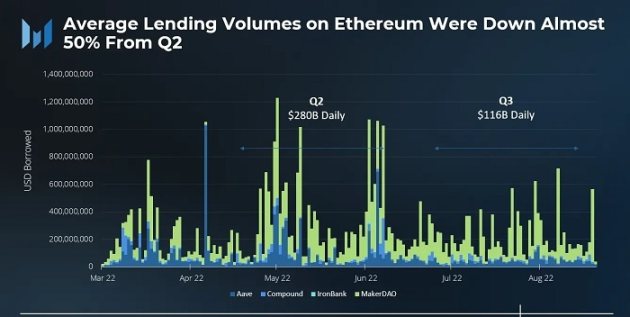
In Q3, the average loan transaction volume in the crypto market plummeted. It dropped from an average of $280 billion per day in Q2 to $116 billion. July was a notably slow month, while August saw a slight rebound in trading volume, mainly due to increased demand for spot ETH from the ETH POW airdrop.
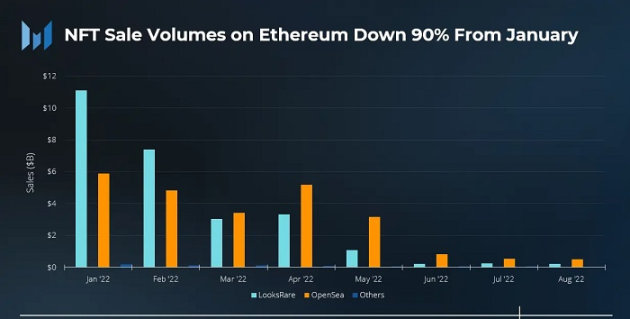
3. NFT
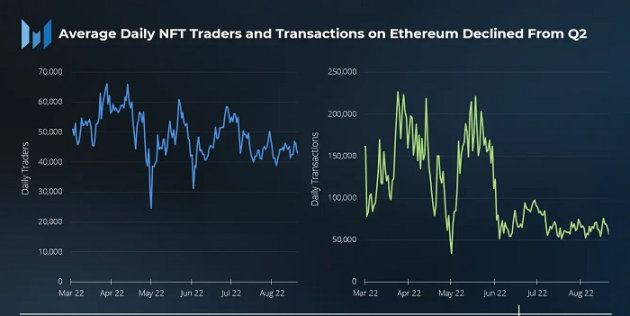
The average daily trading volume of NFTs saw a significant decline, but the drop in the number of daily traders was not as severe as expected, with the NFT industry still attracting about 40,000 loyal users daily on average. The average monthly NFT trading volume in dollars for Q3 decreased by 90% compared to January, with sales totaling less than $1 billion, while Q2 saw as much as $4.6 billion. It is important to note that the decline is not only related to the slowdown of the NFT market but also to the drop in ETH prices. OpenSea continued to hold the largest market share in NFT trading in Q3.
Sudoswap launched in Q3 2022, similar to Uniswap's liquidity pools for NFTs, with its trading volume peaking in August.
4. Stablecoins
Stablecoins are closely correlated with Ethereum. Although the trends and overall trading volume of stablecoins remained largely unchanged compared to Q2, several policy events in Q3 are noteworthy, such as:
After the U.S. Office of Foreign Assets Control (OFAC) sanctioned the privacy protocol Tornado Cash's smart contracts, Circle, the organization behind USDC, banned 38 addresses.
- MakerDAO's DAI plans to reduce its holdings of the centralized stablecoin USDC.
- Tribe DAO plans to dissolve, with all FEI to be redeemed.
- Circle launched a euro-denominated stablecoin, EUROC.
- Aave announced the launch of a dollar stablecoin, GHO.
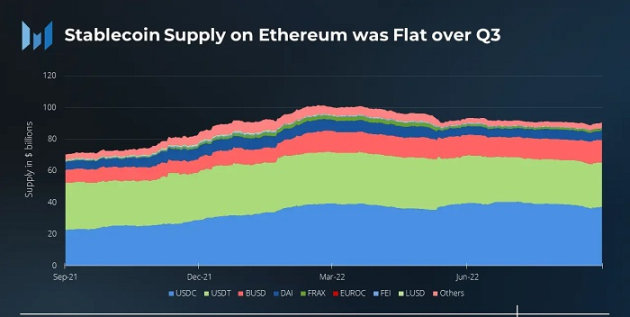
USDC's market share fell to 41% in Q3. The decline was primarily due to being "absorbed" by BUSD, which saw its stablecoin market share increase from 14% to 16%.
L1 Competition Analysis
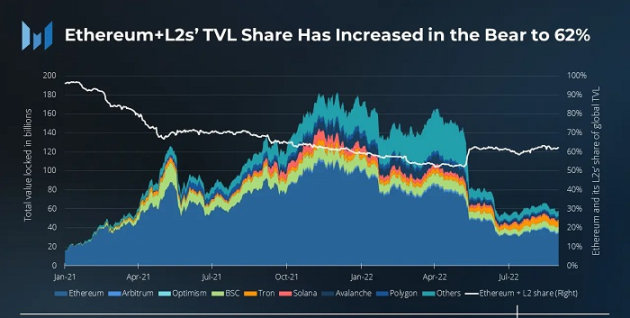
Currently, Ethereum and its L2 ecosystem account for 62% of the total TVL in crypto smart contracts, with Ethereum contributing the largest share at $34 billion, while Arbitrum and Optimism each contributed $1 billion. In the long term, Ethereum and its L2's share of TVL has been declining since early 2021.
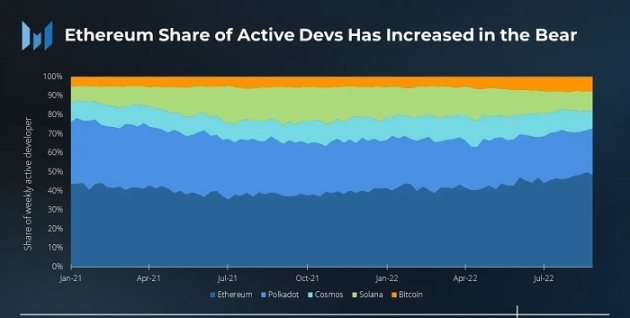
Developers are the "key moat" for the thriving Ethereum ecosystem. Compared to other cryptocurrency ecosystems, the number of active developers on Ethereum remains far ahead, even during the bear market, with Ethereum's development activity share increasing by 10% compared to last year.
Conclusion
Despite being in a crypto bear market, Ethereum remains the most active crypto ecosystem, with the majority of developers, users, and applications. The successful transition to PoS contributes to Ethereum's further development. However, with "Layer 1 challengers" like Aptos, Sui, and Celestia launching in Q4 2022, Ethereum must solidify its "moat" and accelerate its roadmap to maintain its leading position in the smart contract space.
 Risk warning
 Risk warning


Popular articles