EMC Labs: Fear Squeezes Liquidity, How Did This Round of Adjustment Start and End?
Author: EMC Labs
Macro Market
In the EMC Labs May briefing, we pointed out that "……there is reason to expect a continued rebound in June, and we believe the market will attempt to provide answers before mid-month."
The rebound has arrived as expected! After briefly breaking below the lower edge of the upward channel on June 15, BTC rebounded sharply. From June 15 to 23, in 9 trading days, it rebounded 14.44%, recovering the maximum decline of 36% sustained over two months since mid-April.
Throughout June, BTC opened at $27,210, dipped to a low of $24,800, and finally closed at $30,472, with trading volume slightly increasing.
Based on the strong performance of the job market, the Federal Reserve made hawkish statements in June, suggesting the possibility of two rate hikes in the second half of the year to curb inflation back to normal levels. In the capital markets, after pausing rate hikes, the U.S. stock market launched a fierce offensive around AI concept stocks, driving the Nasdaq and Dow Jones to continue rebounding. It can be said that both the employment indicators reflecting economic trends and the stock market indicators reflecting capital trends show that the U.S. performance is very strong. The market seems to have temporarily forgotten the so-called economic recession.
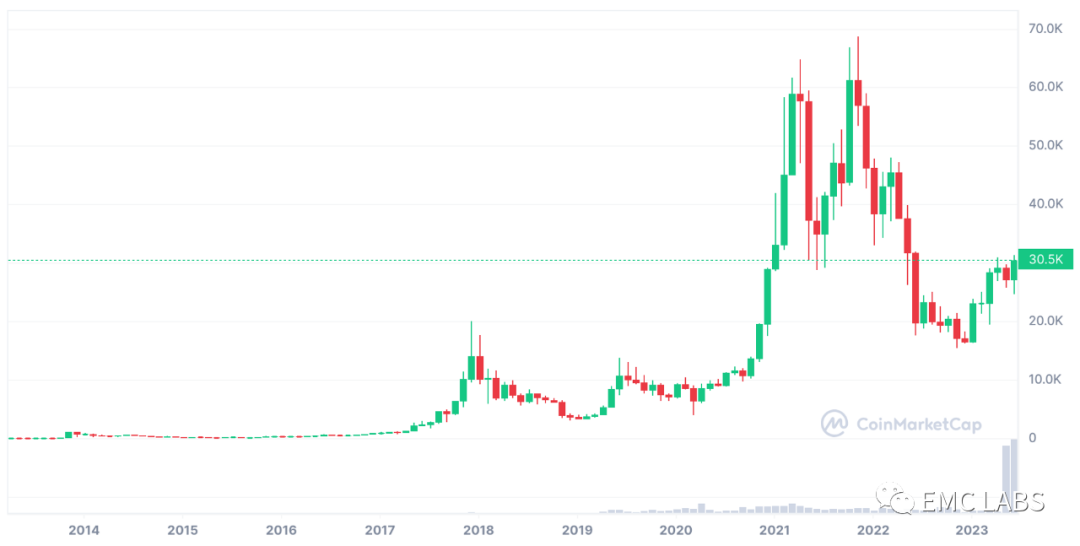
After the major clearing, 2023 is destined to be a year of strong counterattack for BTC. In the first half of the year, BTC opened at $16,541 and closed at $40,472, recording an 84% increase, significantly outperforming the Nasdaq's 34% rebound, and achieving five consecutive monthly gains with one loss, maintaining a strong rebound trend!
Cryptocurrency Market Trends
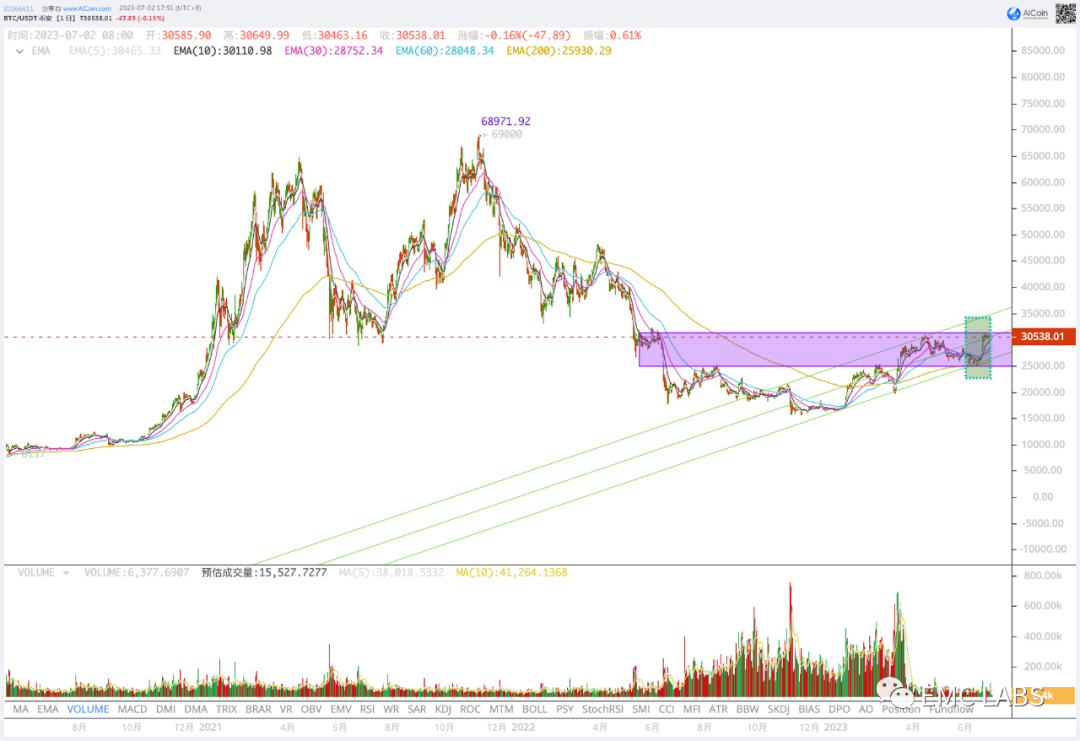
From the perspective of resistance lines, BTC has returned to the upper resistance level near $31,000, which was previously tested in mid-April.
From the trend lines, the upward mid-track has risen from $26,000 in mid-April to $30,000. Although there were one or two days of false breakdowns in mid-June, they were quickly recovered, and the upward channel has been maintained well.
The EMC Labs Emergence Engine determined that BTC entered a "repair period" in January, and the rebound that began in January is defined as a repair market for replenishing inventory.
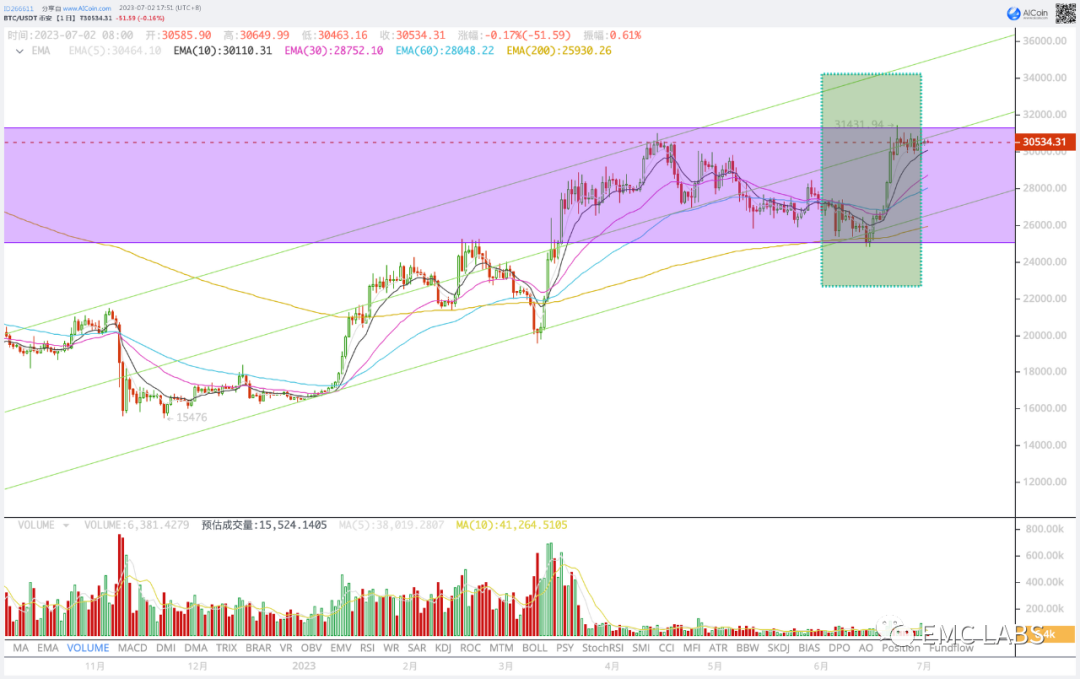
From January 8 to March 10, it was the first wave of rebound.
From March 11 to June 14, it was the second wave of rebound.
Starting from June 15, BTC officially began the third wave of rebound.
As the inventory replenishment rebound reached certain heights, such as $25,000 in mid-February and $31,000 in mid-April, market participants began to diverge, either locking in profits and selling or holding on with high aspirations.
This divergence led to two pullback adjustments from February to March and from April to June, with adjustments of 26% and 20%, respectively.
The two adjustments cleared out cheap chips bought at the bottom.
Let’s take a closer look at the most recent two-month adjustment trend------
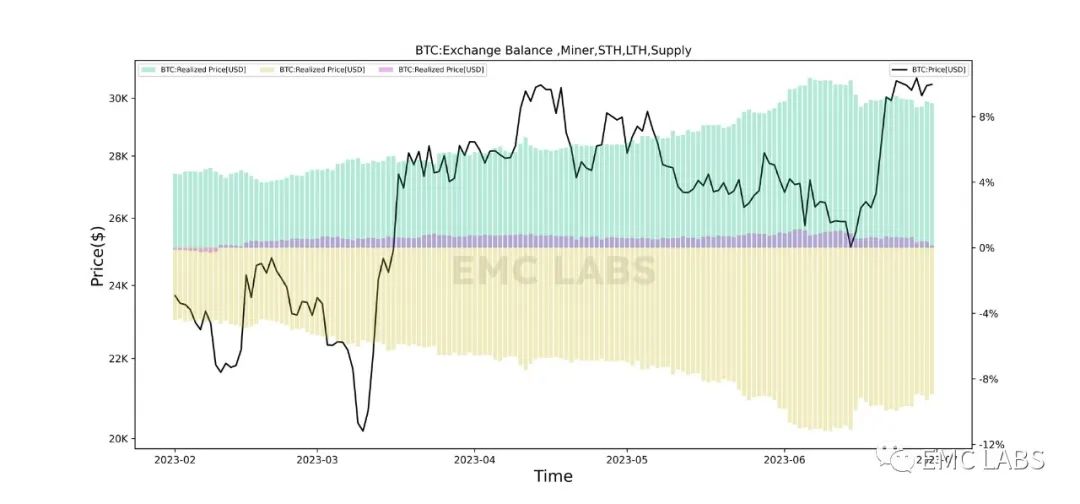
The U.S. region was the biggest loser in this round of clearing. By June 15, they had lost nearly 5% of their positions. Behind this was the continuous rebound of U.S. AI concept stocks creating a siphoning effect on funds, along with pressure from the SEC's lawsuits against Binance and Coinbase, as well as accusations against several well-known POS public chain projects regarding securities.
These events were the fundamental reasons driving U.S. market participants to continuously reduce their holdings. However, when the sellers noticed that the SEC's crackdown had come to a pause and that established financial institutions like BlackRock continued to push for BTC ETF applications, they quickly stopped reducing their holdings and began to replenish their positions. This replenishment directly drove BTC to recover all losses over the past two months within just over a week.
Strength vs. Weakness
In terms of market cycles, the struggle between strong and weak hands is the underlying market structure. This is no exception for the current round of adjustments.
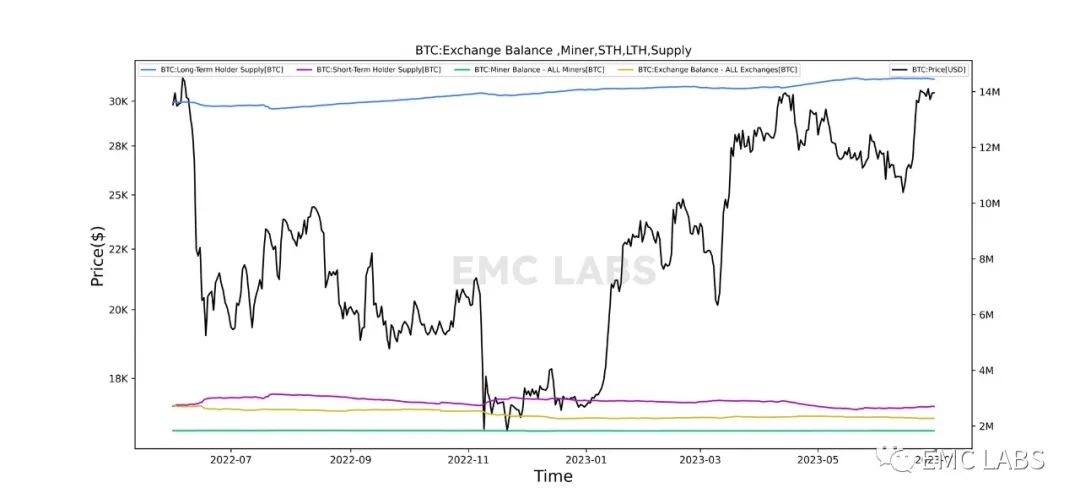
Strong hands: 1414.77 1446.97 32.21 445.33 30.56 Weak hands: 289.14 265.07 -24.07 270.58 -18.56 Miners: 182.53 182.97 0.44 182.78 0.25 CEX: 232.96 230.45 -2.51 227.98 -4.98
During this round of adjustments, weak hands sold over 240,700 BTC, and even after the rebound, they still lost 185,600 BTC.
Meanwhile, strong hands continued to increase their holdings, with BTC holdings rising from 14,147,700 on April 14 to 14,453,300 on June 30, an increase of 305,600 BTC.
BTC on CEX exchanges continued to flow out, with a total outflow of nearly 50,000 BTC during this period.
The cryptocurrency market cycle is a game of exchanging BTC between strong and weak hands within a temporal and spatial range. Before the arrival of an upward phase, strong hands will continue to increase their positions, while weak hands will continue to decrease theirs. Because strong hands are accustomed to low-frequency trading while weak hands prefer high-frequency trading, the essence of the phenomenon where weak hands' holdings continuously flow into strong hands before the upward phase arrives is------liquidity is continuously absorbed.
This absorption began during the bear market and continued at the bottom and during the repair period. The two adjustments that occurred since January are two specific interpretations of the liquidity absorption game.
Supply Trends
Through on-chain data, we can analyze the cost structure of different market participants.
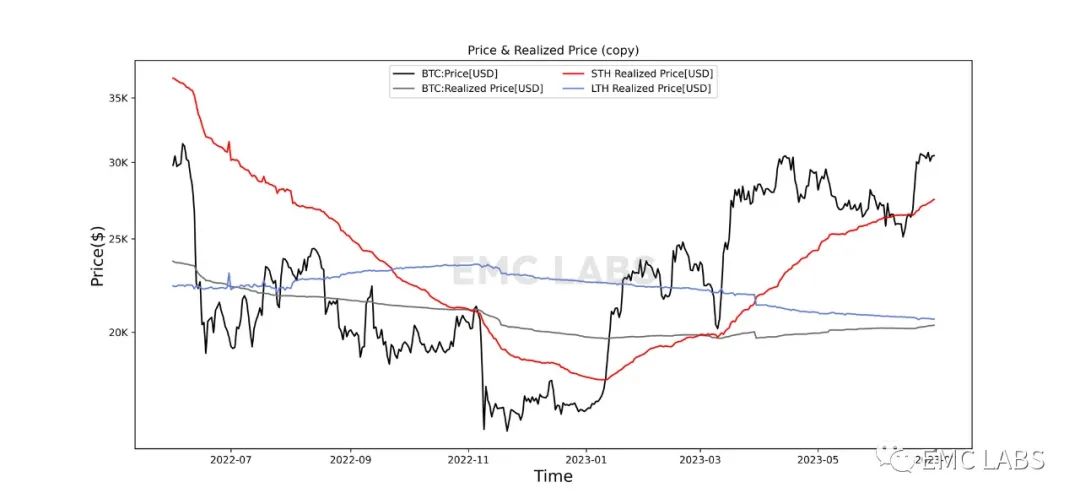
Strong and weak hands adopt different strategies to participate in the market at different stages.
In the "repair period" we have identified, which is the current stage of the market------
During a decline, when the price is below cost, strong hands often choose to continue increasing their holdings, while weak hands choose to capitulate continuously.
During an increase, when the price is above cost, weak hands often take profits and sell, while strong hands tend to continue holding.
After June 15, BTC rebounded strongly, and as of now, both strong and weak hands are in profit. The average profit level in the market has significantly increased from 27% on June 14, and looking closely at the profit structure------strong hands have reached 48%, while weak hands are around 11%, indicating that strong hands hold a higher proportion of profits.
In the repair period, the main selling force comes from weak hands. Compared to April 14, the current market at $30,000 has significantly reduced selling pressure, as more chips have flowed into strong hands.
Therefore, EMC Labs predicts that after the market oscillates, BTC is likely to choose an upward trajectory, potentially breaking through the $31,000 resistance level in July.
On-Chain Activity
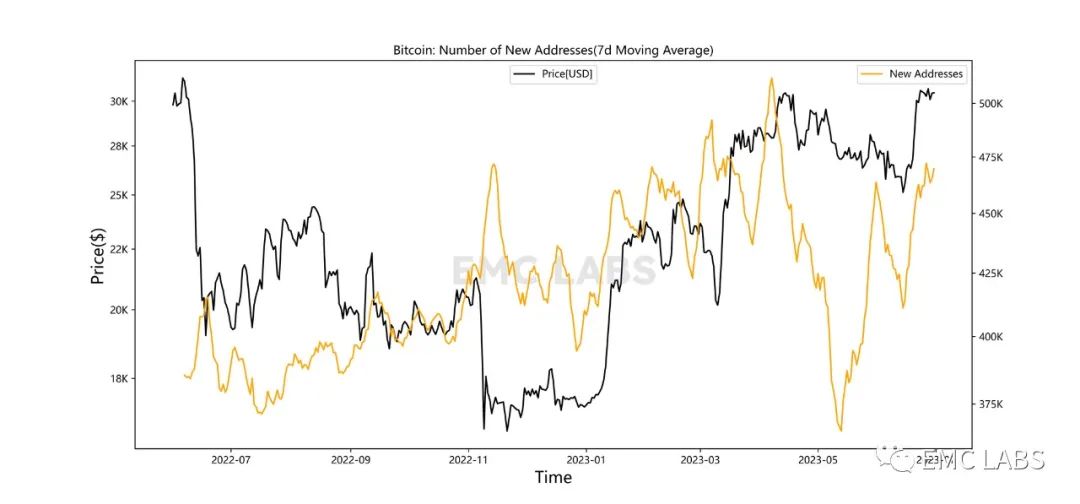
On-chain activity is the most fundamental support for market prices. In this round of rebound, we noticed that new on-chain addresses appeared before the price rebound.
The value transfer on-chain also shows a stable upward trend.
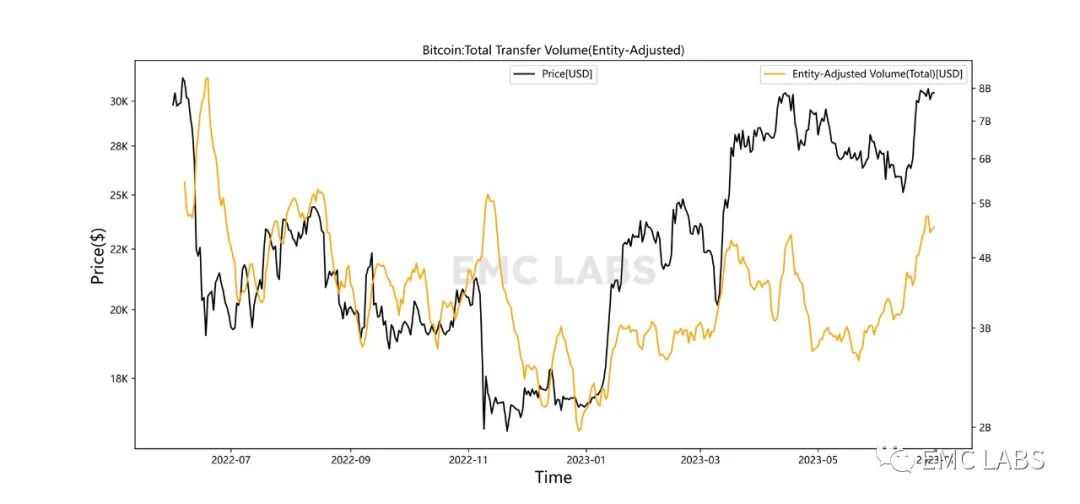
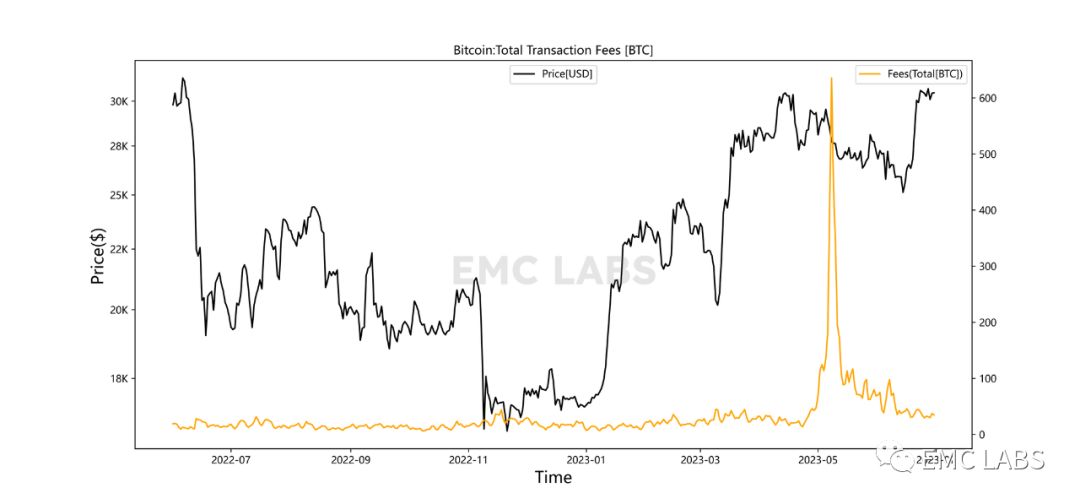
After the Ordinals frenzy, miner consumption revenue has continued to decline back to repair period levels, indicating that the current level of on-chain activity (including scale and frequency) still does not support the start of a bull market. However, the current revenue level is also higher than the bear market bottom, at a normal level for the repair period.
Incremental Funds
The initiation of a bull market must be accompanied by a continuous influx of large-scale incremental funds, while in the repair period, it is more about the replenishment of on-site funds.
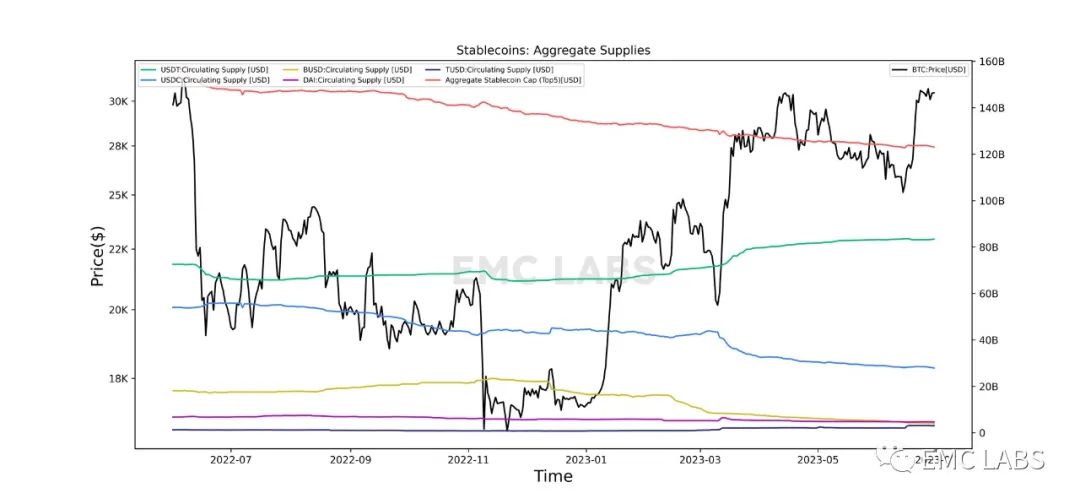
Currently, the supply of stablecoins remains lackluster, with only a $1 billion increase at the beginning of this rebound, but when the price reached $30,000, the total supply returned to the level seen on June 14.
Industry Dynamics
Opening up the compliant market, especially the pathway to old money, remains BTC's strongest narrative.
The adjustment in this round of the market began with the SEC's lawsuits against Binance and Coinbase and the determination of securities for POS public chain tokens like Cardano, Polygon, and Solana. Ultimately, purchasing power from Asia absorbed the selling pressure from America, and after the adjustment, the market fully digested these negative news. The news of BlackRock and other established institutions submitting BTC ETF applications boosted market confidence, leading people to believe that------the SEC cannot deny the cryptocurrency asset market.
Another market reaction to the SEC's crackdown is that POW mining coins have gained attention from market liquidity. LTC, BCH, and other assets that have no securities concerns and are included in asset packages created for old money by Grayscale have attracted attention from on-site funds, experiencing significant short-term gains.
Another trend worth noting is that DEFI blue-chip projects, such as COMP and AAVE, seem to show signs of starting up. These projects illuminated the starting point of the last bull market in the summer of 2020. After a significant decline, the concentration of chips has increased, and the teams are actively planning new businesses. DEFI is the underlying narrative of the cryptocurrency asset market and deserves continuous attention.
Conclusion
Profit-taking and the SEC's actions against the cryptocurrency asset market have jointly created a two-month adjustment. The sellers mainly came from weak hands and traders in the Americas. A 36% adjustment is very sufficient, with hundreds of thousands of BTC changing hands.
EMC Labs successfully predicted the market's bottom rebound in June, and we noticed that the scale of strong hands' holdings is continuously expanding, with their holding intentions still strengthening.
Here, we maintain the judgment that the market will "replicate" the 2016 trend, and the market will continue to oscillate to allow weak hands to hand over more chips, while in the medium term, it will continue to rise amidst the ambiguity of fear and hope, welcoming the arrival of the bull market.


