Analysis: From the perspective of the halving period, why is the bull market expected to start as early as next year?
Original Title: Bitcoin Halving 85% Complete, with Supply Held by Long-Term Holders Close to ATH
Author: Jakub Dziadkowiec, BeinCrypto
Compiled by: Felix, PANews
According to the latest data, 85% of the time has passed since the halving in May 2020 until the next halving. Meanwhile, the supply held by long-term holders (LTH) is close to an all-time high (ATH). In previous cycles, this has been a signal near the macro bottom, followed by the early stages of a new cycle.
LTH Holdings Near All-Time Highs

Historically, the amount of Bitcoin held by long-term holders has been an indicator of the health of the crypto market. This indicator has shown a negative correlation with Bitcoin's long-term price trends.
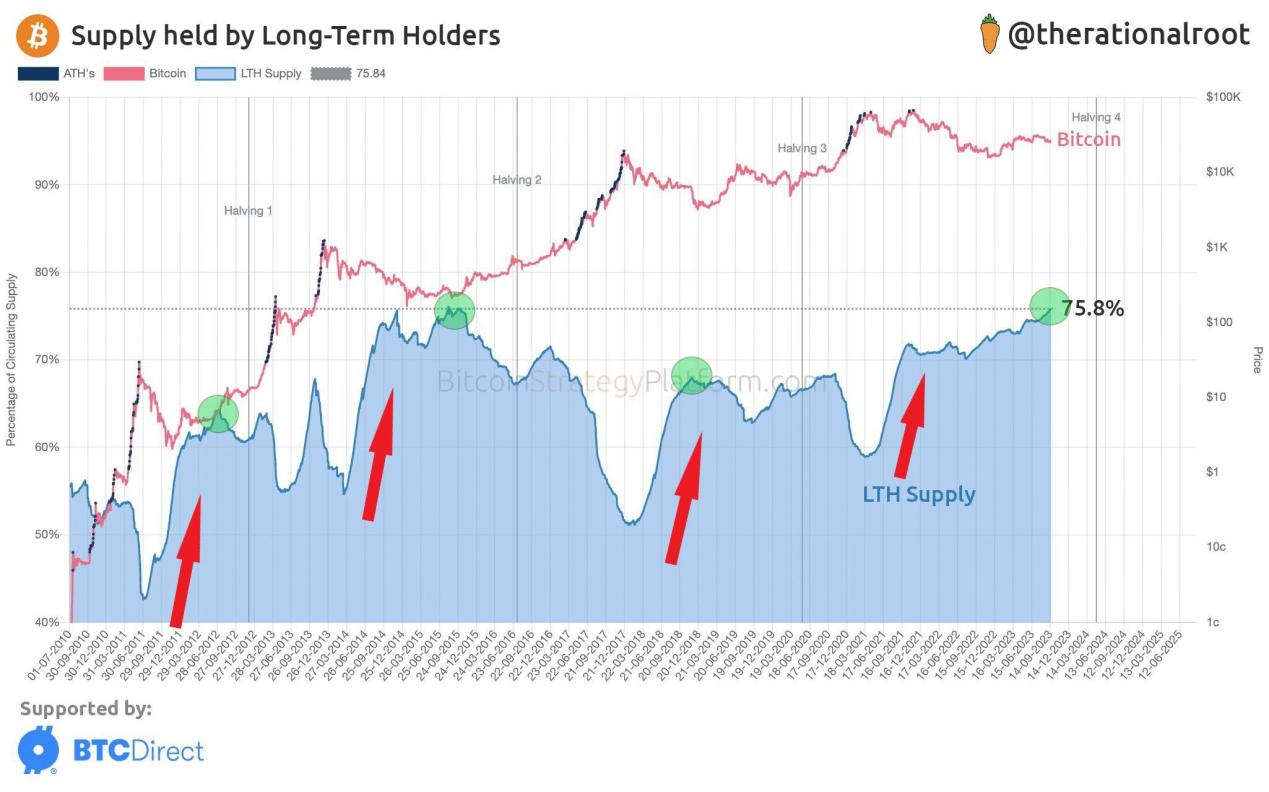
Long-term holders keep their assets intact (HODL) when the market hits bottom. Moreover, the increase in holdings by long-term holders occurs during bear markets (red arrows). This indicates that large investors are reluctant to sell when Bitcoin's price plummets. They hold onto their tokens because they believe the crypto market will rebound in the future, making their investments profitable.
In contrast, during the collapse of a bull market, the situation is quite the opposite. The surge in Bitcoin's price leads long-term holders to become increasingly willing to sell assets to secure profits. Historically, in every bull market, the Bitcoin holdings of long-term holders decline during this period. Of course, these tokens are subsequently transferred to short-term holders (STH), who enter the market later with the desire for quick profits.
Crypto analyst @therationalroot published a chart showing the amount of Bitcoin held by long-term holders on the X platform. He also overlaid the halving events on his chart (above). In his chart, the first thing to note is that currently, the amount of Bitcoin held by long-term holders is close to 76% of the circulating supply, near its ATH. The ATH record was set at the end of 2015 when Bitcoin's price ended its accumulation phase before the second halving.
It can then be seen that this indicator peaks a few months before each Bitcoin halving (green circles). After this local peak, the amount of Bitcoin held by long-term holders gradually declines and consolidates until a few months after the next halving. A sharp decline in this indicator occurs about six months after the halving, when the cryptocurrency enters a full bull market.
85% of Time Has Passed Since the Last Halving
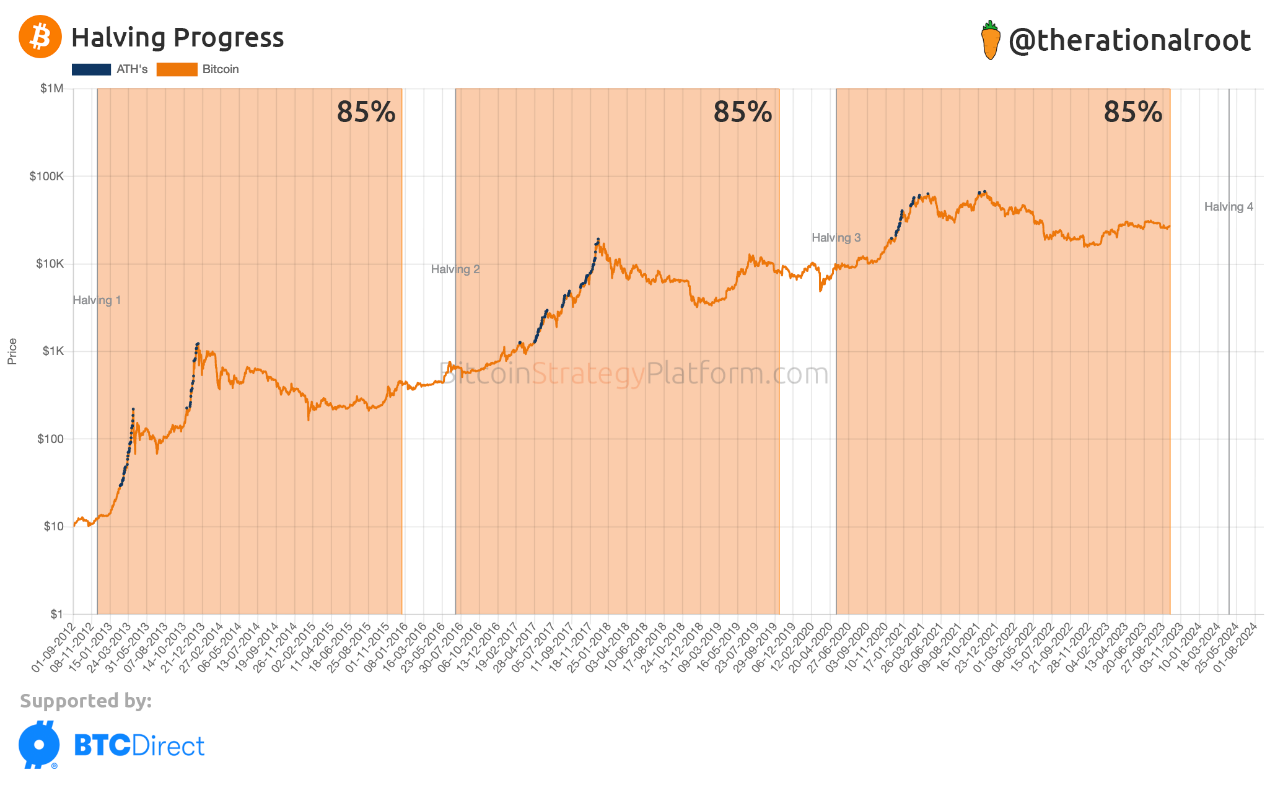
The aforementioned analyst also released another chart showing the progress of the Bitcoin halving percentage (below). This chart compares the time periods between historical halvings in the first three cycles.
According to @therationalroot, Bitcoin halving is currently 85% complete. During the remaining 15% of the time, Bitcoin's price has generally been in a sideways trend. In comparison to the bull markets of 2016 and 2020, Bitcoin's price has also been largely sideways.
The difference is that before these two cycles, Bitcoin experienced a sideways trend with an upward inclination. On the other hand, in the last cycle, the black swan caused by COVID-19 provided investors with an additional opportunity to buy the dip before the planned halving.

If history repeats itself, then in the long term, the crypto market may face about a year of sideways trend. The Bitcoin halving scheduled for mid-April 2024 may not immediately affect Bitcoin's price. Its impact may only become apparent in the last quarter of 2024 and throughout 2025.
This prediction aligns with the trends observed in the long-term holders' holdings chart. This indicator is currently approaching ATH. It will take about another year to reverse the trend. When long-term holders begin to sell after the Bitcoin halving, it will be one of the first signals that the cryptocurrency bull market is starting.


