The New Cycle Paradigm of the Cryptocurrency Market: The Rise of Institutional Liquidity and the Macro Clock

 Overall, the operation of the cryptocurrency market is undergoing a historic shift from "internal drivers" to "external drivers." In the new cycle paradigm, understanding global liquidity and institutional behavior will become key to understanding the cryptocurrency market.
Author: Proton Capital Research Team
Abstract
This report reviews and analyzes the structural changes occurring in the current cryptocurrency market cycle, proposing that the traditional reliance on "halving --- supply shock --- retail resonance" four-year cycle is diminishing, while Bitcoin's price rhythm is being reshaped by institutional liquidity, the global macro funding environment, and risk budget frameworks. In this cycle, price, volatility, capital rotation, and cross-asset linkage all exhibit "externalization" characteristics, with Bitcoin gradually evolving from an independent crypto-native cyclical asset to a high Beta layer within the global risk asset system. Institutional liquidity has become the dominant force, with global and U.S. liquidity indicators forming a new cyclical "clock," while the reconstruction of the risk-reward structure signifies that crypto assets are entering a more systematic, modelable, and configurable stage. These changes collectively point to a new cyclical paradigm: the volatility of the crypto market will increasingly reflect macro funding and institutional behavior, rather than internal on-chain narratives.
The Collapse of the Traditional Four-Year Cycle
The cryptocurrency market rally we have experienced over the past three years has shown distinct "atypical characteristics." From price volatility patterns and sector performance to correlations with major asset classes, multidimensional signals indicate that the logic of the traditional BTC four-year cycle is disintegrating. BTC is gradually evolving from a "self-reinforcing cyclical asset" to a high-volatility risk asset dominated by macro and institutional funds.
Dulling and Shifting of Price and Volatility Patterns
By reviewing past market cycles with halving dates as the starting point, it can be observed that in traditional cycles, bull markets typically peak about 50 to 85 weeks after halving, during which the price slope continues to rise, accompanied by an accelerated expansion of market sentiment (FOMO phase). Although each rally has seen diminishing marginal returns as BTC's market cap increases, a recognizable structural rise has still formed.
However, this cycle has clearly deviated from this pattern: since halving, the price has shown a generally oscillating upward trend rather than a unilateral acceleration; from sentiment indicators (Fear & Greed Index), market sentiment has remained in the neutral to mildly greedy range, without the typical phase of collective frenzy. Comparing the price increase from the bear market bottom to the pre-halving period with previous cycles reveals that this cycle's increase is actually higher, indicating that the main upward momentum was prematurely exhausted before halving. The launch of ETFs and institutional accumulation have become key drivers, causing the old mechanism of "halving --- supply contraction --- price surge" to gradually lose effectiveness. This also confirms that halving is no longer the core variable driving prices, but merely background noise in the price cycle.


Figure 1. BTC Price Performance Before and After Halving
From a volatility perspective, this "cycle dulling" is even more apparent. Taking the weekly annualized volatility as an example, this cycle has significantly contracted compared to previous ones—both the peak volatility is lower, and there has been no traditional rhythm of "volatility rise → peak explosion" after halving. Previous cycles typically reached peak volatility around 80 weeks post-halving, while this cycle has seen volatility continuously decline since halving. The reason lies in the stability of institutional holdings and the buffering effect of ETF channels, which have reduced BTC price elasticity, with market volatility gradually being replaced by "liquidity management." From this perspective, this cycle resembles a liquidity compounding upward phase rather than a typical price re-inflation rally.

Figure 2. BTC Volatility Trends After Halving in Various Cycles
Altcoin Performance Below Expectations: Capital Diversion and Narrative Distraction
In the traditional four-year cycle, BTC reaching new highs after halving often coincides with capital flowing into the altcoin market, triggering a comprehensive market climax akin to "Alt Season." Historically, this phase typically marks an extreme expansion of risk appetite in the latter stages of a bull market. However, in this cycle, this classic chain reaction has not occurred—BTC has already broken through historical highs early, but the expected "sector resonance" has not materialized, with altcoins performing significantly below historical levels. The chart below shows that since the end of 2021, the market cap share of altcoins has continuously declined, and even during BTC's new high phase, there has been no historical typical "Altcoin Dominance rebound," further validating the trend of market capital concentration and narrative dispersion.
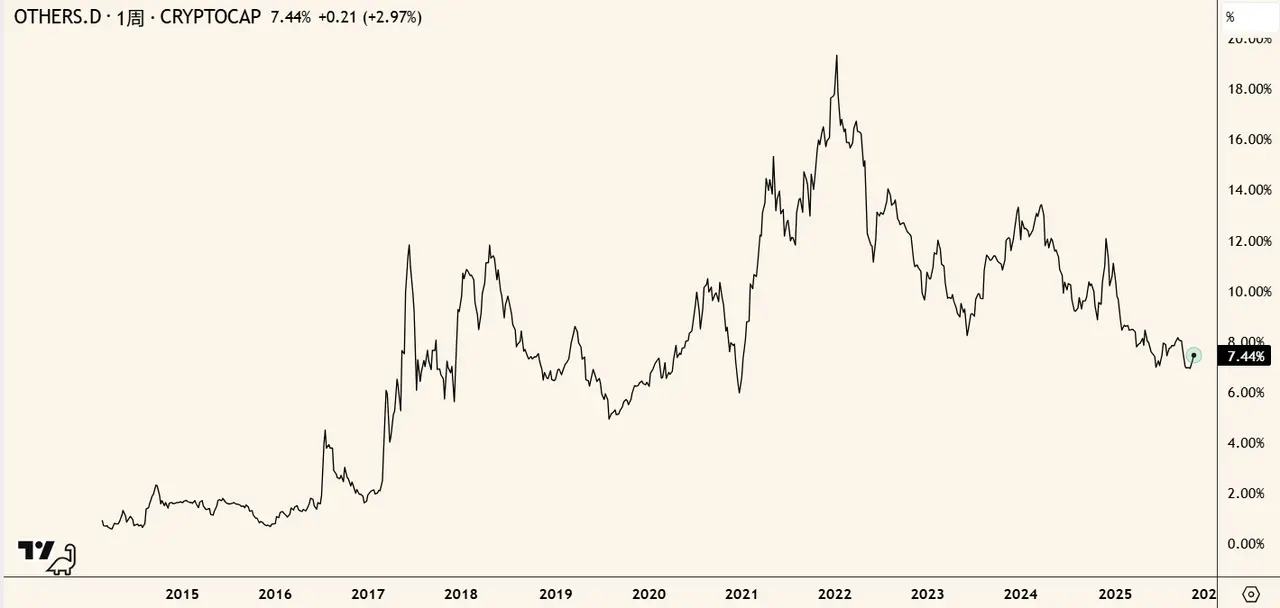
Figure 3. Altcoin Market Cap Share Excluding the Top 10 Tokens
Structural changes on the supply side are one of the main reasons. According to CoinGecko data, by 2025, the number of tradable altcoins in the market has increased from about 10,000 in 2021 to over 19,000, nearly doubling in four years. The surge in project numbers has significantly diluted market liquidity, making it difficult for marginal funds to concentrate on a single asset or sector, thus failing to create the past amplification effect of "a few quality projects leading to market resonance." The intensified internal competition in the altcoin market has also made capital more short-term and thematic.
The funding structure on the demand side has also undergone fundamental changes. Part of the retail liquidity has been absorbed by high-frequency speculative projects such as on-chain memes and pump.fun, which feature high turnover rates, short cycles, and strong social attributes, further weakening the Beta performance of traditional altcoin sectors. Meanwhile, the allocation logic of newly added institutional funds is markedly different from previous cycles—ETF inflows and asset management products are primarily concentrated in leading assets like BTC and ETH, with little allocation to mid- and long-tail tokens. As a result, the incremental market funds have formed a bipolar structure between the "ETF layer" and the "on-chain fragment layer," with mid-tier altcoins becoming a liquidity vacuum.
The Disappearance of Macro Coupling and Independence
In this cycle, Bitcoin's independence is systematically disappearing, with its price rhythm shifting from an internal supply-demand cycle to a model driven by external macro forces and institutional capital structures. Crypto assets no longer rely on on-chain native narratives to determine trends but are increasingly embedded in the global risk asset system, becoming a high-volatility factor in multi-asset portfolios, and thus their price paths exhibit characteristics synchronized with traditional risk assets.
One direct manifestation of this change is the structural increase in correlation between Bitcoin and tech stocks. Taking the rolling correlation coefficient between BTC and the Nasdaq index as an example, in past cycles, the correlation typically exhibited "event-driven short-term resonance": it would rise briefly during interest rate hike expectations, liquidity shocks, or major policy events, but quickly fall back after the event, returning to an independent operational track. In contrast, since 2022, the correlation between the two has not only significantly increased but has also shown sustained platforming, escaping the past event-driven volatility and shifting towards highly stable trend synchronization. This characteristic indicates that Bitcoin's pricing mechanism has shifted from independent asset supply-demand fluctuations to sharing deeper risk factors with tech stocks—such as expansions or contractions in risk budgets, adjustments in growth expectations, and changes in the tightness of global liquidity structures.
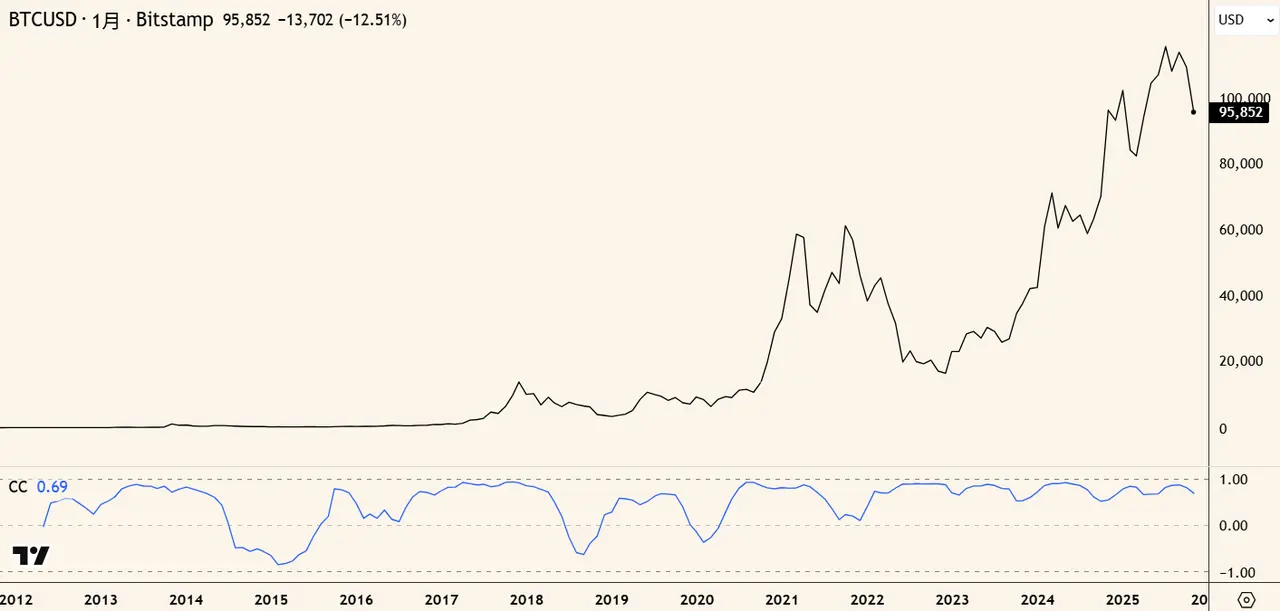
Figure 4. BTC and NASDAQ Correlation
More importantly, this "stabilization of coupling" is not merely a simple price resonance but stems from the change in the functional positioning of crypto assets in the institutional era. With the increasing participation of ETFs, market makers, quantitative funds, and traditional asset management institutions, Bitcoin's position in asset allocation has been restructured: it is no longer a non-mainstream "alternative asset," but has been incorporated into the risk management framework of institutional portfolios. Within this framework, Bitcoin's behavior is more akin to high Beta tech assets; it is no longer most sensitive to on-chain internal variables but is more sensitive to changes in risk budgets across assets. In other words, what drives BTC is no longer the halving schedule but the exposure to risk factors within multi-asset portfolios.
This long-term strengthening of macro coupling is the fundamental reason for the failure of the traditional four-year cycle. Bitcoin's pricing mechanism is no longer centered on on-chain supply-demand, halving rhythms, or retail participation, but is re-embedded in the global risk asset system, shaped by liquidity, institutional allocation, and cross-market risk factors. In this externalized cyclical framework, the classic chain of "internal driving --- emotional diffusion --- comprehensive resonance --- deep liquidation" is difficult to reproduce, and crypto assets are entering a new cyclical structure that is more macro and systematic.
Three Pillars of the New Cyclical Paradigm: From "Internal Cycle" to "External Cycle"
The Dominance of Institutional Liquidity
The most significant difference between this cycle and previous ones is that the marginal pricing power of Bitcoin has shifted from on-chain native participants to institutional capital. The maturity of ETFs, CME, cross-market arbitrage, and market-making systems has led to a structural shift in Bitcoin's liquidity sources, price discovery paths, and trading rhythms. Traditional cycles were dominated by miners, retail investors, and on-chain funds, while the main drivers of the current cycle come from ETF subscriptions, institutional futures positions, and macro risk budgets, thus shifting Bitcoin from "internally narrative-driven" to "externally liquidity-driven."
First, the launch of spot Bitcoin ETFs has changed the structure of incremental capital in the market. As shown in the chart below, since the approval of ETFs and large-scale inflows, Bitcoin's price has almost synchronized with the net subscription rhythm of ETFs. In the past, Bitcoin's price inertia stemmed more from on-chain narratives and speculative capital flows, but in this cycle, the mid-term price trend shows a significant correlation with ETF net inflows. Especially during the sustained net subscription phase of ETFs, BTC prices exhibit a stable upward slope, while during net redemptions or slowed inflows, BTC prices enter high-level oscillations. The ETF subscription mechanism has effectively become Bitcoin's "passive buying engine," with a large amount of traditional capital allocated through ETFs, shifting the price from "emotion-driven" to "flow-driven." This structural change marks the first time Bitcoin's incremental demand has been incorporated into the global asset allocation system, rather than relying on internal speculative cycles.
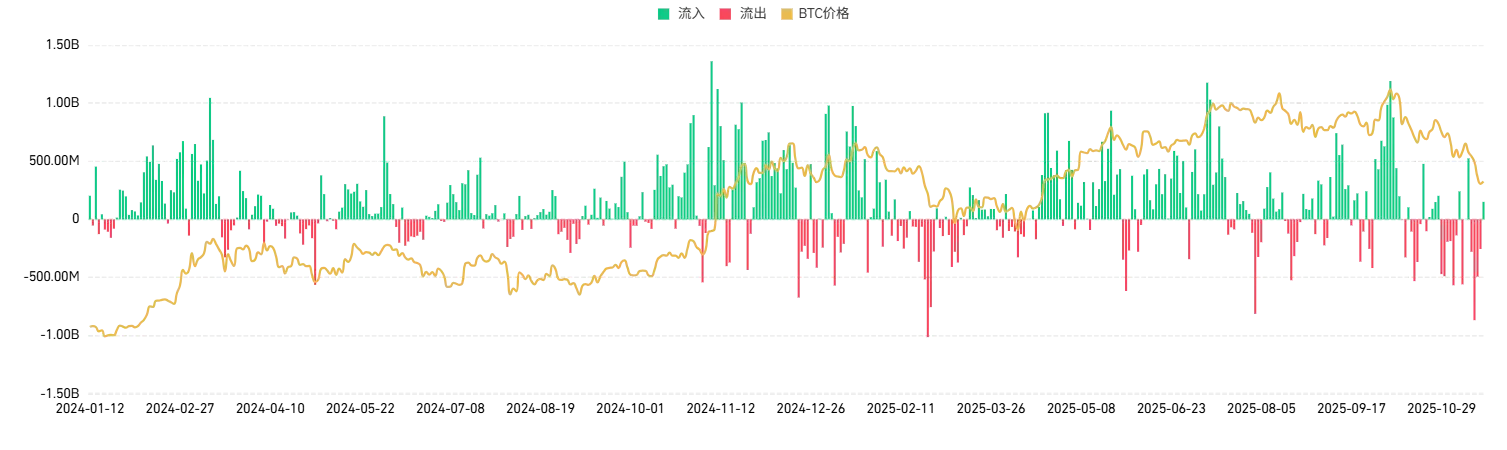
Figure 5. ETF Net Flow and BTC Price (from Coinglass)
Second, the institutionally dominated derivatives market has become a new center for price discovery. The open interest in Bitcoin futures on CME has continued to rise in this cycle, reaching historical highs at multiple stages. Correspondingly, there is a significant overlap between price peaks and open interest peaks, indicating that institutional activities in the futures market—such as building positions, hedging, and arbitrage—are dominating Bitcoin's short- to mid-term trends. In past cycles, price discovery mostly occurred on crypto-native exchanges, while in this cycle, CME's liquidity depth, institutional trading proportion, and open interest have all significantly increased, indicating that Bitcoin is integrating into a more mature derivatives market system. CME's open interest currently ranks first among all exchanges, in stark contrast to Binance's open interest, which is less than 60% of its level at the bottom of the 2022 bear market. As market-making institutions, quantitative funds, and asset management companies continue to expand their exposure on CME, Bitcoin's price volatility also increasingly exhibits characteristics constrained by "risk control systems": directional trends are more driven by institutional risk budget expansions, while volatility declines are triggered by hedging demands and risk parity mechanisms.

Figure 6. CME BTC Futures Open Interest (from Coinglass)
ETF flows and CME positions together constitute Bitcoin's new "institutional liquidity core." The former represents passive allocation incremental buying, while the latter reflects active trading and risk management behaviors. The combination of both forms Bitcoin's "funding support zone." In this structure, the main driving forces of the market have shifted from on-chain narratives and retail sentiment to the scale of funds, costs, macro cycles, and cross-asset arbitrage logic. In other words, Bitcoin's price curve has begun to exhibit characteristics of "traditional assetization": the formation of trends relies on sustained capital flows, while the peaks and troughs of the market are jointly determined by the expansion and contraction of risk budgets. The entry of institutional funds has enhanced market depth, reduced volatility, and further weakened the dominance of crypto-native events on prices.
The dominance of institutional liquidity has also reshaped Bitcoin's cyclical rhythm. Prices no longer revolve around halving or on-chain activity but evolve alongside ETF allocation rhythms, changes in derivatives positions, quarterly rebalancing, and macro liquidity. Bitcoin has thus transitioned from a past "self-circulating system" to an "external liquidity system," with its trends determined by the scale of funds and risk budgets rather than the strength of on-chain narratives.
The Macro Liquidity Cycle as the New "Clock"
As institutional funds become the marginal pricing force in the crypto market, Bitcoin's price rhythm has gradually shifted from internal narratives and supply-demand structures to being dominated by macro-level liquidity changes. In this cycle, the synchronization between Bitcoin and global as well as U.S. liquidity indicators has significantly increased; whether in trend direction or key inflection points, BTC's major movements are more akin to a "global liquidity high Beta." In this structure, the traditional four-year time frame driven by block heights has been left behind, replaced by a broader macro liquidity cycle.
From the perspective of bank reserve levels, the synchronization between Bitcoin prices and reserve levels has become increasingly evident over the past few years. As shown in the chart below, the fluctuations in U.S. bank reserves align closely with Bitcoin's trend. Reserves, as the core variable that "most directly reflects liquidity conditions" in the U.S. financial system, indicate that their expansion corresponds to increased fund availability, heightened risk budgets, and a warming demand for high Beta assets across asset markets. During phases of reserve increases, Bitcoin almost invariably enters a trend of upward movement; conversely, when reserves contract, BTC typically enters a phase of oscillation or correction. In other words, BTC's cyclical fluctuations are transitioning from a "supply shock --- demand diffusion" model to a "liquidity increase --- risk budget expansion" model.
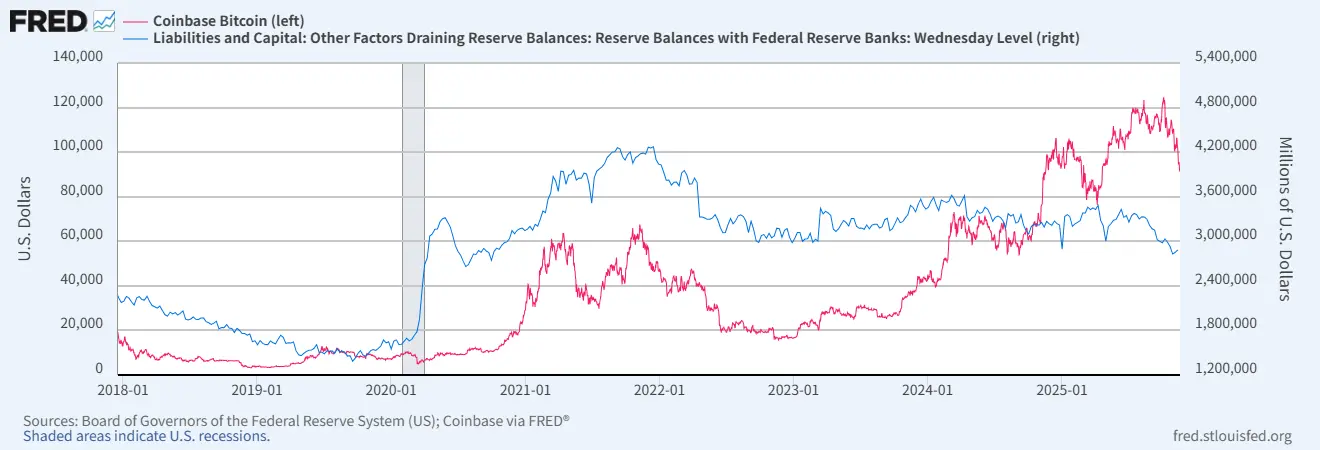
Figure 7. U.S. Commercial Bank Reserves and BTC Price (from FRED)
This consistency is not coincidental; it reflects the essential changes in crypto assets in the institutional era: Bitcoin is becoming a macro amplifier of liquidity and risk appetite. The allocation behaviors of institutional investors, the ETF subscription mechanisms, and the hedging activities in the derivatives market all heavily depend on funding costs, financing conditions, and the tightness of liquidity within the system. When reserve levels rise and the financing environment improves, Bitcoin's buying power not only strengthens but also becomes more sustainable; conversely, when reserves decline or liquidity tightens, institutional risk budget contractions often first manifest in a slowdown of BTC's trend.
The relationship between M2 and Bitcoin prices also exhibits a similar synchronized structure. Although M2 is a relatively slower and more macro liquidity indicator, its directional changes still maintain a clear resonance with BTC's medium- to long-term trends. During M2 expansion phases, Bitcoin often enters an upward range; conversely, during phases of M2 growth slowdown or negative growth, Bitcoin is more likely to experience trend interruptions or deeper corrections. Changes in M2 reflect a broader monetary environment and the liquidity cycle between the household sector, the real economy, and the financial system. When this cycle operates smoothly and credit expansion has more leeway, the medium- to long-term performance of risk assets often outperforms periods of liquidity tightening, while Bitcoin, as a high-elasticity asset, amplifies this process.

Figure 8. M2 Year-on-Year Growth and BTC Price (from FRED)
Overall, the strengthening synchronization between Bitcoin and macro liquidity indicators such as reserves and M2 indicates that BTC has migrated from an "internal clock" to an "external clock." The rhythm of Bitcoin's price is no longer determined by halving, miner supply, or on-chain accumulation, but is shaped by the availability of funds in the financial system, fiscal conditions, and the broader monetary environment. The time structure of the crypto market has thus been redefined: the once four-year supply rhythm has been replaced by a higher frequency, more macro, and more externalized liquidity cycle, and the market's operational mode has shifted from being driven by native narratives to being dominated by capital market rhythms dictated by cross-asset capital flows.
Reconstruction of the Risk-Reward Structure
After institutional liquidity and macro funding rhythms have jointly reshaped the market, the risk-reward structure of Bitcoin and the entire crypto asset system has fundamentally changed. Past crypto cycles exhibited typical "high volatility --- high risk --- high elasticity" characteristics, with returns largely relying on narrative-driven expansions of risk appetite and on-chain speculative structures. When internal narratives decline or liquidity tightens, returns rapidly collapse, resulting in a steep unimodal structure.
However, in this cycle, this unimodal return structure has been reshaped. With ETFs, CME, and other institutional channels becoming dominant forces, risk is more clearly incorporated into asset allocation and risk budget systems. Bitcoin's returns no longer depend on isolated narrative resonances but arise more from the interplay of macro environments, institutional position structures, interest differentials, and arbitrage systems. Meanwhile, as market depth increases and volatility decreases, risk itself is also being repriced: assets that were once considered "absolutely high risk" are beginning to exhibit characteristics of "manageable risk."
The direct result of this reconstruction is that the sources of returns in the crypto market are no longer discontinuous and explosive but are closer to the "cyclical, sustainable, leveraged risk premium" characteristic of traditional risk assets. Institutional capital prefers stable and predictable return structures rather than extreme peaks of speculative returns—this has also led the crypto market to gradually evolve from an "event-driven speculative market" to an "asset class driven by liquidity and risk budgets." This not only changes the risk characteristics of Bitcoin itself but also reshapes the return distribution of the entire crypto ecosystem, making the slope, duration, and peak structure of future cycles significantly different from the past.
Overall, the reconstruction of the risk and reward structure marks the maturity and systematization of the crypto market: returns are determined by more macro factors, and risks can be modeled, hedged, and incorporated into portfolios. Bitcoin is transitioning from an isolated asset to an asset system, and its cyclicality is thus shifting from linear to structured. This lays the foundation for the formation of the next stage of "institutional reflexivity" and provides a new logical framework for future market operations.
Conclusion
Overall, the operational mode of the crypto market is undergoing a historic shift from "internally driven" to "externally driven." Institutional liquidity, global funding cycles, and risk budget frameworks are reshaping Bitcoin's price rhythm, leading to the gradual failure of the traditional four-year cycle and providing new anchors for future cycles. As crypto assets are further integrated into the global asset allocation system, their volatility patterns will increasingly be determined by macro environments and cross-asset liquidity rather than relying on single events or on-chain narratives. In the new cyclical paradigm, understanding global liquidity and institutional behavior will become key to understanding the crypto market.
 Risk warning Risk warning