Gate Weekly Report: Geopolitical and Economic Dual Drivers, Cautious Game Before FOMC and CPI

Summary
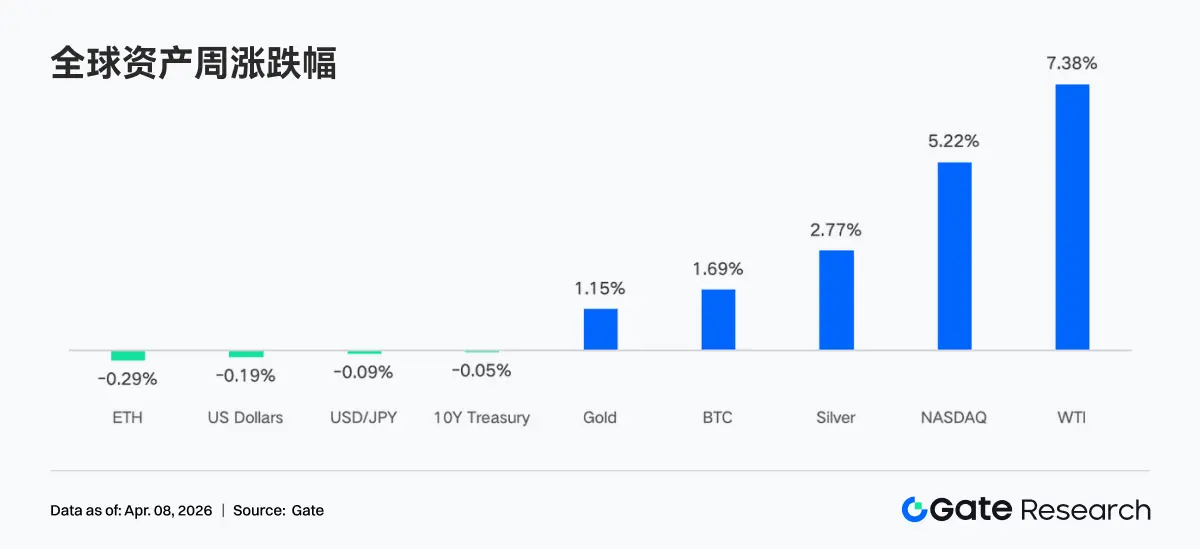
• In the past week, the market was primarily driven by fluctuating expectations of geopolitical conflicts and better-than-expected economic data. The U.S. and Iran repeatedly switched their statements regarding ceasefire and military strikes, leading to significant volatility in oil prices, with WTI rising over 7% weekly; meanwhile, retail sales, ISM, and non-farm data all exceeded expectations, reinforcing economic resilience and driving a substantial rebound in U.S. stocks, while gold and silver continued to reach new highs under the resonance of inflation and safe-haven demand.
• The funding aspect showed low volatility and structural disturbances. BTC ETF saw a slight weekly net inflow of about $22.3 million, a significant improvement from the previous week but still limited in scale; ETH ETF continued to experience net outflows. The end-of-quarter rebalancing combined with holiday factors led to a V-shaped fluctuation where funds flowed in from late March to early April and then quickly flowed out again, reflecting that institutional allocation rhythms are still dominated by macro and structural factors.
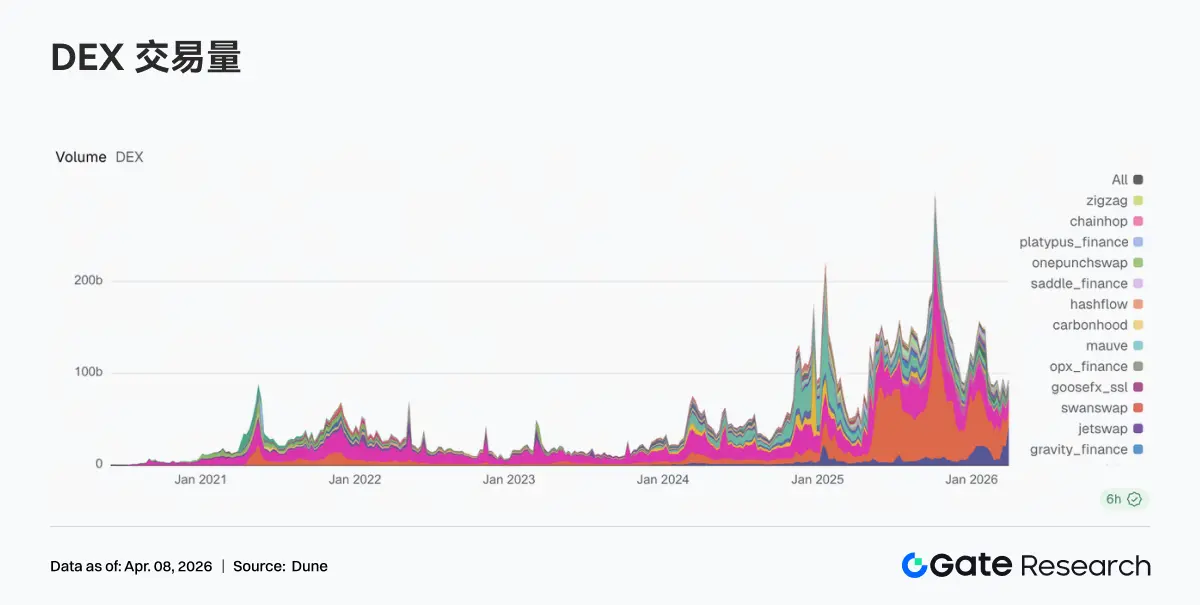
• On-chain and trading structures concentrated on high-volatility assets. Perp DEX and CEX's TradFi trading volume significantly tilted towards crude oil and precious metals, with the energy sector's share significantly increasing, while precious metals remained at high levels; DEX structures underwent a reshuffle, with Meteora's trading volume surging to the top, and liquidity concentrated on a few high-efficiency protocols, leading to internal differentiation within the Solana ecosystem.
• Stablecoin and DeFi structures continued to adjust. The total amount of stablecoins remained high and fluctuated, with USDT basically flat and USDC slightly retreating; more funds flowed towards DeFi-native stablecoins. In terms of liquid staking, ETH side Lido and Rocket Pool rebounded, while Solana LST continued to adjust. Aave's lending scale overall rebounded, with the main market and sub-chains synchronously recovering.
• Protocol revenue structures returned to normal. The issuance side of stablecoins remained the main source of income; trading platform revenues fell compared to the previous week, while wallets and front-end entrances, such as Pump, Phantom, and Jupiter, saw rising revenues, with funds flowing back to the traffic distribution segment.
• The derivatives market entered a neutral range. BTC funding rates rose back to around 0, with open interest peaking before falling back to about $21 billion; options open interest concentrated on the short end, with increased Put demand, Skew maintaining a negative range, and DVOL remaining high and fluctuating, indicating that the market is primarily pricing in short-term uncertainties.
1. Market Focus Interpretation
On Monday, reports indicated that the U.S. and Iran were discussing a possible 45-day ceasefire agreement and terms for reopening the Strait of Hormuz, which boosted market sentiment significantly. Dow Jones futures soared by 1,100 points overnight, and Brent crude prices briefly fell below $100 for the first time since early March. However, on Wednesday evening, Trump stated that strikes against Iran would continue for "two to three weeks," abruptly reversing market optimism. Oil prices surged above $113, with WTI crude rising over 7% weekly.
Recent economic data shows that the economy continues to demonstrate resilience. Last week's retail sales and ISM manufacturing index both exceeded expectations, indicating that consumer spending remains healthy and manufacturing is still expanding. The non-farm payrolls released on Friday showed growth and an improvement in the unemployment rate, with the monthly non-farm payrolls reaching the highest level since December 2024, alleviating market concerns about an economic recession and driving a significant rise in the Nasdaq index, marking its best weekly performance since November 2025. Amid rising inflation expectations and safe-haven sentiment, gold and silver continued to reach new highs, while cautious statements from Fed officials kept the dollar index fluctuating at high levels. The U.S. Treasury market oscillated between strong employment and inflation concerns, leading to slight fluctuations in 10-year Treasury futures prices.
Cryptocurrencies participated in risk appetite trading, with Bitcoin approaching the $70,000 resistance level that had been in place for several weeks, and Ethereum breaking through the $2,100 mark. After four months of outflows, Bitcoin spot ETF recorded a net inflow of $1.32 billion in March.
2. Liquidity Analysis
2.1 Net Inflows of Crypto ETFs
Last week, BTC ETF's intraday performance showed a "V-shaped bump," with a net inflow of $117.6 million on March 31, the strongest single day at the end of the month, while the first trading day of April saw a sudden reversal to -$173.7 million. BTC ETF had a weekly net inflow of about $22.3 million, while Ethereum ETF experienced a weekly net outflow of $42.2 million. In comparison, the flow situation of BTC ETF last week showed significant improvement compared to the previous week (-$296 million net outflow), but the absolute amount was still the smallest positive week in recent months, reflecting an overall cautious rather than optimistic sentiment.
Top products by net inflow for BTC ETF:
ARKB (ARK 21Shares) with a weekly net inflow of $34.2 million
IBIT (BlackRock) with a weekly net inflow of $16.4 million
Top products by net inflow for ETH ETF:
ETHB (BlackRock Staked ETH ETF) with a weekly net inflow of $10.7 million
ETH mini with a weekly net inflow of $6.5 million
The largest net outflow came from ETHA (BlackRock) at -$64.0 million, followed by FETH (Fidelity) at -$7.3 million.
March 31 marked the end of Q1, and institutional passive rebalancing concentrated at the end of the quarter. If Bitcoin outperformed stocks and bonds in Q1, the allocation model would automatically reduce overweight positions, explaining why there was a significant outflow on April 1 after two days of inflows at the end of the month—this was a mechanical and expected operation, not a bearish signal. On April 3, approaching the long weekend of Good Friday, the CME futures and ETF subscription and redemption mechanisms were simultaneously suspended, causing institutional buying pressure to disappear. Additionally, economic data cooled interest rate cut expectations, further suppressing risk assets, and ETF flows began to show signs of slowing down in early April.
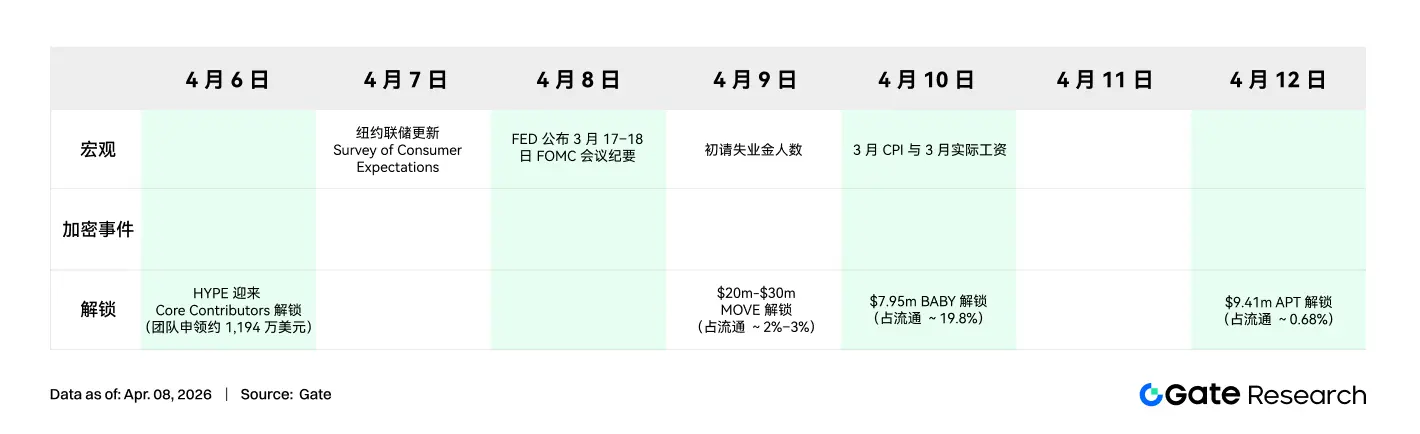
The next key point will be the CPI data on April 9, which will directly impact the market's repricing of the interest rate cut timeline, and ETF flow direction is expected to become clearer.
2.2 TradFi Liquidity
In the past week, the TradFi sector's trading volume in Perp DEX showed a significant structural redistribution. The share of energy products (represented by CL and Brent Oil) significantly increased, becoming a temporary dominant force, primarily driven by rising crude oil prices and geopolitical risk disturbances, attracting trading funds concentrated in short-term volatility. Meanwhile, the share of precious metals (XAU, XAG) remained relatively high but slightly retreated, indicating that safe-haven demand is still present, but marginal trading enthusiasm was diverted to energy. The share of individual stocks (such as NVDA) continued to shrink, showing that during the macro-dominated phase, the trading attractiveness of single equity assets has declined.
On the CEX side, TradFi trading volume showed high-level amplification but was highly concentrated in commodity categories, with precious metals (XAU, XAG) remaining the absolute core source of transactions, maintaining a dominant position over the long term, contributing over 70% of TradFi trading volume on some platforms, becoming a liquidity anchor. Additionally, energy products (crude oil CL, Brent) saw significant volume increase and share rise during the week. Driven by rapid oil price increases and expanded volatility, daily trading volume of crude oil perpetual contracts reached hundreds of millions of dollars, quickly becoming a core trading target, reflecting a preference for "high volatility + macro β."
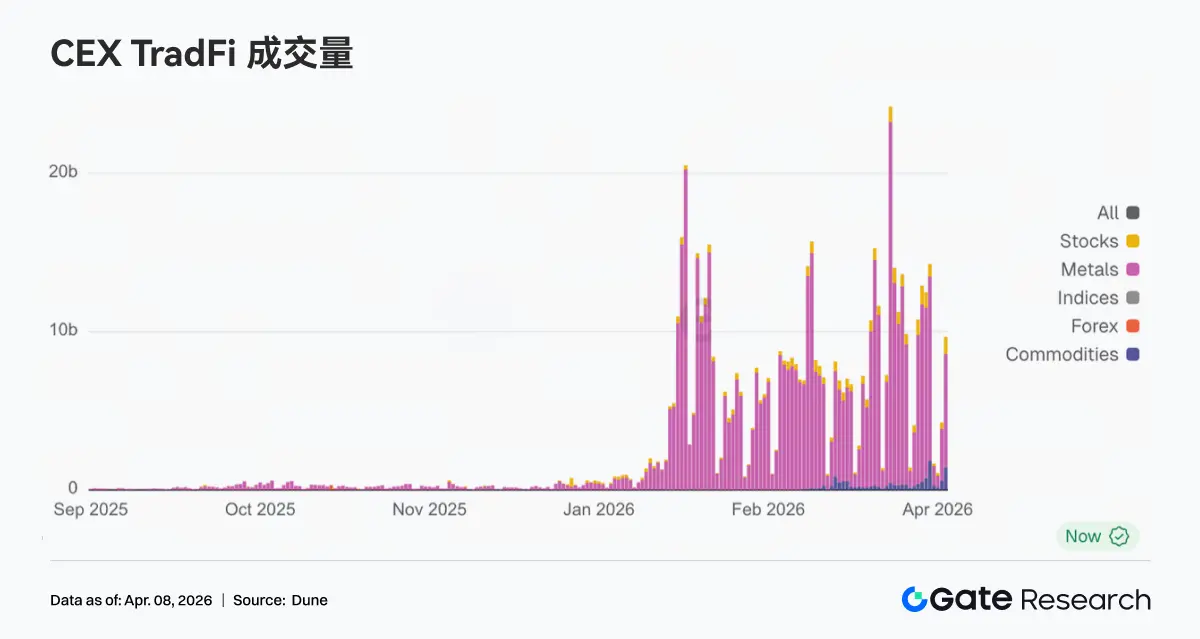
In the past week, the number of TradFi asset categories further expanded, with three mainstream CEXs increasing the total number of TradFi asset categories (counting only TradFi and CFD segments, excluding perpetual contracts) from 678 to 802, a week-on-week growth of 18.3%. Among them, the growth in stocks was the most significant, increasing from 379 to 487, a week-on-week growth of 28.5%; the growth rate of stock indices ranked second, increasing from 69 to 81, a week-on-week growth of 17.4%.
We selected XAUT, which had the highest TradFi trading volume, to analyze its order book depth (Delta). Last week, it showed a typical structure of "price rising → sustained net selling pressure → phase repair," reflecting that funds were primarily realizing profits at high levels.
• Rising phase: Depth turned negative, with sustained selling pressure. From March 31 to April 2, XAUT prices rose rapidly (corresponding to a strengthening of gold), but order depth turned significantly negative, with multiple large negative Deltas appearing. This indicates that during the rise, active sell orders (profit-taking/hedging) continued to press down, and the market was not driven by chasing prices but rather in a distribution phase of "price rises, chips exit." This aligns with gold's characteristic as a safe-haven asset—rises are often accompanied by realization demand.
• High and volatile phase: Negative Delta peaks, liquidity passively absorbed. Around April 1, extreme negative Delta (close to -2M) appeared, corresponding to the price phase high point, indicating that large funds concentrated on profit-taking or short hedging, while buyers were more passive absorbers (liquidity providers). Subsequently, Delta gradually turned positive and showed multiple positive pulses, indicating that some funds began to absorb on dips, but bullish confidence had not fully recovered.
3. On-Chain Data Insights
3.1 Solana Trading Volume Concentrated on Meteora, DEX Rankings Significantly Restructured
Last week, the DEX structure underwent a clear reshuffle. Meteora's trading volume surged to $43.215 billion, significantly amplifying from the previous week's $20.631 billion and jumping to the top position. From a mechanism perspective, Meteora's DLMM model benefits more from a high-volatility environment and active market-making demand. PancakeSwap fell from $25.185 billion to $15.640 billion, and Uniswap slightly decreased to $13.100 billion, with mainstream spot platforms overall failing to follow this round of traffic expansion on the Solana side. There was also internal differentiation within the Solana ecosystem. Raydium fell from $2.390 billion to $1.384 billion, while Whirlpool rose to $1.968 billion, and Pumpswap increased from $0.343 billion to $0.471 billion. Overall, last week, the market pricing clearly favored trading elasticity and liquidity capture capabilities, with liquidity concentrating on a few high-efficiency entrances.
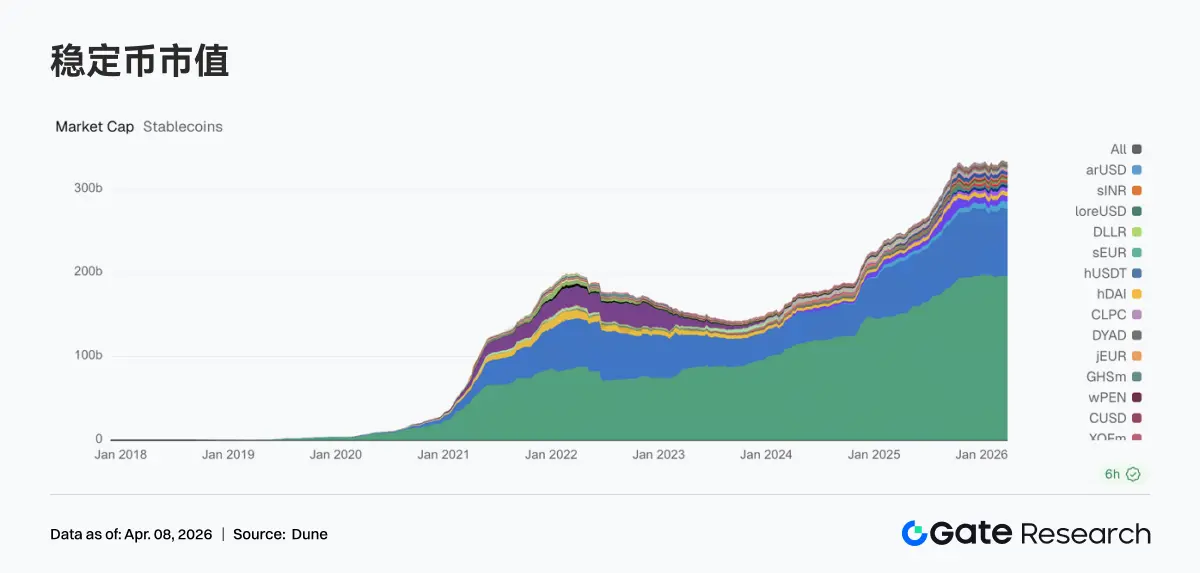
3.2 Total Stablecoins Remain High, Incremental Growth Concentrated on DeFi Core Assets
Last week, stablecoins overall maintained high-level fluctuations. USDT was basically flat; USDC slightly retreated, continuing the trend of slowing growth since mid-March. Funds tilted towards DeFi-native stablecoins. USDS increased from $8.405 billion to $8.695 billion, and DAI rose from $5.213 billion to $5.461 billion, becoming the main incremental absorbers last week. PYUSD slightly rebounded to $3.170 billion, while USDT0 fell to $2.485 billion, reflecting the diversion of funds between payment chains and cross-chain mapped assets. Overall, last week, on-chain funds were more inclined to allocate stablecoin assets that can directly participate in DeFi.
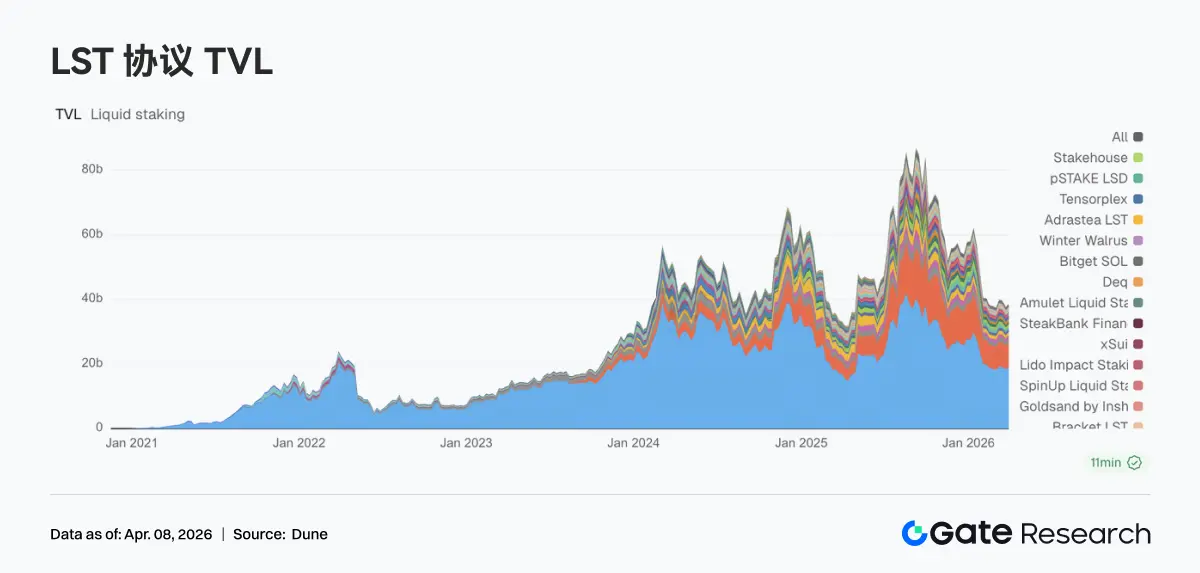
3.3 Liquid Staking Returns to ETH Main Line, SOL Ecosystem Still in Internal Adjustment Phase
The liquid staking sector showed differentiation last week. The ETH side overall repaired, with Lido rising from $18.329 billion to $19.193 billion, and Rocket Pool rebounding to $1.192 billion, basically recovering from last week's pullback. In contrast, the Solana LST sector continued to adjust. Jito fell from $1.021 billion to $0.906 billion, and both Jupiter Staked SOL and Kinetiq saw declines. At the product level, Lido continues to promote institutional yield tools (such as EarnETH, EarnUSD), and the yield system is gradually improving; however, the Solana side is still in the structural selection phase.
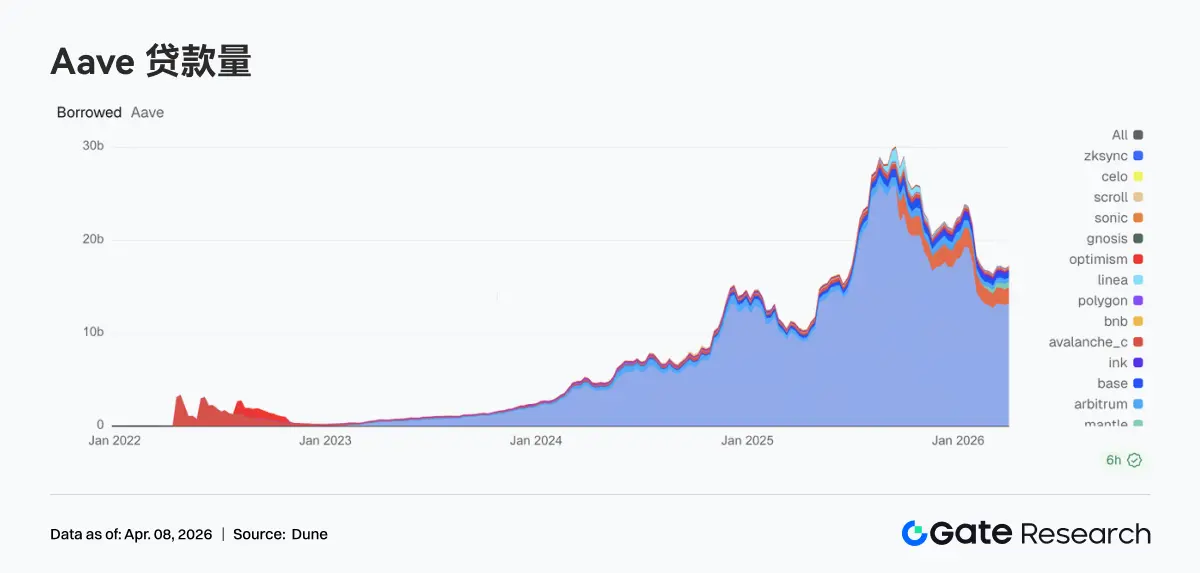
3.4 Aave Lending Scale Rebounds, Core Market and Sub-Chains Synchronously Recover
Last week, Aave's lending scale ended its pullback and began to grow again. The Ethereum main market rose from $13.050 billion to $13.266 billion, becoming the main support for the overall rebound. The sub-chain market improved synchronously: Mantle rose to $0.591 billion, Base rebounded to $0.496 billion, and Arbitrum slightly increased to $0.498 billion. Plasma maintained a high level at $1.664 billion, with the ability to attract funds in high-yield or new scenario markets still solid. Combined with Aave's current promotion of the V4 Hub-and-Spoke architecture, this round of rebound is similar to the reconstruction of leveraged positions, laying the groundwork for future cross-market liquidity integration.
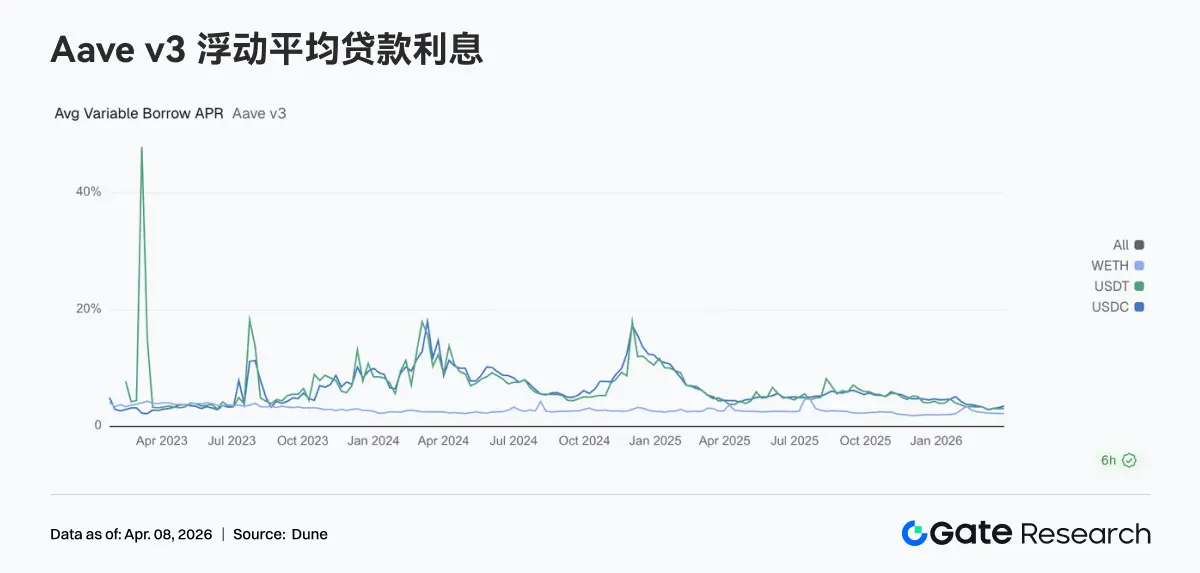
3.5 Interest Rate Differentiation Intensifies, USDC Financing Costs Significantly Rise
Last week, the interest rates of Aave's three core assets further differentiated. The USDC borrowing APR rose from 3.23% to 3.51%, showing the most significant increase; USDT slightly rose to 3.10%; WETH remained around 2.23%. While lending scales rebounded, funds mainly flowed to stablecoin loans, and ETH loan demand did not increase synchronously. Market behavior leaned more towards fund scheduling, arbitrage, and position rolling, rather than directional leverage expansion. Under the expectation of the V4 architecture, the differentiation of funding prices between different assets may further widen. The rise in USDC rates last week has already reflected this trend in advance.
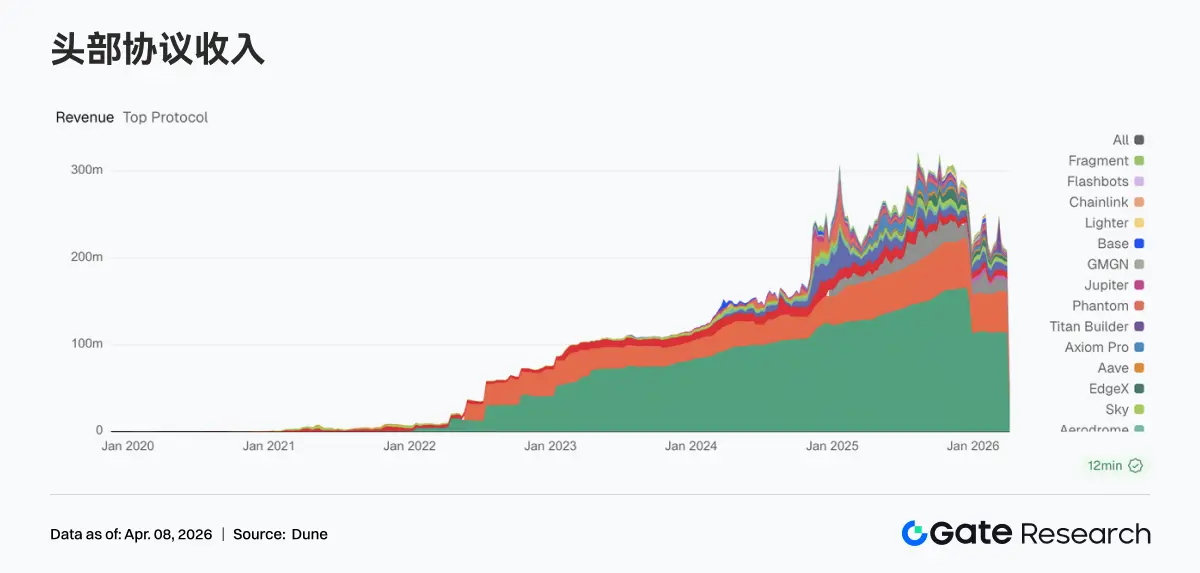
3.6 Protocol Revenue Returns to Fundamentals, Stablecoins and Traffic Entrances Form Dual Support
Last week, the protocol revenue structure returned to normal. Tether's revenue was $114.29 million, and Circle's was $46.6868 million, with the stablecoin issuance side still being the most stable source of income. Trading platform revenues fell, with Hyperliquid and EdgeX both declining compared to the previous week, and trading elasticity converging temporarily. Meanwhile, traffic entrances began to rise: revenues from Pump, Phantom, and Jupiter all increased, with funds flowing back to wallets and front-end distribution segments. Overall, the revenue structure showed a pattern of stablecoins as the foundation, enhanced traffic entrances, and differentiation among trading platforms.
4. Derivatives Tracking
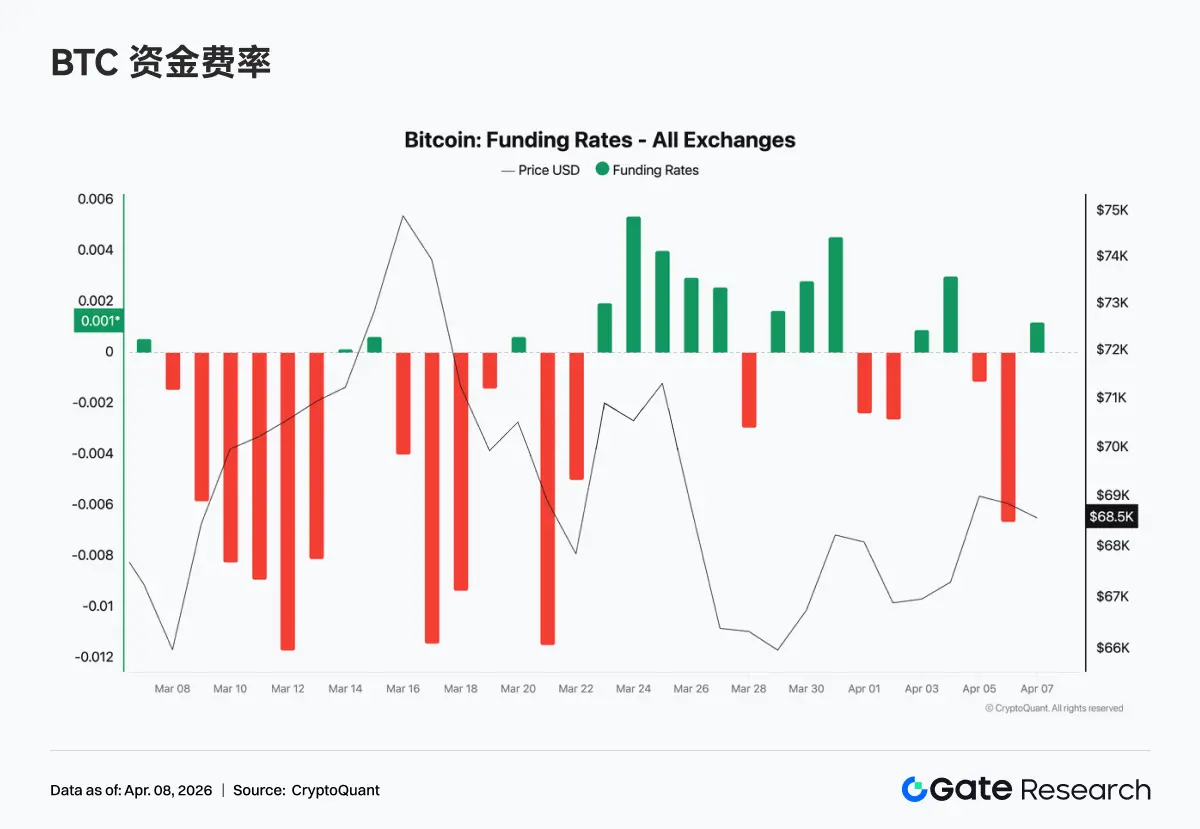
4.1 BTC Funding Rates Stabilize from Negative, Market Enters Neutral Game Phase
Last week, BTC funding rates continued their recovery trend, gradually rising from previously sustained negative values to around 0, briefly turning positive mid-week, indicating a transition from a bear-dominated defensive state to a balance between bulls and bears. At the beginning of the week, there was still a slight negative rate, with weak risk appetite; subsequently, as prices stabilized and rebounded, rates quickly converged, driven by short covering and arbitrage funds. By the weekend, rates basically maintained narrow fluctuations around 0, with leverage not significantly amplified, and funding behavior primarily focused on short-cycle rolling and strategic trading. Overall, the changes in funding rates last week represent a rebalancing after emotional clearing, with the market entering a neutral range and not forming a clear trend signal.
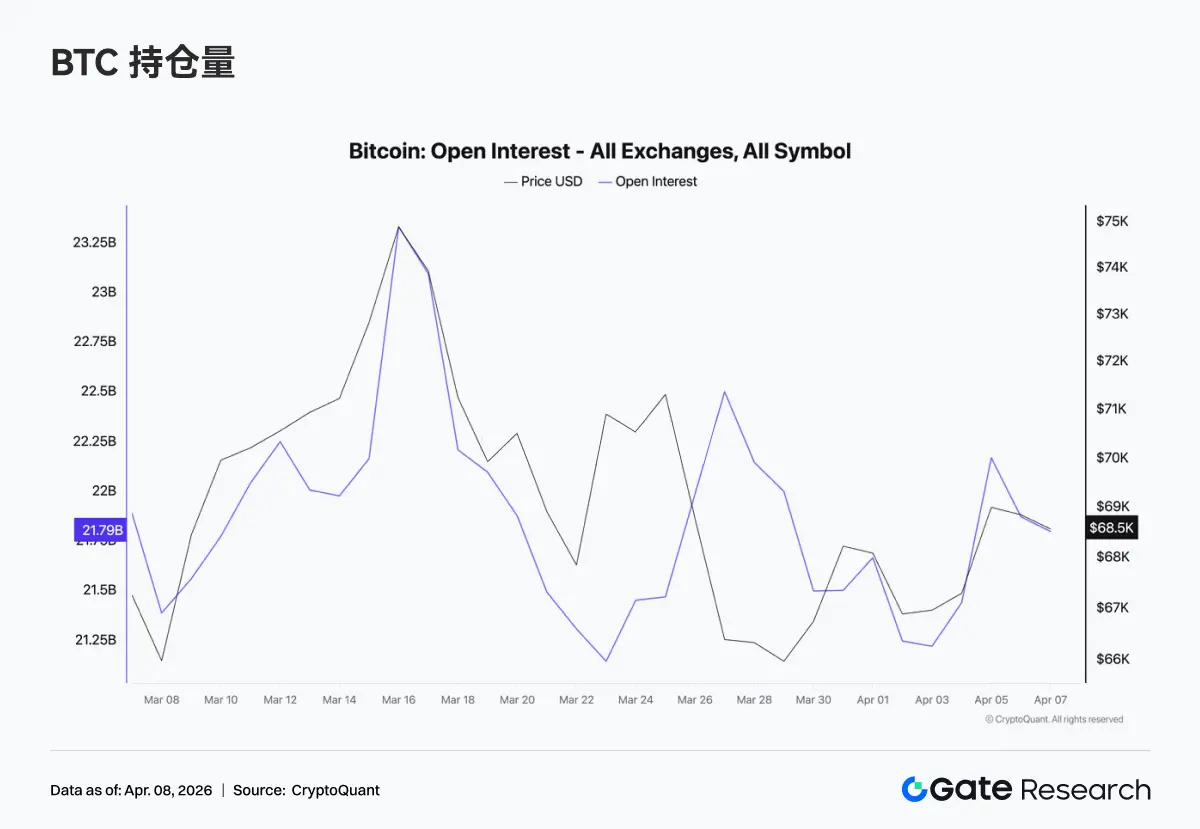
4.2 BTC Open Interest Peaks and Falls, Leverage Momentum Weakens
Last week, BTC open interest initially surged before falling back, peaking around $23 billion mid-week, then quickly dropping back to around $21 billion, with only slight recovery afterward and no new highs. During the rising phase, open interest expanded, with new leverage entering; however, during the high-level pullback, open interest significantly decreased, indicating that some positions were actively closed or passively liquidated. Currently, open interest has not maintained at high levels, and leverage expansion has halted, consistent with the return of funding rates to neutral, indicating that the market is close to a position switch within a range.
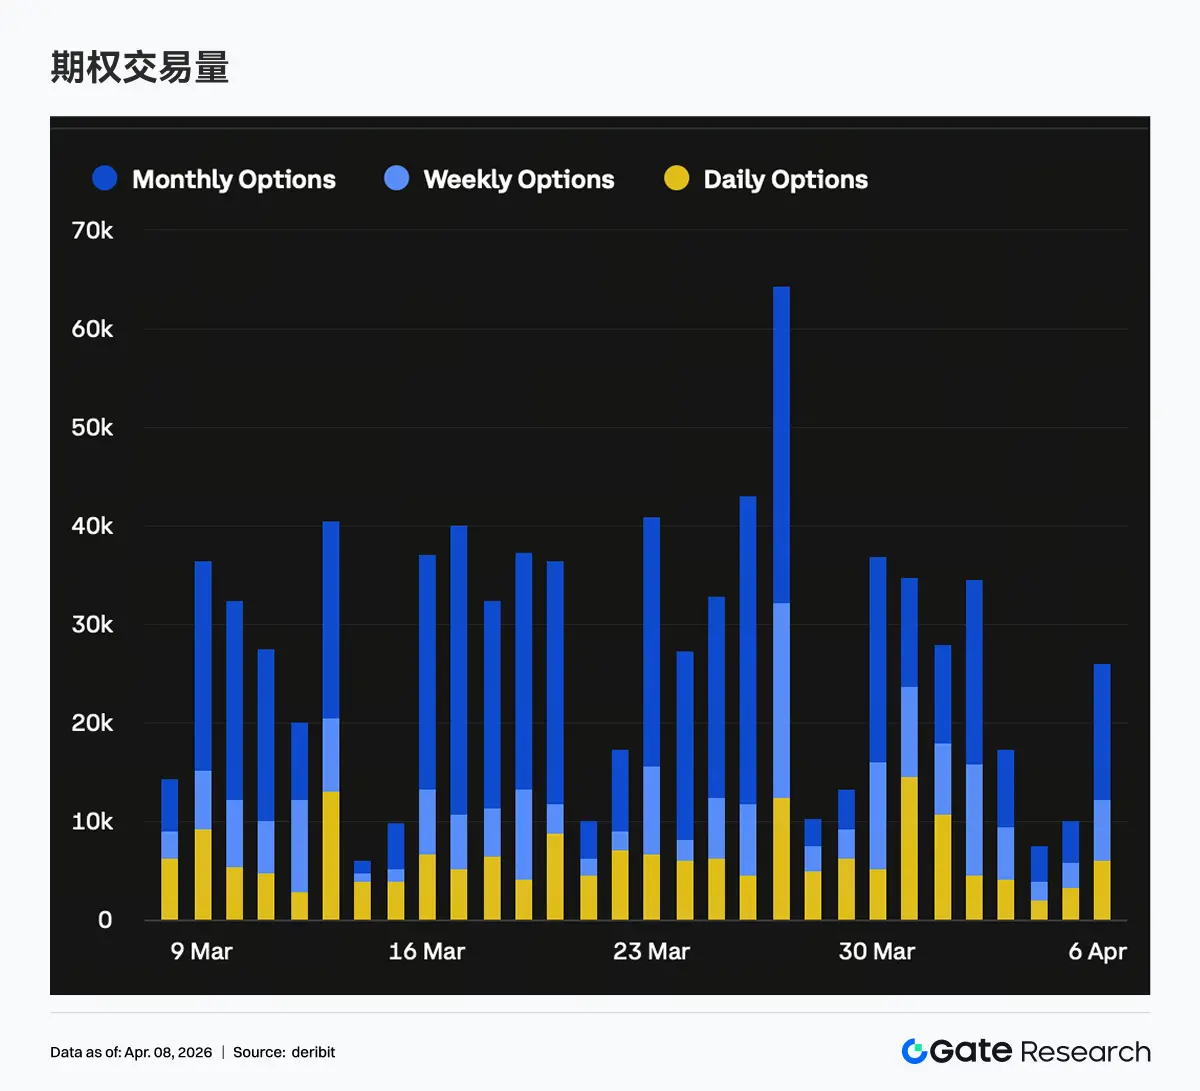
4.3 Options Open Interest Remains Unchanged, Positions Concentrate on Short End
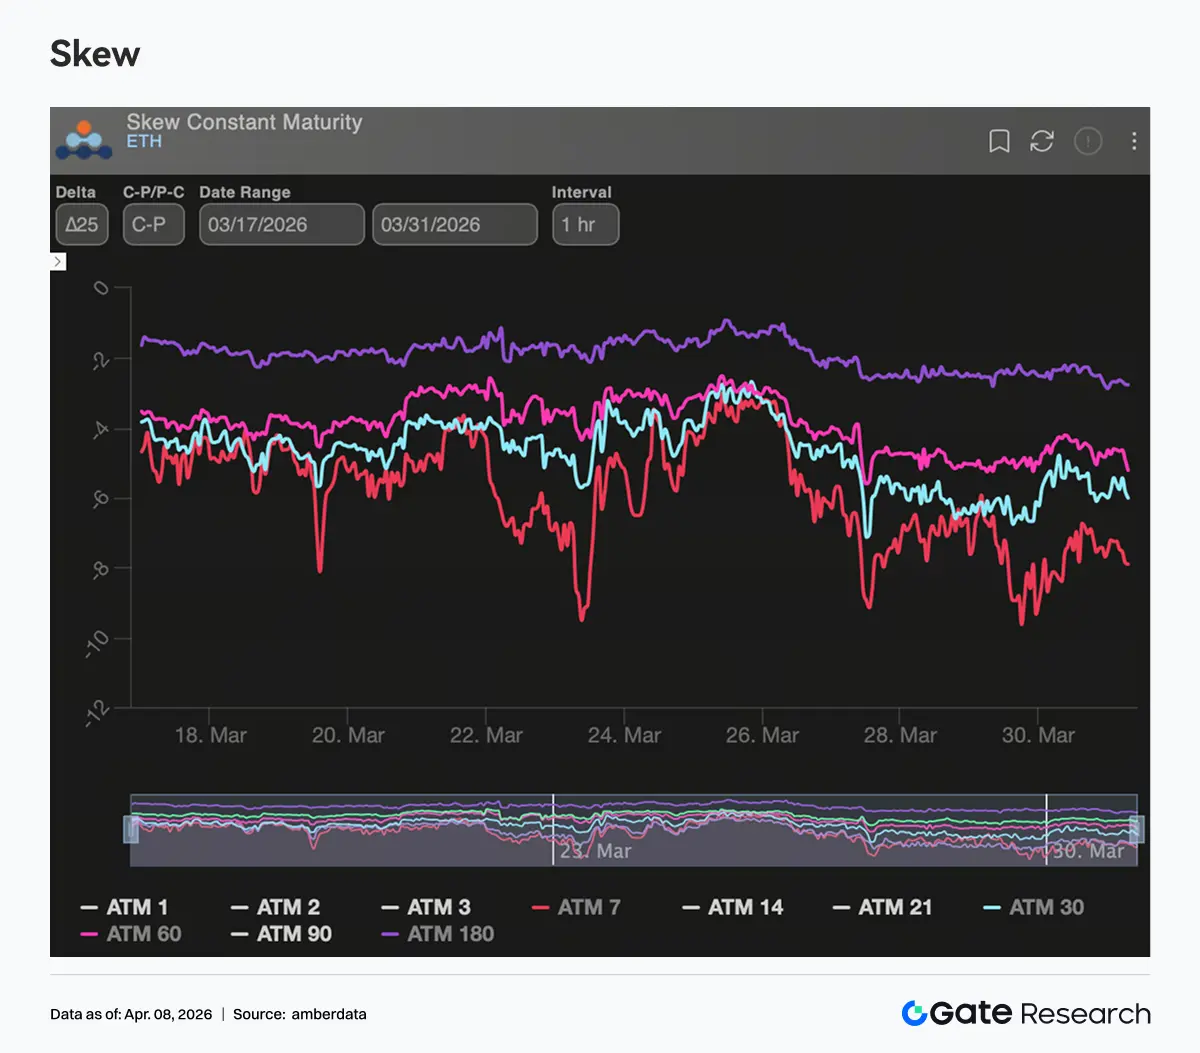
Last week, the options scale did not show significant growth, with limited new funds entering, and the market remained primarily focused on adjusting existing positions. The share of short-end positions increased, while medium to long-term (especially monthly and further out) positions decreased, consistent with the significant reduction in monthly options trading volume, as institutions actively reduced mid-term directional exposure at this stage. From a directional distribution perspective, the share of Put positions significantly increased on the short end, with Skew remaining in negative territory, indicating that protective demand is mainly concentrated in the near-term expiration structure. This structure typically corresponds to a combination of short-term defense and medium to long-term observation.
4.4 Skew Weakens Again on Short End, Protective Demand Rises Again
Last week, Skew remained in negative territory (around -6 to -10), with a structure showing a downward trend on the short end and stability on the long end. From the end of March to early April, the 7D/30D Skew quickly fell to around -12, and although there was some recovery afterward, it has not returned above neutral, currently maintaining in the -7 to -8 range, with short-term protective demand clearly rising. Meanwhile, changes in long-end Skew were minimal, remaining overall stable, indicating that the market has not formed a consistent pessimistic expectation for medium to long-term direction. Currently, the market is primarily pricing in short-term uncertainties, with short-end Puts continuously being bought, corresponding to risk hedging before event-driven or expiration nodes.
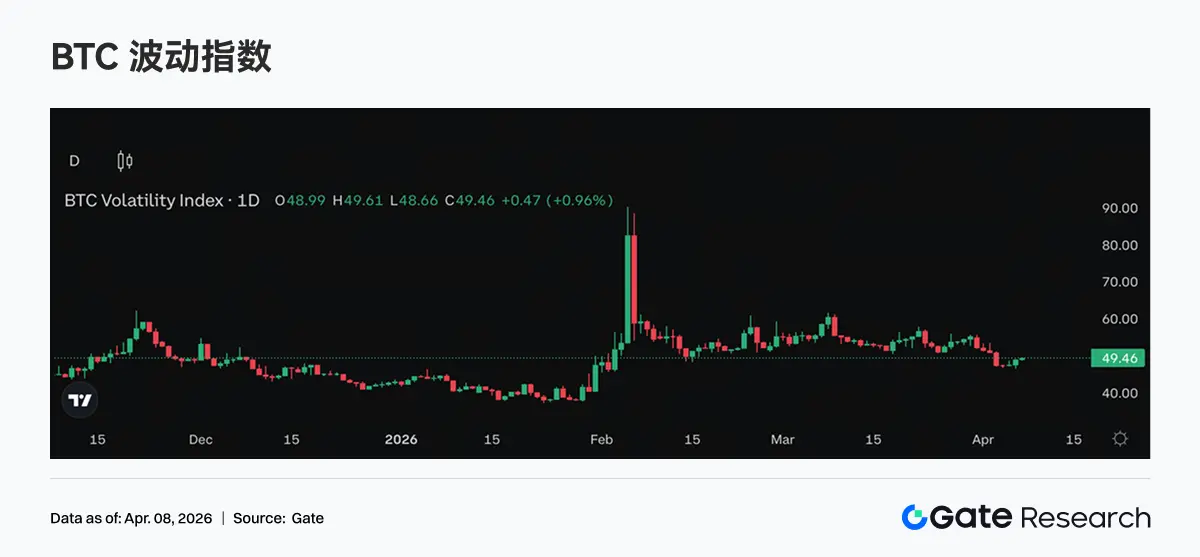
4.5 DVOL Fluctuates at High Levels, Volatility Expectations Not Further Elevated
Last week, DVOL maintained relative high-level fluctuations without showing significant upward breakthroughs. BTC DVOL stabilized around 40%-50%, while ETH DVOL remained around 60%-70%, continuing the platform consolidation state after the previous rise. The lack of further upward movement in DVOL indicates that the market's expectations for higher volatility have not been further strengthened, meaning that short-term risk premiums still exist. Combined with Skew and options trading structures, current volatility pricing is more derived from short-end protective demand. Overall, DVOL reflects a maintenance state under high volatility conditions, indicating that the market has accepted the existence of volatility but has not yet bet on further amplification of volatility.
5. This Week's Outlook
6. Gate Institutional Dynamic Update
Market Share and Institutional Proportion Both Increase
• Gate's institutional market share in Q1 for mainstream spot trading pairs continued to grow, becoming the only platform in the industry to achieve growth.
• The proportion of institutional trading volume in leading exchanges significantly increased, with spot and contract proportions growing by 18% and 45% respectively.
Trading and Funding Performance Continues to Improve
• Trading volume in the first week of April saw a significant rebound, with spot and contract phases outperforming the market.
• The scale of funding business expanded, with lending scale continuing to grow, while Gate institutions explored achieving interest margin models, further stimulating funding demand.
Product Breakthroughs and Technical Upgrades
• The CrossEx ecosystem is accelerating its formation, and Q2 will further integrate OTC Loan and asset management, releasing synergistic value.
• Q2 will further focus on large clients and latency issues, establishing a special optimization mechanism.
• Continuous optimization of low-latency performance has been maintained, and future upgrades to the 3.0 architecture will be promoted.
Data Sources:
• Investing, https://investing.com/currencies/xau-usd-historical-data
• Gate, https://www.gate.com/trade/BTC_USDT
• CMC, https://coinmarketcap.com/real-world-assets/?type=all-tokens
• Coinglass, https://www.coinglass.com/pro/depth-delta
• Dune, https://dune.com/gateresearch/gate-institutional-weekly-report
• Bybit, https://www.bybit.com/future-activity/en/tradfi
• Bitget, https://www.bitgettradfi.com/tradfi/XAUUSD
• CryptoQuant, https://cryptoquant.com/asset/btc/chart/derivatives
• Amberdata, https://pro.amberdata.io/options/deribit/btc/current/
Gate Research Institute is a comprehensive blockchain and cryptocurrency research platform that provides readers with in-depth content, including technical analysis, hot insights, market reviews, industry research, trend forecasts, and macroeconomic policy analysis.
Disclaimer
Investing in the cryptocurrency market involves high risks, and users are advised to conduct independent research and fully understand the nature of the assets and products they purchase before making any investment decisions. Gate is not responsible for any losses or damages resulting from such investment decisions.
 Risk warning