Gate Weekly Report: Crude Oil Plummets 14%, Uniswap Trading Returns to the Top

Summary
• In the past week, the market was driven by a ceasefire easing, falling inflation, and stable policies, leading to a sharp drop in oil prices, a decline in the VIX, a rebound in risk appetite, and BTC moving up to the range of $68,000 to $73,000.
• After severe fluctuations in the funding layer, there was a strong recovery, with BTC ETF net inflows of approximately $833 million in a single week, setting a new high for the phase, while ETH ETF also recorded net inflows, with institutional buying regaining dominance.
• The trading structure shifted towards macro high-volatility assets and leading platforms, with funds concentrating on energy commodities like crude oil, and the DEX side returning to high liquidity platforms like Uniswap.
• Stablecoins and DeFi showed structural recovery, with USDC becoming the main increment, as funds prioritized returning to leading staking protocols and main chain lending markets.
• Protocol revenues reflected a return to the infrastructure layer, with trading and clearing protocols strengthening, while the heat of front-end entry and traffic distribution declined.
• The derivatives market showed signs of crowded shorts but with price divergence, as funding rates were negative but prices rose, indicating potential short squeeze momentum; options shifted towards short-end speculation and selling volatility strategies.
1. Market Focus Interpretation
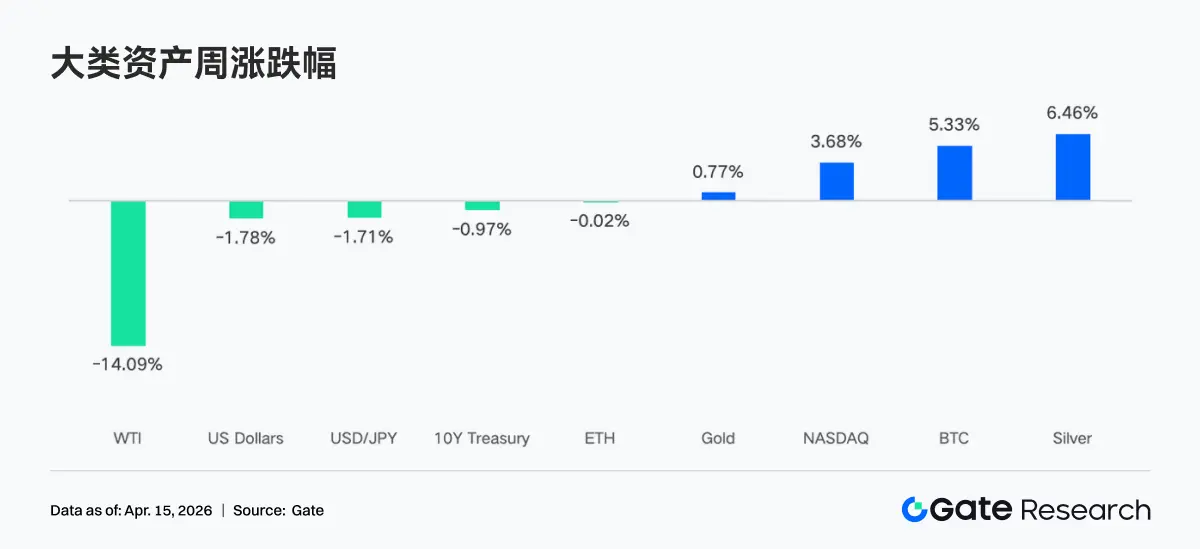
In the past week, a two-week ceasefire agreement between the U.S., Iran, and Israel brought a welcome easing to this conflict that has shaken global markets. Following the announcement of the ceasefire agreement last week, the market experienced a strong rebound, with stock and bond prices rising, while oil prices fell by 14%, and the VIX index plummeted to 19.23, closing below 20 for the first time since early March.
Additionally, global financial markets, especially the cryptocurrency sector, were significantly influenced by macroeconomic data and Fed policy expectations. On April 10, CPI data showed inflationary pressures below expectations, alleviating market concerns about the Fed adopting more aggressive tightening policies, which is generally seen as favorable for risk assets. The minutes from the Federal Open Market Committee (FOMC) meeting were also released last week, with market predictions showing a 98.4% probability of maintaining current interest rates in April. This highly certain expectation of "holding steady" provided a stable policy environment for the market, reducing short-term uncertainty.
Under the dual influence of easing inflationary pressures and stable policy expectations, overall market risk appetite significantly rebounded. Institutional investors remain highly interested in cryptocurrencies, with continued inflows into Bitcoin spot ETFs providing solid bottom support for the market. These macro factors collectively laid the foundation for the performance of Bitcoin and Ethereum over the past week, allowing them to rebound quickly after a brief correction.
In the past two weeks, Bitcoin's price range quietly shifted upward from $63,000 to $70,000, expanding to $68,000 to $73,000, with the $73,000 resistance level still being a key level to watch. If the reopening of the Strait of Hormuz is confirmed, it could serve as a catalyst for breaking through that resistance level. On the downside, Bitcoin has repeatedly found support around $68,000 to $69,000, but each attempt has led to a narrowing of the support level. The cryptocurrency market has reflected expectations of a prolonged conflict, currently trading near range support, indicating that any positive surprises or easing factors have room for upward movement, while further deterioration has been largely digested by the market.
2. Liquidity Analysis
2.1 BTC ETF Sets Largest Positive Weekly Net Inflow in Months
Last week, BTC ETF experienced significant intraday volatility, with a net inflow of $471.4 million on April 6, marking the largest single-day inflow since the end of February. However, in the following two trading days, due to a sharp rise in geopolitical risks, it reversed to net outflows of -$159.1 million and -$93.9 million, respectively. The BTC ETF weekly net inflow was approximately $833.2 million, while the Ethereum ETF had a weekly net inflow of $187.0 million. In comparison, the BTC ETF flow situation last week showed a significant improvement compared to the previous week (approximately $22.3 million net inflow), setting the largest positive week in months, with overall sentiment rapidly switching between risk aversion and bottom-fishing, ultimately favoring the bulls.
Top BTC ETF net inflow products:
IBIT (BlackRock) weekly net inflow of $612.1 million
FBTC (Fidelity) weekly net inflow of $151.7 million
Top ETH ETF net inflow products:
ETHA (BlackRock) weekly net inflow of $168.3 million
ETHB (BlackRock Staked ETH ETF) weekly net inflow of $66.0 million
On April 6, institutional buying built positions against geopolitical uncertainty, driving an unexpected massive inflow. However, following the breakdown of U.S.-Iran negotiations on April 7 and rising risks of the Strait of Hormuz closing, risk aversion quickly spread, leading to two consecutive days of capital outflow—this was a mechanical reduction in response to sudden war risks, rather than a long-term bearish signal. On the evening of April 8, President Trump announced a two-week ceasefire agreement between the U.S. and Iran, causing oil prices to plummet, liquidity concerns to drop sharply, and institutional buying to return with a vengeance. Furthermore, the CPI data released on April 10 showed that although nominal inflation rose to 3.3% due to energy drag, core CPI year-on-year at 2.6% was below expectations, indicating that core inflation remains moderate, further supporting the rebound of risk assets, with ETF flows showing characteristics of "accelerated inflows after bad news is fully digested."
2.2 TradFi Liquidity
In the past week, DEX-side TradFi perpetual trading exhibited significant structural differentiation, with trading focus clearly shifting towards energy assets. WTI crude oil, as a representative, saw a substantial increase in its proportion, becoming the dominant trading variety, reflecting that funds are concentrating on the most macro-volatile assets for directional speculation against the backdrop of heightened geopolitical risks and oil price fluctuations; simultaneously, the proportion of Brent crude oil also rose significantly, further reinforcing the dominance of the energy sector. In contrast, traditional safe-haven assets like gold and silver saw a decline in proportion, indicating a shift of funds from defensive allocations to more elastic trading targets; stock indices like XYZ100 and individual stocks like NVDA maintained moderate proportions, playing more of a supplementary allocation role. Overall, the DEX TradFi trading structure has shifted from a previous "precious metals dominant" to "energy-driven," reflecting a market trading logic that has once again shifted from risk-averse allocations to high-volatility trading around macro variables, consistent with the background of on-chain funds migrating towards high-frequency trading links.
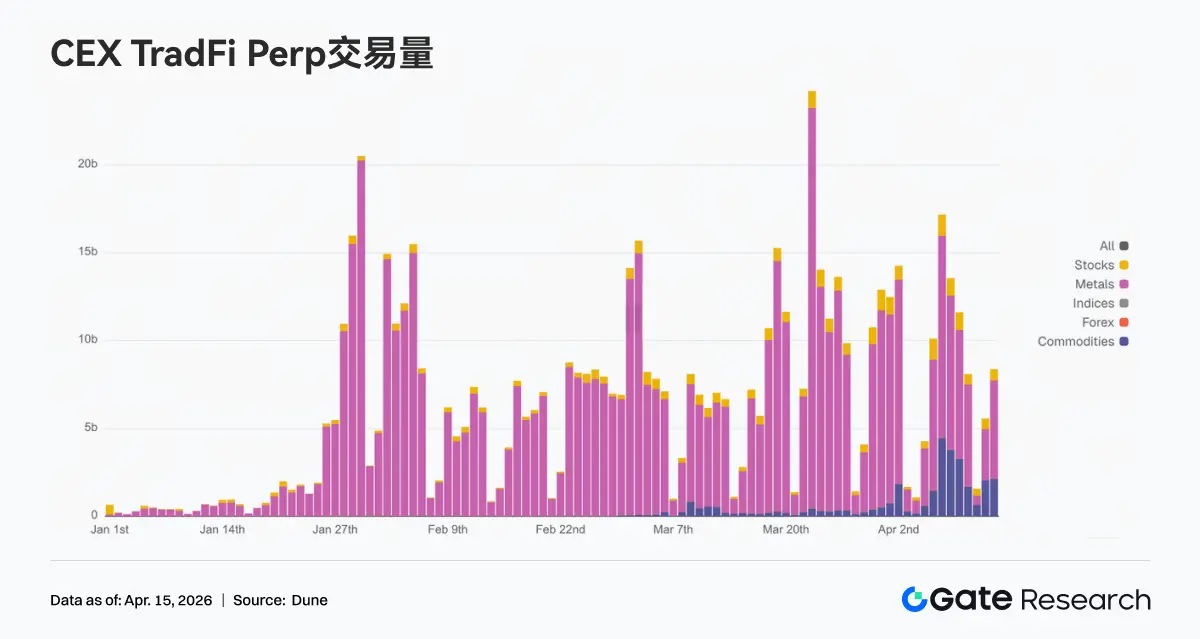
CEX TradFi perpetual contract trading volume remained in a high range and exhibited characteristics of "structural concentration + amplified volatility." Specifically, trading volume continued to be dominated by metal assets, especially gold-related varieties, which continuously attracted funds amid macro uncertainty and fluctuating inflation expectations, becoming the main source of transactions; at the same time, commodity trading, especially energy, also saw a phase of increased volume during the week, reflecting rising market demand for trading crude oil and macro events. In terms of rhythm, trading volume significantly increased mid-week, corresponding to macro data and geopolitical event catalysts, and although there was a subsequent decline, the overall level remained above previous central levels, indicating that fund activity remained high. Structurally, TradFi trading is gradually expanding from being driven by a single safe-haven asset to a multi-asset linkage framework of "gold + crude oil + indices," reflecting a shift of users from allocation-based trading to strategy trading centered around macro volatility.
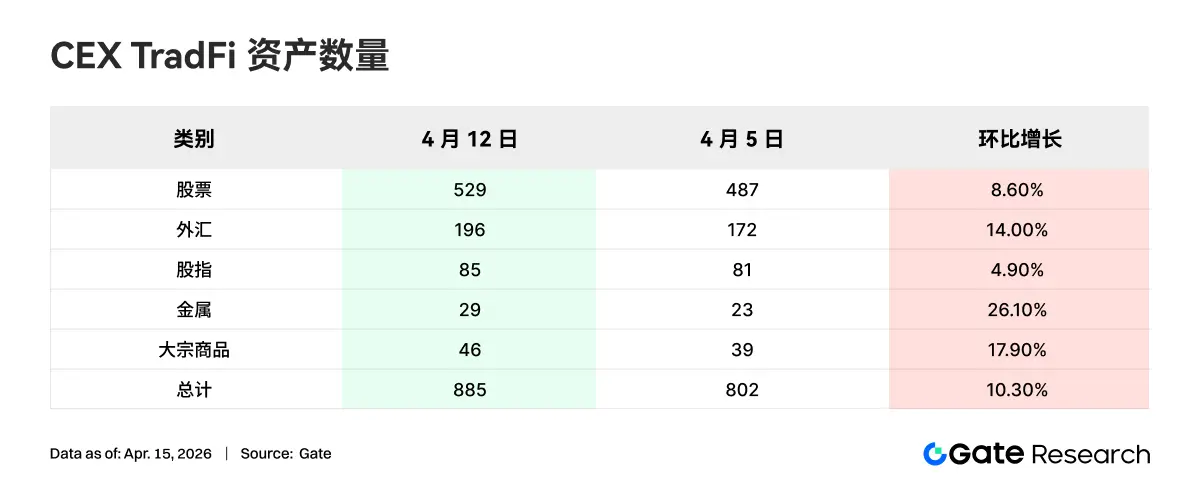
In the past week, the number of asset categories in CEX TradFi further expanded, with the total number of TradFi asset categories (counting only TradFi and CFD segments, excluding perpetual contracts) increasing from 802 to 885, a week-on-week growth of 10.3%. Among them, the growth in metal assets was the most significant, increasing from 23 to 29, a week-on-week growth of 26.1%; bulk commodities ranked second, increasing from 39 to 46, a week-on-week growth of 17.9%.
We selected XAUT, the highest trading volume in TradFi, to analyze its order book depth (Delta). Over the past week, XAUT's order book depth showed characteristics of "weak at first, then strong, with liquidity gradually recovering." Around April 8, XAUT's price rebounded quickly, with positive Delta significantly increasing, and buy-side depth strengthening, indicating that funds began to actively raise prices and provide liquidity above. Subsequently, during the period from April 9 to April 12, although the price maintained high-level fluctuations, the order book shifted back to being dominated by negative Delta, showing that selling pressure still existed above, and there was some divergence in the market at high levels. Notably, over the weekend, positive Delta rose again alongside price strength, indicating that buy-side liquidity regained dominance, and market sentiment improved. Overall, the depth structure of XAUT reflects that amid rising gold prices, funds have gone through a process of withdrawing from defense to repositioning, with liquidity showing marginal improvement in the short term, but there remains some selling pressure at high levels, necessitating attention to the sustainability of subsequent buy-side activity.
3. On-Chain Data Insights
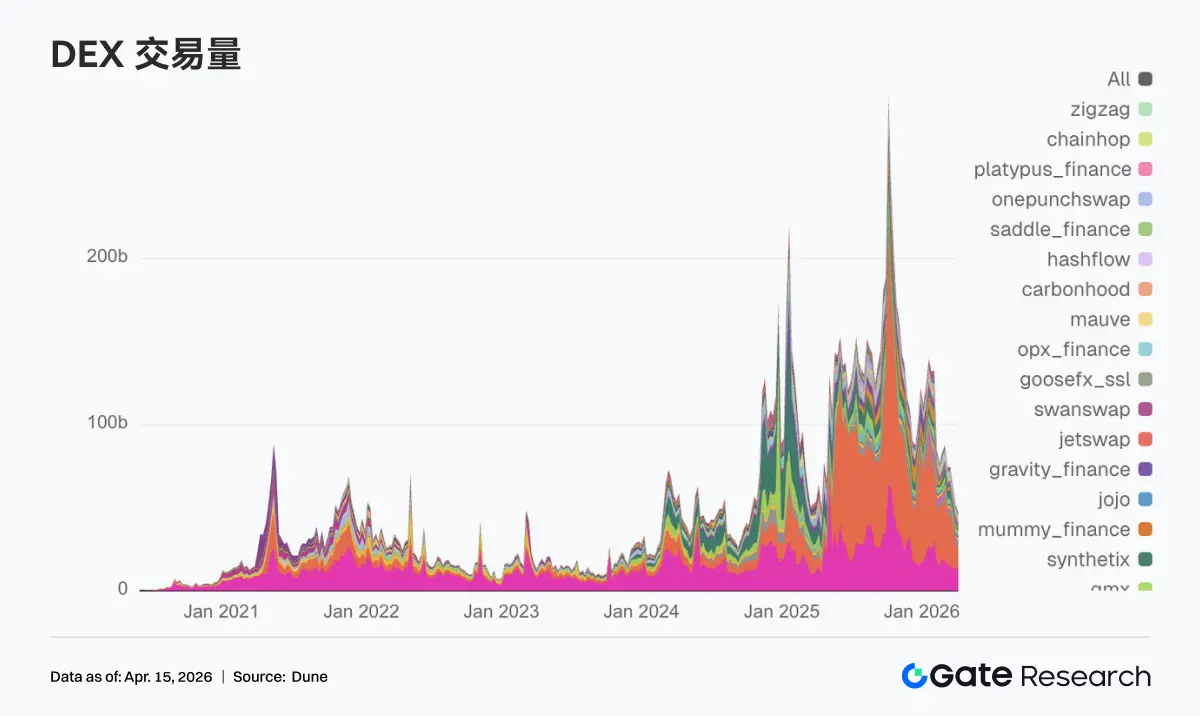
3.1 DEX Trading Focus Returns to Leading EVM Platforms, Uniswap Reclaims Top Spot
DEX trading volume returned to Uniswap, with a weekly transaction volume of $13.85 billion, followed closely by PancakeSwap at $10.33 billion. Compared to the previous week, PancakeSwap saw a decline, while Uniswap significantly increased, with funds flowing back to deeper liquidity and more mature trading pairs on the main platform. Additionally, Aerodrome and Bisonfi, representing Base and some emerging scenarios, absorbed some active funds; on the other hand, Whirlpool, Raydium, and Humidifi all saw declines, and internal trading within Solana did not form a comprehensive spread.
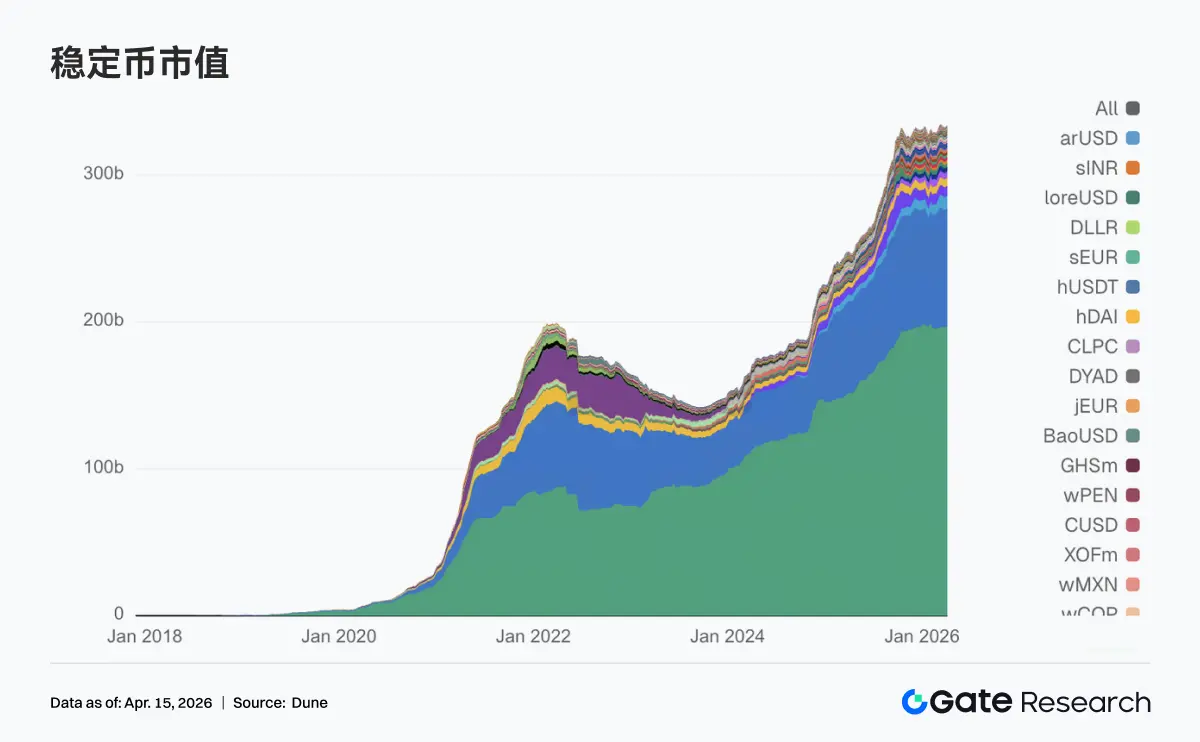
3.2 Stablecoin Total Maintains High Levels, USDC is the Main Increment Source
The stablecoin sector did not experience significant fluctuations this week, undergoing structural adjustments within a high range. USDT saw little change compared to the previous week, with underlying dollar liquidity remaining stable. USDC rose from $798.68 billion to $810.49 billion, becoming the clearest source of increment this week, indicating that funds are reallocating to mainstream settlement dollar assets. On the other side, USDS, USDe, DAI, and GHO all saw slight declines, and the decentralized stablecoin sector did not form a cohesive force this week. In terms of marginal changes, both USDG and PYUSD rose, indicating that new funds are still being diverted within payment-type and newly issued stablecoins.
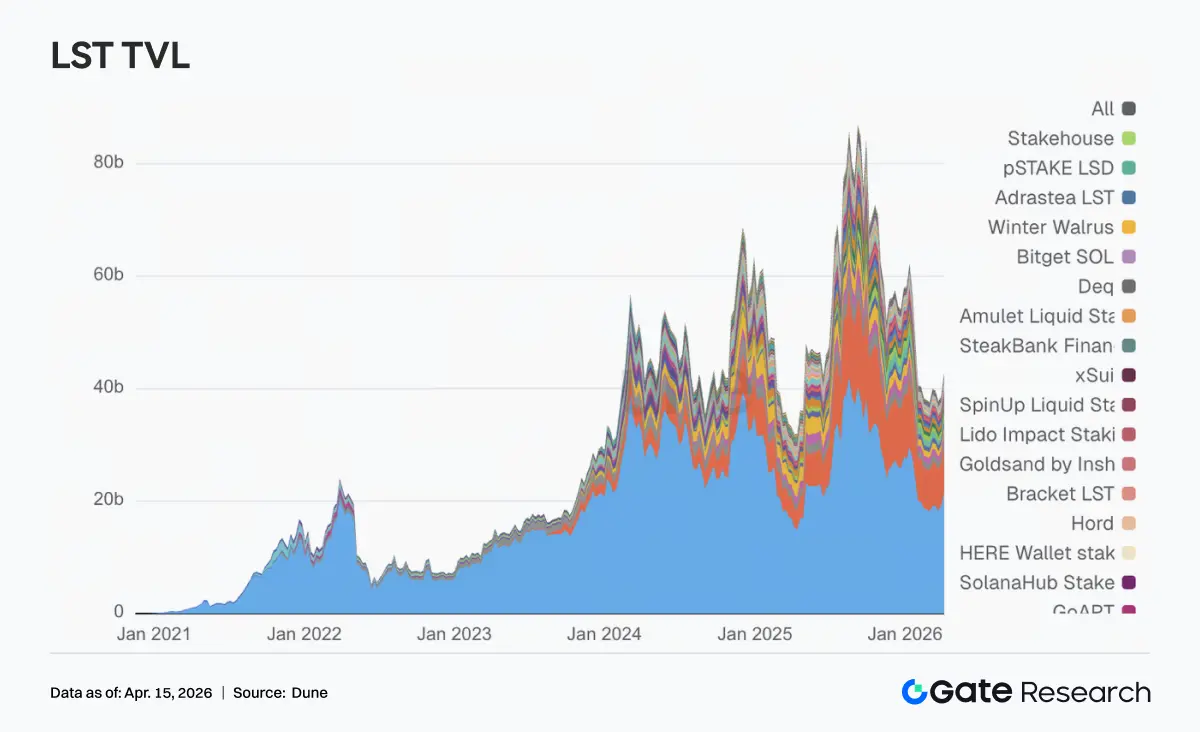
3.3 Liquid Staking Sees Uniform Recovery, ETH and SOL Both Raise Positions Simultaneously
This week, most leading protocols in the liquid staking sector recovered from previous pullbacks. On the ETH side, Lido rose to over $21 billion, and Rocket Pool also returned to $1.3 billion, with leading protocols overall strengthening. The SOL direction also showed recovery, with Sanctum Validator LSTs rising to $1.13 billion, and Jito and Jupiter Staked SOL also showing significant increases. This week marked a round of unified recovery following a warming of risk appetite, with funds first replenishing positions in leading protocols. Meanwhile, Lido has been promoting products around EarnETH, EarnUSD, and first-loss protection over the past month, continuously refining yield and risk layering, and these more institutionalized tools help enhance the willingness of large funds to return.
3.4 Aave Lending Scale Turns Upward, Main Market and Mantle, Plasma Work Together
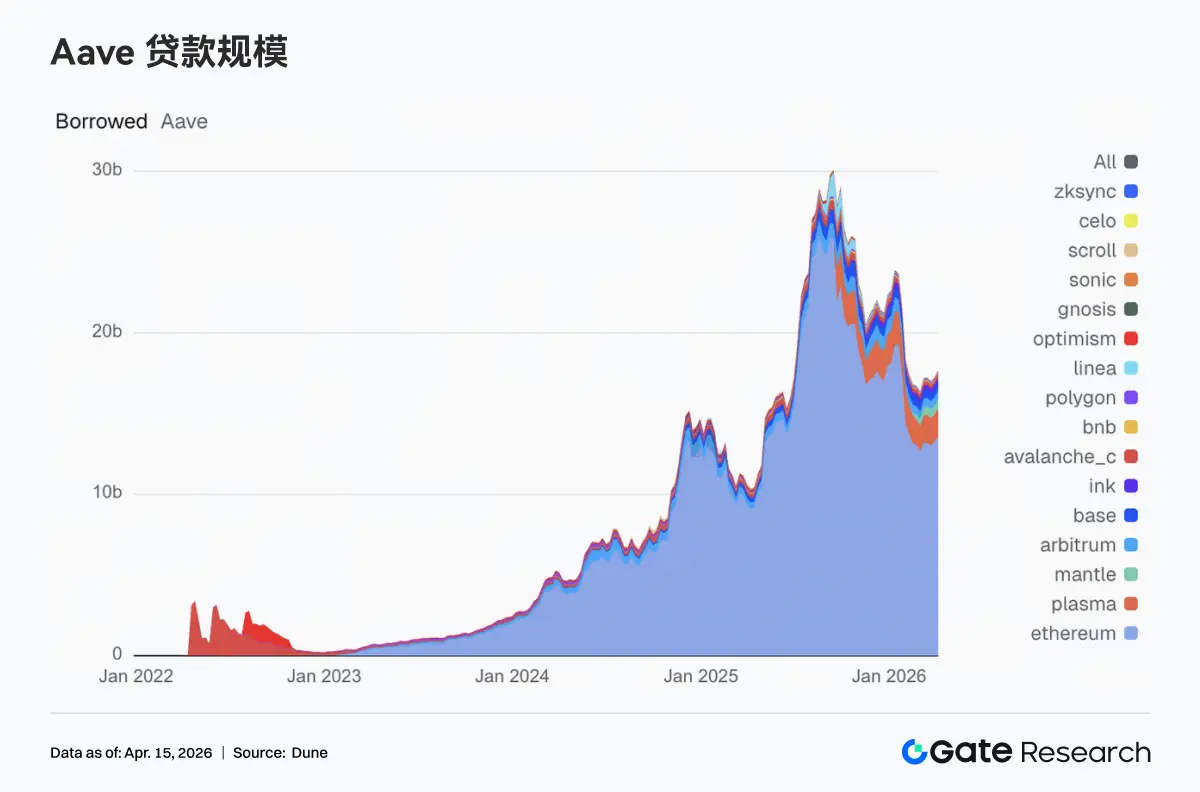
Aave's lending scale rose to approximately $17.69 billion, up from $17.25 billion the previous week. Among them, the Ethereum main market rose from $13.27 billion to $13.57 billion, becoming the core driving force for total volume. Meanwhile, Plasma increased from $1.66 billion to $1.71 billion, and Mantle rose from $590 million to $640 million, with Base and Arbitrum also standing around $517 million, indicating a simultaneous warming of multi-chain lending demand. In contrast, secondary markets like Avalanche, BNB Chain, and Polygon saw little change, with new financing demand still primarily concentrated on the few main chains with the deepest liquidity and highest trading efficiency.
3.5 Aave Funding Rates Diverge, USDC Loosens, USDT and WETH Rates Rise
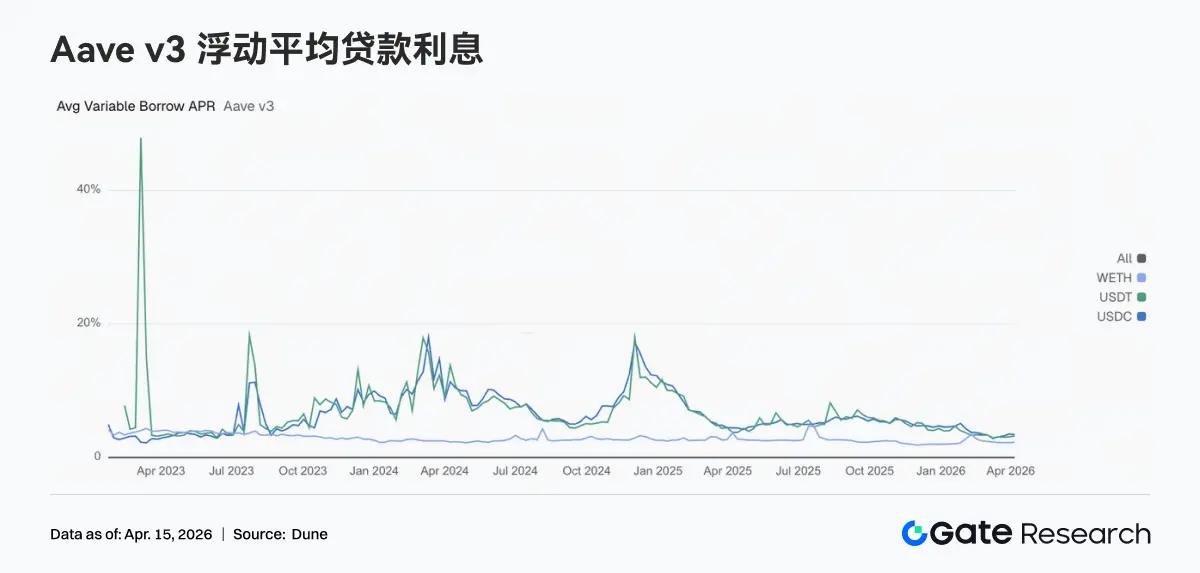
The three core assets of Aave did not move in the same direction. The average floating borrowing APR for USDC decreased from 3.51% to 3.42%, indicating slight easing of funding pressure; while USDT rose from 3.10% to 3.22%, and WETH also increased from 2.23% to 2.29%, with borrowing costs beginning to tilt towards these two assets. This combination typically corresponds to a clearer trading state, indicating that while total borrowing scale is growing, new financing demand has not continued to concentrate on USDC, but has partially flowed back to USDT turnover and ETH position management. If Aave V4 can truly implement risk isolation and cross-market routing, the interest rate differences between different assets may be further amplified, and this week has already shown the initial signs of this trend.
3.6 Protocol Revenue Returns to Trading Infrastructure Rotation Rhythm, Hyperliquid Rebounds Significantly
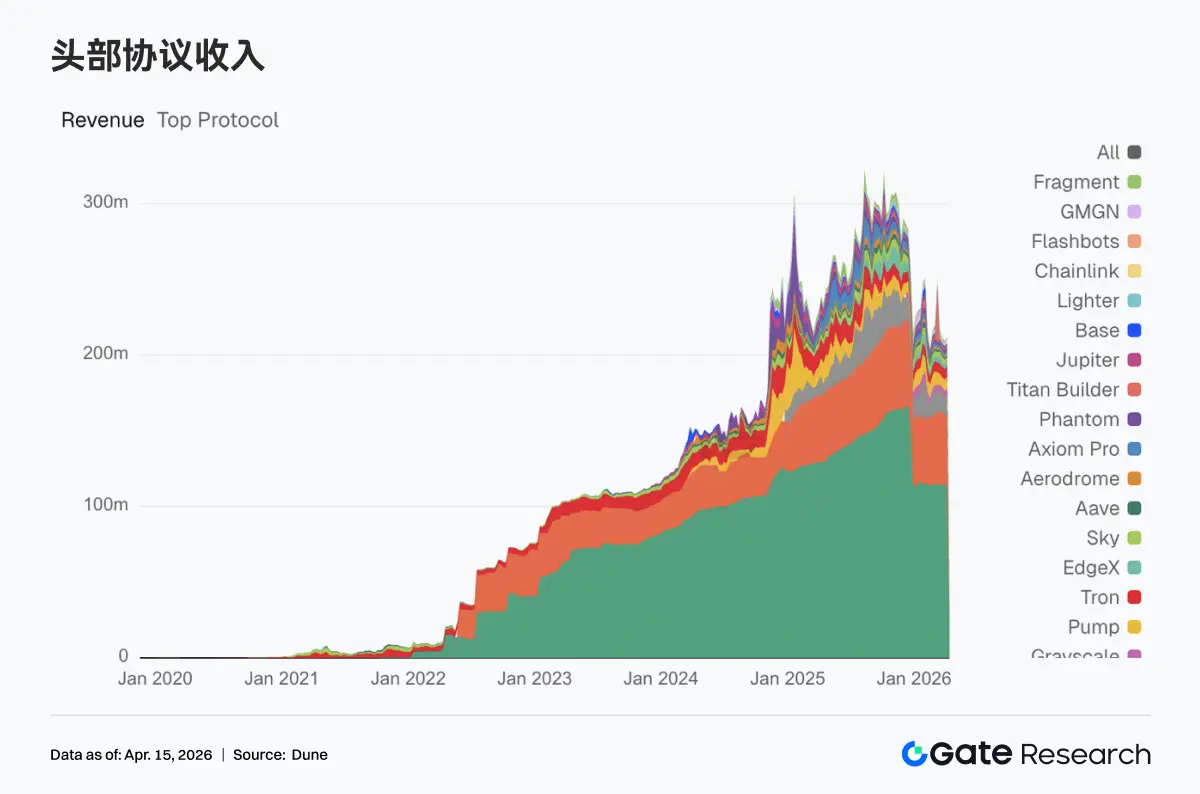
This week, the protocol revenue sector did not experience any abnormal peaks. Tether and Circle continued to hold the top two positions, with stablecoin issuance still being the most solid base in the current crypto income system. In terms of trading protocols, Hyperliquid rose from $11.32 million to $13.68 million, Titan Builder jumped from $558,000 to $1.438 million, and Aerodrome increased from $1.113 million to $1.960 million, with funds and trading volume re-concentrating on more efficient infrastructure layers.
In contrast, Phantom fell from $1.976 million to $1.332 million, and Jupiter dropped from $1.541 million to $928,000, indicating a decline in the heat of front-end entry and distribution layers. Aave's revenue rose to $1.441 million, although not significantly elastic, but relatively stable, with the profitability quality of lending protocols still clearly better than high-turnover platforms this week. Overall, the signals released from the revenue side are relatively clear, indicating that the market has not deviated from trading, but rather that funds have flowed back to more efficient transaction execution, stronger clearing capabilities, and more stable cash flow quality in the infrastructure segment.
4. Derivatives Tracking
4.1 BTC Funding Rates Turn Deeply Negative but Prices Strengthen, Open Interest Rapidly Rebounds to Phase Highs
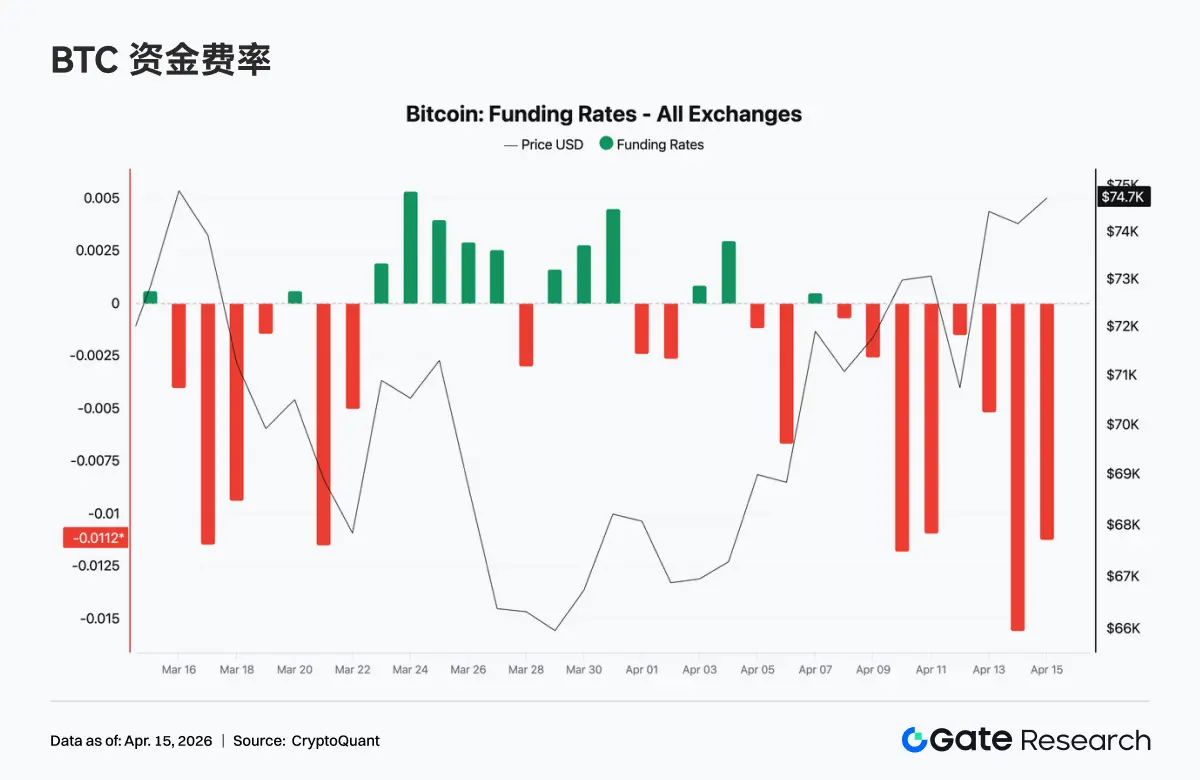
In the past week, BTC funding rates remained in negative territory overall, with a phase of extreme negative values (lowest close to -0.015) appearing around April 13, indicating that bearish sentiment clearly dominated the perpetual contract market, with significant increases in short positions. However, at the same time, spot prices rebounded from around $69K to above $74K, forming a typical structure of rising prices but negative funding rates. This structure usually means that shorts are passively paying funding fees while bearing the pressure of rising prices, indicating potential short squeeze momentum. Overall, the current market is in a phase dominated by bearish sentiment but driven by spot or structural buying, making it easy to trigger short covering and accelerate upward movement amid volatility in the short term.
The total open interest in the BTC market rapidly rose from around $22.5 billion to about $25.3 billion over the past week, rebounding in sync with prices above $74K, indicating that leveraged funds are clearly flowing back into the market. Notably, there was a rapid drop in open interest on April 11 (similar to concentrated liquidations or squeezes), which quickly recovered and reached new highs, indicating that this structure of first deleveraging and then re-leveraging usually means that weak positions have been cleared out, allowing new trend funds to enter. Considering that funding rates remain negative, the current rise in open interest may be driven by short and hedge positions, with the market in a state of high leverage, directional divergence, but leaning bearish; if prices continue to rise, there remains room for further short squeezes.
4.2 Event-Driven Short-End Crowding, Mid to Long-End Defensive
The structure of options trading and open interest shows event-driven characteristics. Monthly options and daily options saw simultaneous increases in volume, with daily options reaching a weekly peak on April 10, engaging in high-frequency speculation around the back-and-forth fluctuations following the ceasefire's disconfirmation; monthly options concentrated their volume during the ceasefire expectation phase from April 7 to April 8, reflecting institutions adjusting mid-term directional strategies during the geopolitical window. In contrast, cyclical options continued to see reduced volume, indicating a lack of clear directional consensus in the 1-2 week dimension. From the expiration structure, transactions mainly concentrated on contracts expiring on the same day and next Friday, showing clear defensive demand on the short end; mid to long-term transactions decreased, overall leaning towards neutral configurations. In terms of block trading, BTC primarily engaged in term structure arbitrage (long short-end vol, short mid vol), while ETH dominated with strategies like selling straddles, indicating that the current market is more focused on volatility structure and range speculation rather than unilateral directional bets.
4.3 Defensive Premiums Still Exist, but Bearish Sentiment Marginally Eases
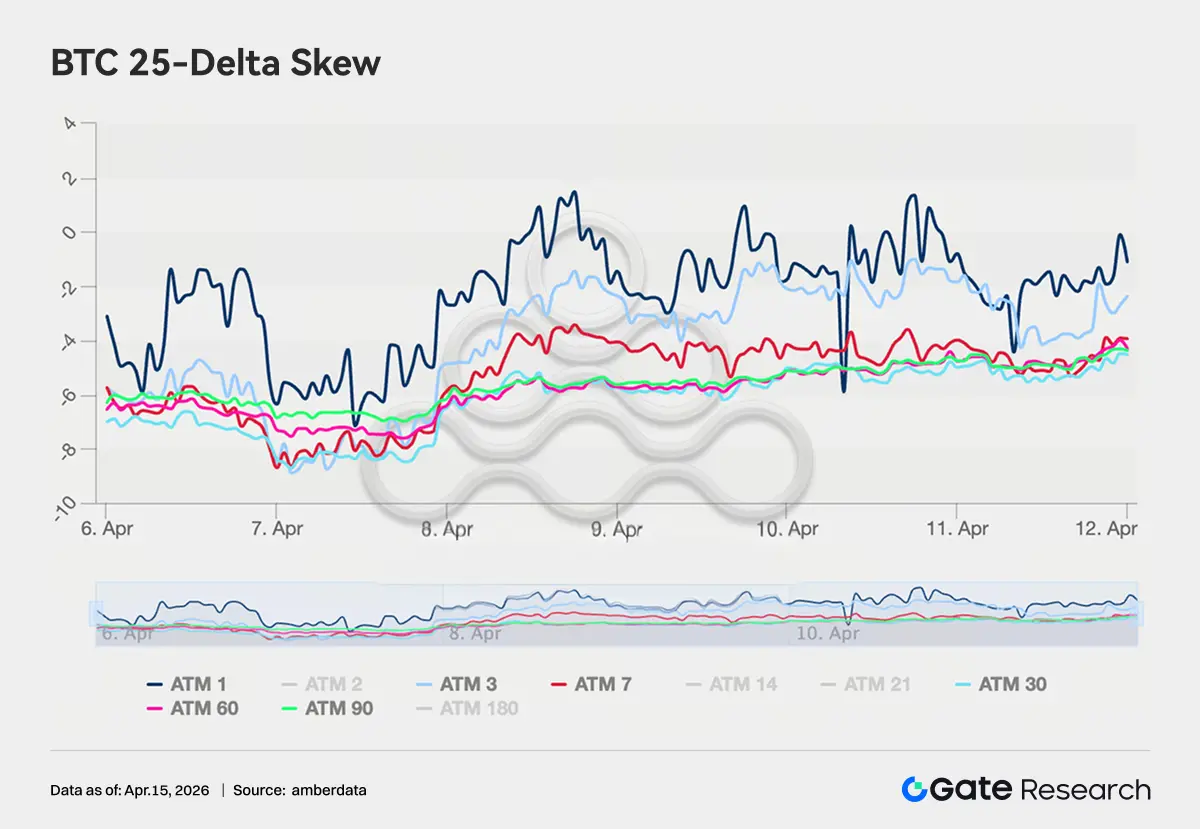
The BTC 25-Delta Skew across all maturities remains in the range of -4 to -8 vol, with put premiums still dominating, indicating that the market overall maintains a hedging demand against downside risks. However, compared to the extreme range of -8 to -11 vol at the end of March, the skew has clearly risen by about 2-3 vol points, reflecting a marginal easing of bearish sentiment. The changes in ETH skew are more pronounced, moving from the previous range of -5 to -8 vol to an overall shift to -3 to +2 vol, with some maturities even approaching symmetry, indicating that the market's pricing of tail downside risks has significantly contracted. However, the long-end skew has not yet clearly turned positive, and institutions have not fully shifted to offensive strategies, maintaining an overall configuration state of reduced defense but not completely lifted.
4.4 DVOL Returns to Baseline Range, Volatility Premium Enters Compression Phase
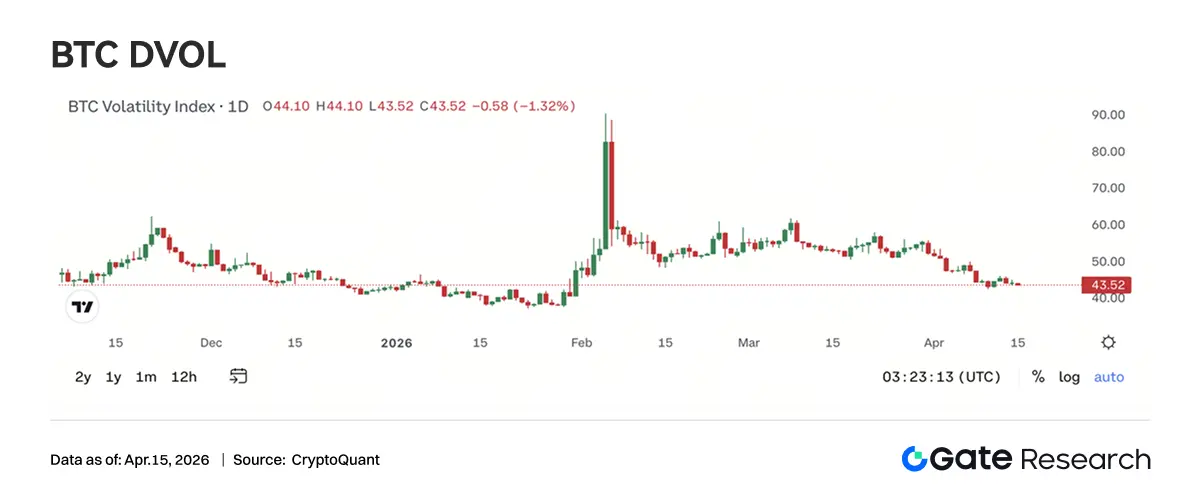
BTC DVOL is currently around 44.76, having continuously declined from the extreme levels of 90+ triggered by geopolitical conflicts in early February, essentially returning to the baseline range of mid-January. The April ceasefire event only brought a brief pulse (45→50), followed by a rapid decline, indicating that the market no longer assigns high volatility premiums to single geopolitical events. Current DVOL is close to the six-month average support (in the range of 45-48), and if it further dips to around 40, it will enter a historically low volatility zone. ETH DVOL is currently around 65.50, also falling back to pre-conflict levels, but still about 20 vol points higher than BTC. Combined with a large number of sell straddles and volatility selling strategies in block trading, it can be confirmed that the mainstream market judgment is for a low-volatility oscillation environment. Overall, volatility has entered the final compression phase, with the profit space for sellers narrowing, but at the same time providing a more cost-effective entry window for mid-term volatility buying strategies.
- This Week's Outlook
 **
**
6. Gate Institutional Dynamics Update
Trading Performance: Structural Optimization, Overall Outperforming the Market
• Spot and contract trading overall outperformed the market, with contracts leading the industry.
• After iterations of market-making fees and assessment rules, the activity of mid-tier clients has significantly increased, and trading structures continue to optimize.
CrossEx: Trading Volume and Asset Depth Reach Historical Highs, Accelerating Linkage with Asset Management Platforms
• CrossEx incentive activities continue to drive recharge and trading volume, with multiple clients entering the live trading and strategy phase, achieving historical highs in both trading volume and asset depth;
• Ongoing promotion of linkage with asset management platforms and OTC loans.
Funding Business: Demand Continues to Warm, Structural Differentiation
• The scale of spot and full-margin lending has grown significantly.
• Lending demand for ETH, USDT, and popular assets has rebounded sharply.
Technical Progress: Dual Improvement in Performance and Functionality
• Websocket SBE launched, enhancing data transmission efficiency.
• AI customer service robot has been initially implemented, gradually empowering BD and customer service.
Data Sources:
• Investing, https://investing.com/currencies/xau-usd-historical-data
• Gate, https://www.gate.com/trade/BTC_USDT
• CMC, https://coinmarketcap.com/real-world-assets/?type=all-tokens
• Coinglass, https://www.coinglass.com/pro/depth-delta
• Dune, https://dune.com/gateresearch/gate-tradfi#weekly-volume
• Dune, https://dune.com/gateresearch/gate-institutional-weekly-report
• Bybit, https://www.bybit.com/future-activity/en/tradfi
• Bitget, https://www.bitgettradfi.com/tradfi/XAUUSD
• CryptoQuant, https://cryptoquant.com/asset/btc/chart/derivatives
• Amberdata, https://pro.amberdata.io/options/deribit/btc/current/
Gate Research Institute is a comprehensive blockchain and cryptocurrency research platform that provides readers with in-depth content, including technical analysis, hot insights, market reviews, industry research, trend forecasts, and macroeconomic policy analysis.
Disclaimer
Investing in the cryptocurrency market involves high risks, and users are advised to conduct independent research and fully understand the nature of the assets and products they are purchasing before making any investment decisions. Gate is not responsible for any losses or damages resulting from such investment decisions.
 Risk warning