


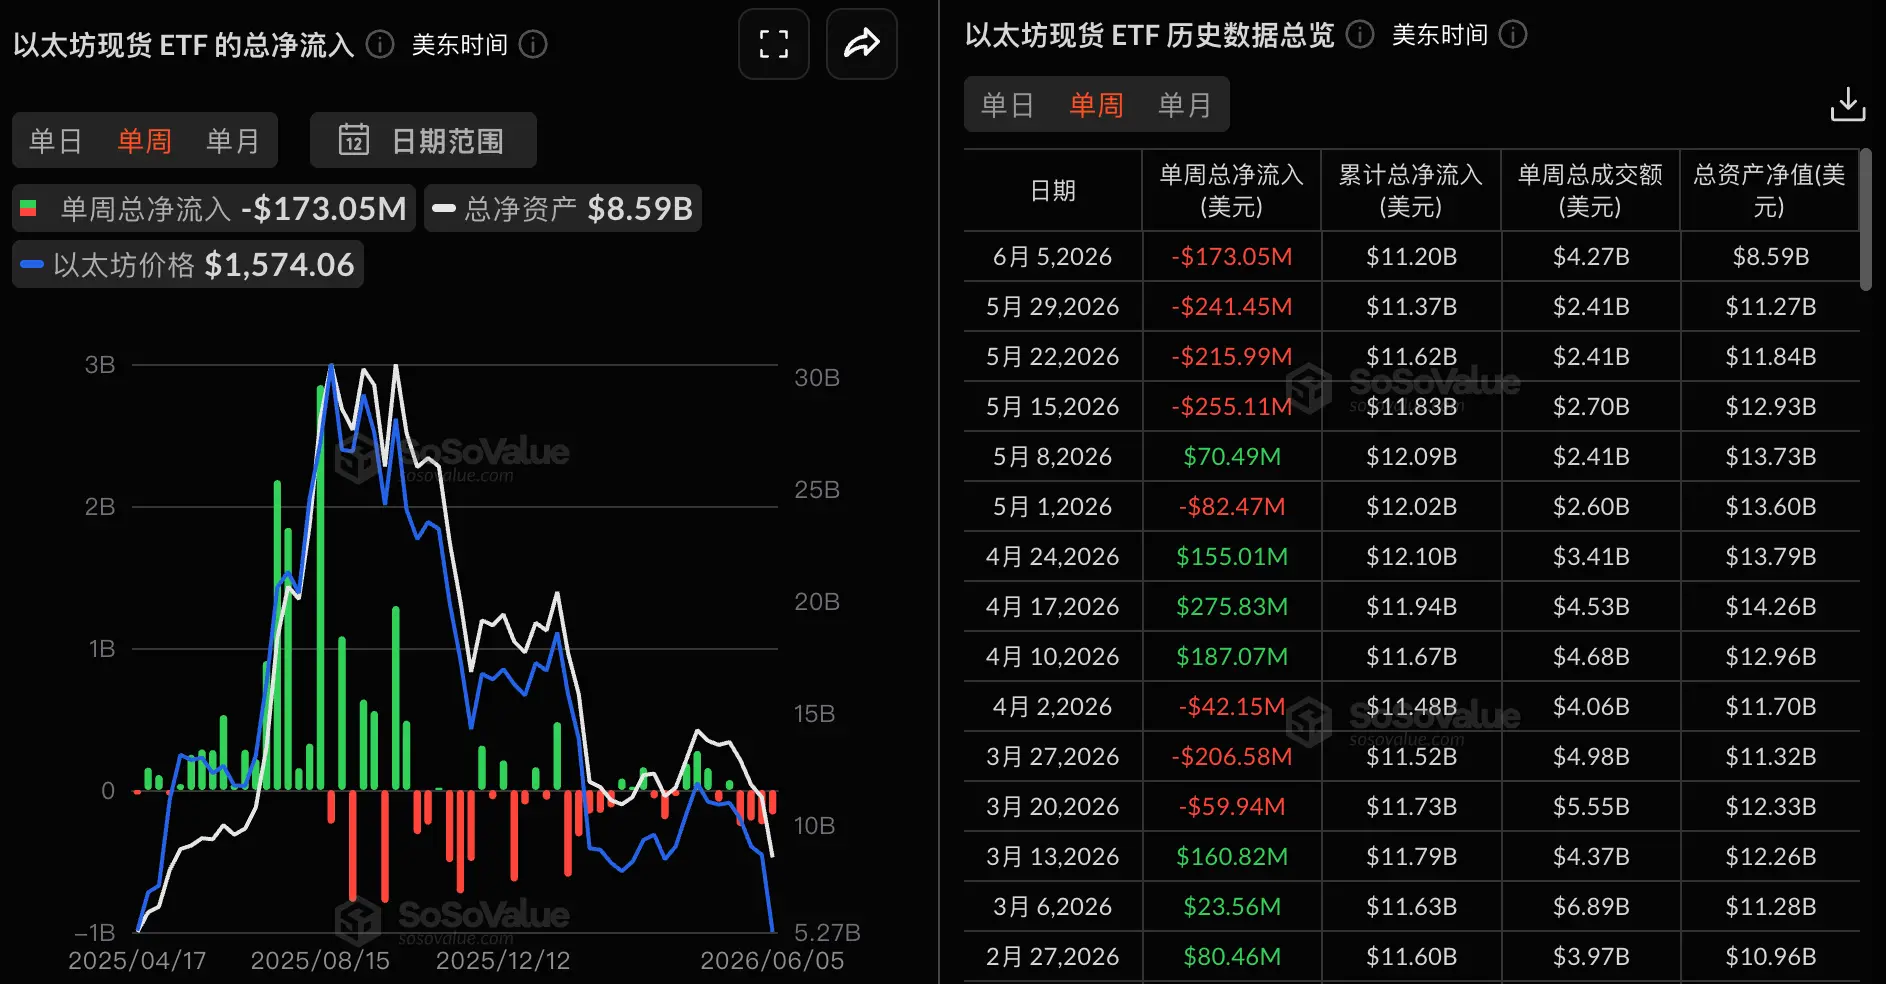
Data: Ethereum spot ETF had a net outflow of $173 million last week, marking four consecutive weeks of net outflows
According to SoSoValue data, during the last trading week (Eastern Time from June 1 to June 5), Ethereum spot ETFs experienced a net outflow of $173 million.
The Ethereum spot ETF with the highest net outflow last week was the Blackrock ETF ETHA, with a weekly net outflow of $125 million, and the historical total net inflow for ETHA has reached $11.31 billion. The second was the Fidelity ETF FETH, with a weekly net outflow of $26.4459 million, and the historical total net inflow for FETH has reached $2.13 billion.
The Ethereum spot ETF with the highest net inflow last week was the Blackrock ETF ETHB, with a weekly net inflow of $3.026 million, and the historical total net inflow for ETHB has reached $534 million.
As of the time of writing, the total net asset value of Ethereum spot ETFs is $8.590 billion, with an ETF net asset ratio (market value relative to the total market value of Ethereum) of 4.44%, and the historical cumulative net inflow has reached $11.20 billion.

 Risk warning Risk warning


