RootData: Have we reached the bottom of the bear market? Understand the cryptocurrency industry cycle through six charts
 Core Viewpoint

 The number of new projects, financing and merger trends, the number of investors, the number of new tokens... Based on exclusive data from RootData, better understand the current state of the cryptocurrency industry's development and its position throughout the historical cycle.
Author: Gu Yu, RootData
Recently, with projects like BitMEX and Bitmart announcing their shutdowns one after another, dead projects have once again become the focus of market discussions. Currently, RootData has compiled the "2026 Crypto Dead Projects List" which includes over 100 projects.
The large-scale elimination of low-quality projects and extreme pessimism in sentiment are often seen as signs of a market bottom during a bear market. At this point in time, where exactly does the crypto industry stand in its historical cycle? What are the indicators regarding the number of new projects, new tokens, and financing data?
Based on these questions, RootData has organized exclusive multidimensional data from the platform and created 5 charts to better help everyone understand the current state of development in the crypto industry and its position within the entire historical cycle.
1. Number of New Projects
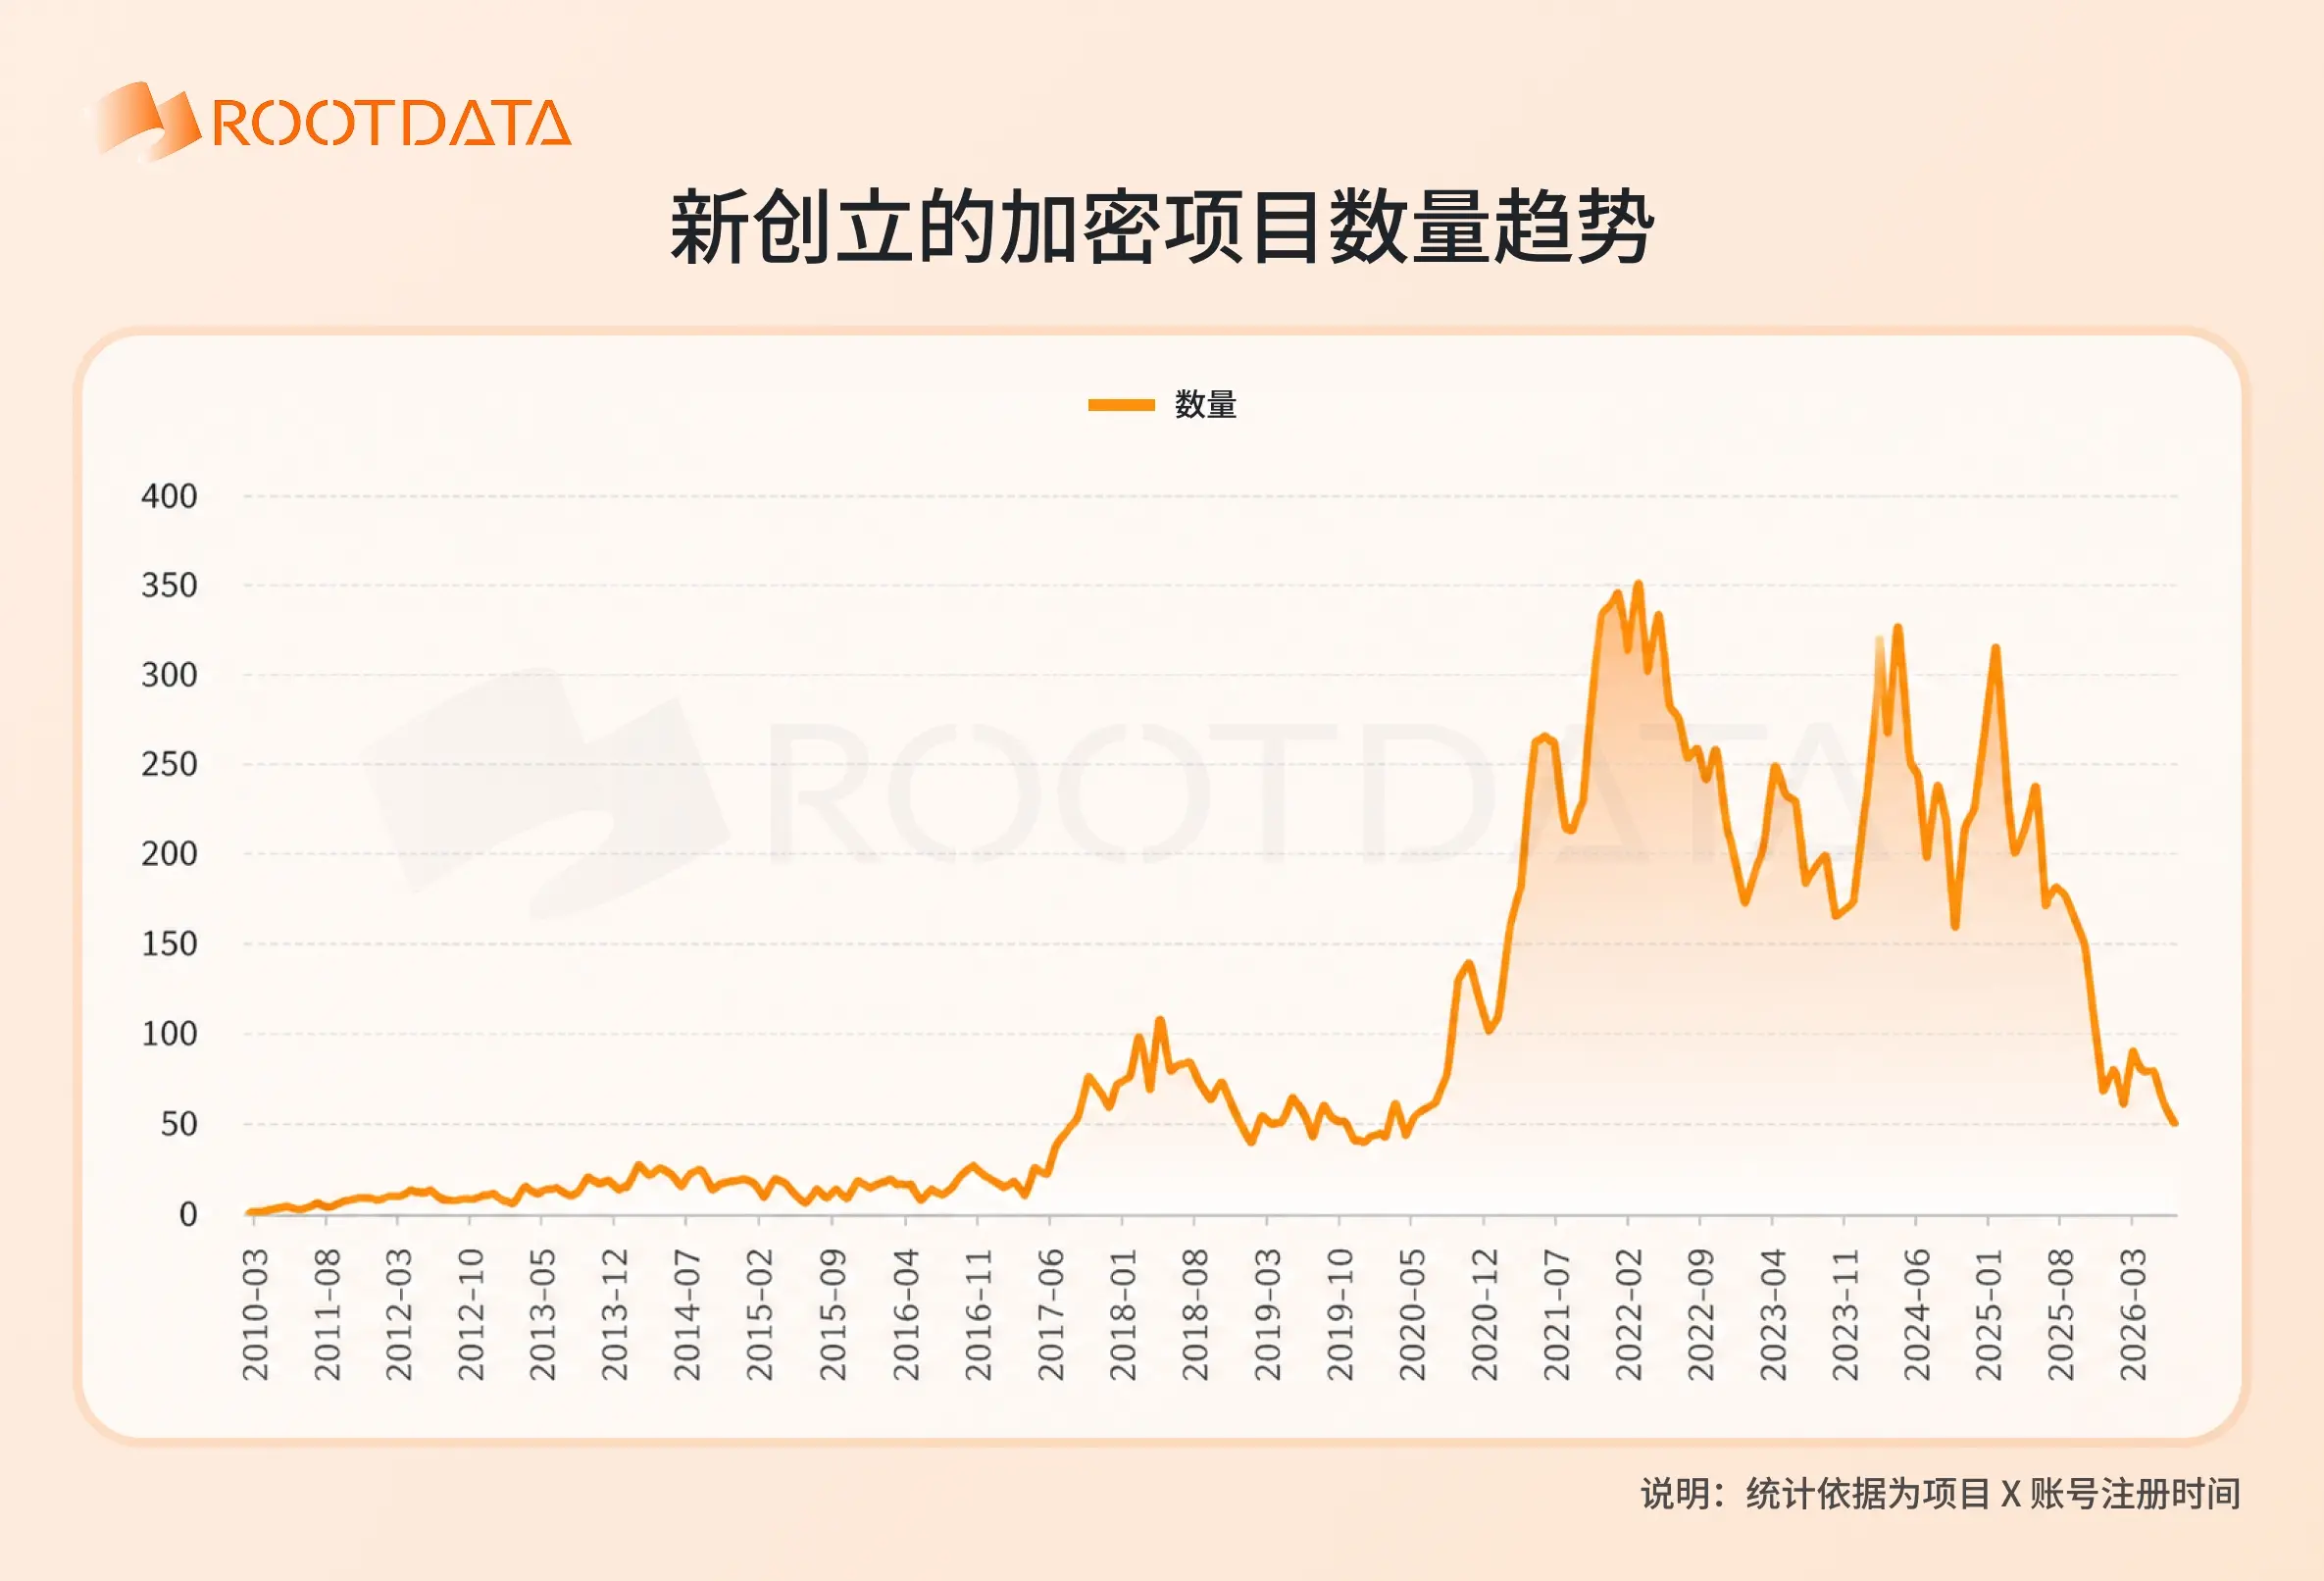
The number of new projects is one of the most important indicators for assessing the activity in the crypto market, reflecting entrepreneurs' enthusiasm for the prospects and opportunities in the crypto market.
This chart is primarily based on the registration time statistics of over 20,000 projects collected by RootData, which can accurately represent the establishment and market entry of new projects, down to the month.
From this chart, it can be seen that the peak period for the number of newly established crypto projects was from September 2021 to January 2022, with over 300 new projects each month, while BTC prices reached a historical high of $69,000 during this period. After that, the number of new projects has shown a continuous downward trend, with slight rebounds in March 2023, March 2024, and January 2025.
Since then, the number of new projects has plummeted, with the monthly count not exceeding 80 this year, approaching levels seen before August 2020. Interestingly, the current BTC price is on par with the price during the peak period for new project numbers at the end of 2021.
2. Project Financing Data
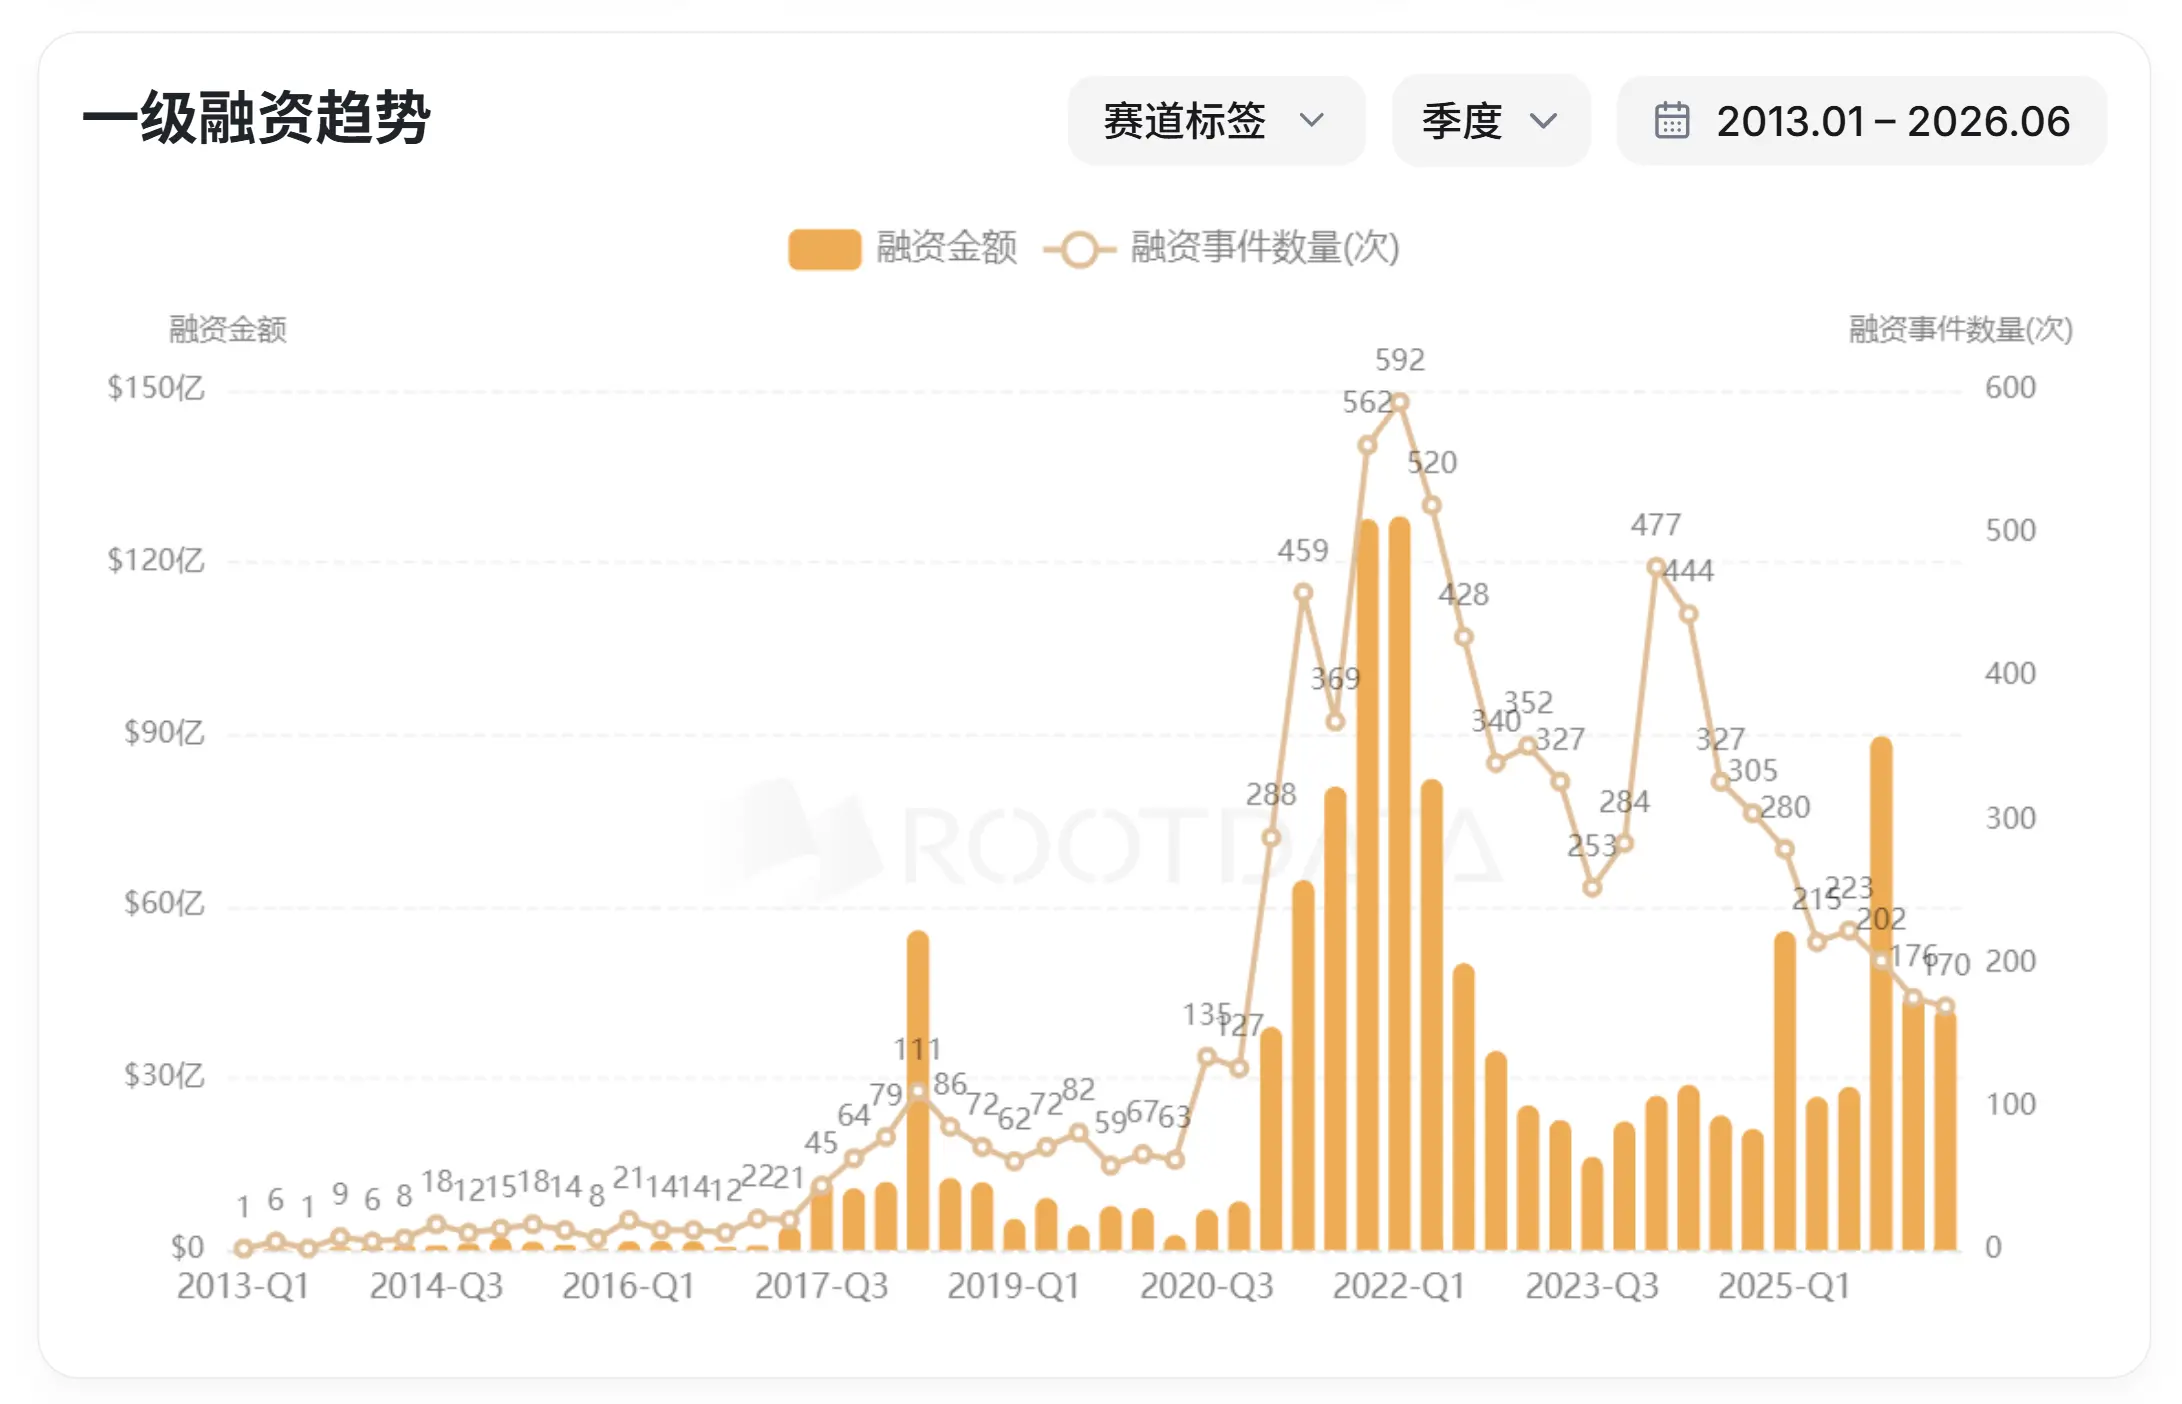
In recent years, financing in the crypto primary market has shown significant characteristics of peak decline and structural adjustment.
From 2021 to early 2022, the market was in an extremely active phase, with quarterly financing amounts repeatedly exceeding $10 billion, peaking at nearly $13 billion, and the number of financing events climbing to a historical peak of 592, with both the scale and frequency of capital inflow reaching a temporary high.
As the prices of mainstream cryptocurrencies fell and the market turned bearish, financing amounts dropped to near five-year lows in 2023 and have continued to hover at that level. However, the number of financing events quickly surged in March 2024, attempting to capture potential opportunities through a "broad net" diversification investment strategy under limited funding, but this strategy has proven difficult to avoid disappointing investment returns.
In the past year, the trends of financing quantity and financing amount have gradually diverged in opposite directions. Although the number of financing events has continued to decline in recent years, the financing amount has significantly increased since the end of 2024, mainly due to substantial funding from leading projects like Binance, Polymarket, and Dunamu.
Currently, the number of financing events in the crypto market has declined for three consecutive years, marking the longest downward cycle in the history of the crypto industry. Even the new highs in BTC prices in 2025 have not reversed this trend, reflecting that capital has shifted to a highly cautious allocation logic, accelerating concentration in leading tracks and projects with strong certainty and high barriers, rather than broadly betting on emerging projects, intensifying the Matthew effect in the market.
3. Number of Mergers and Acquisitions
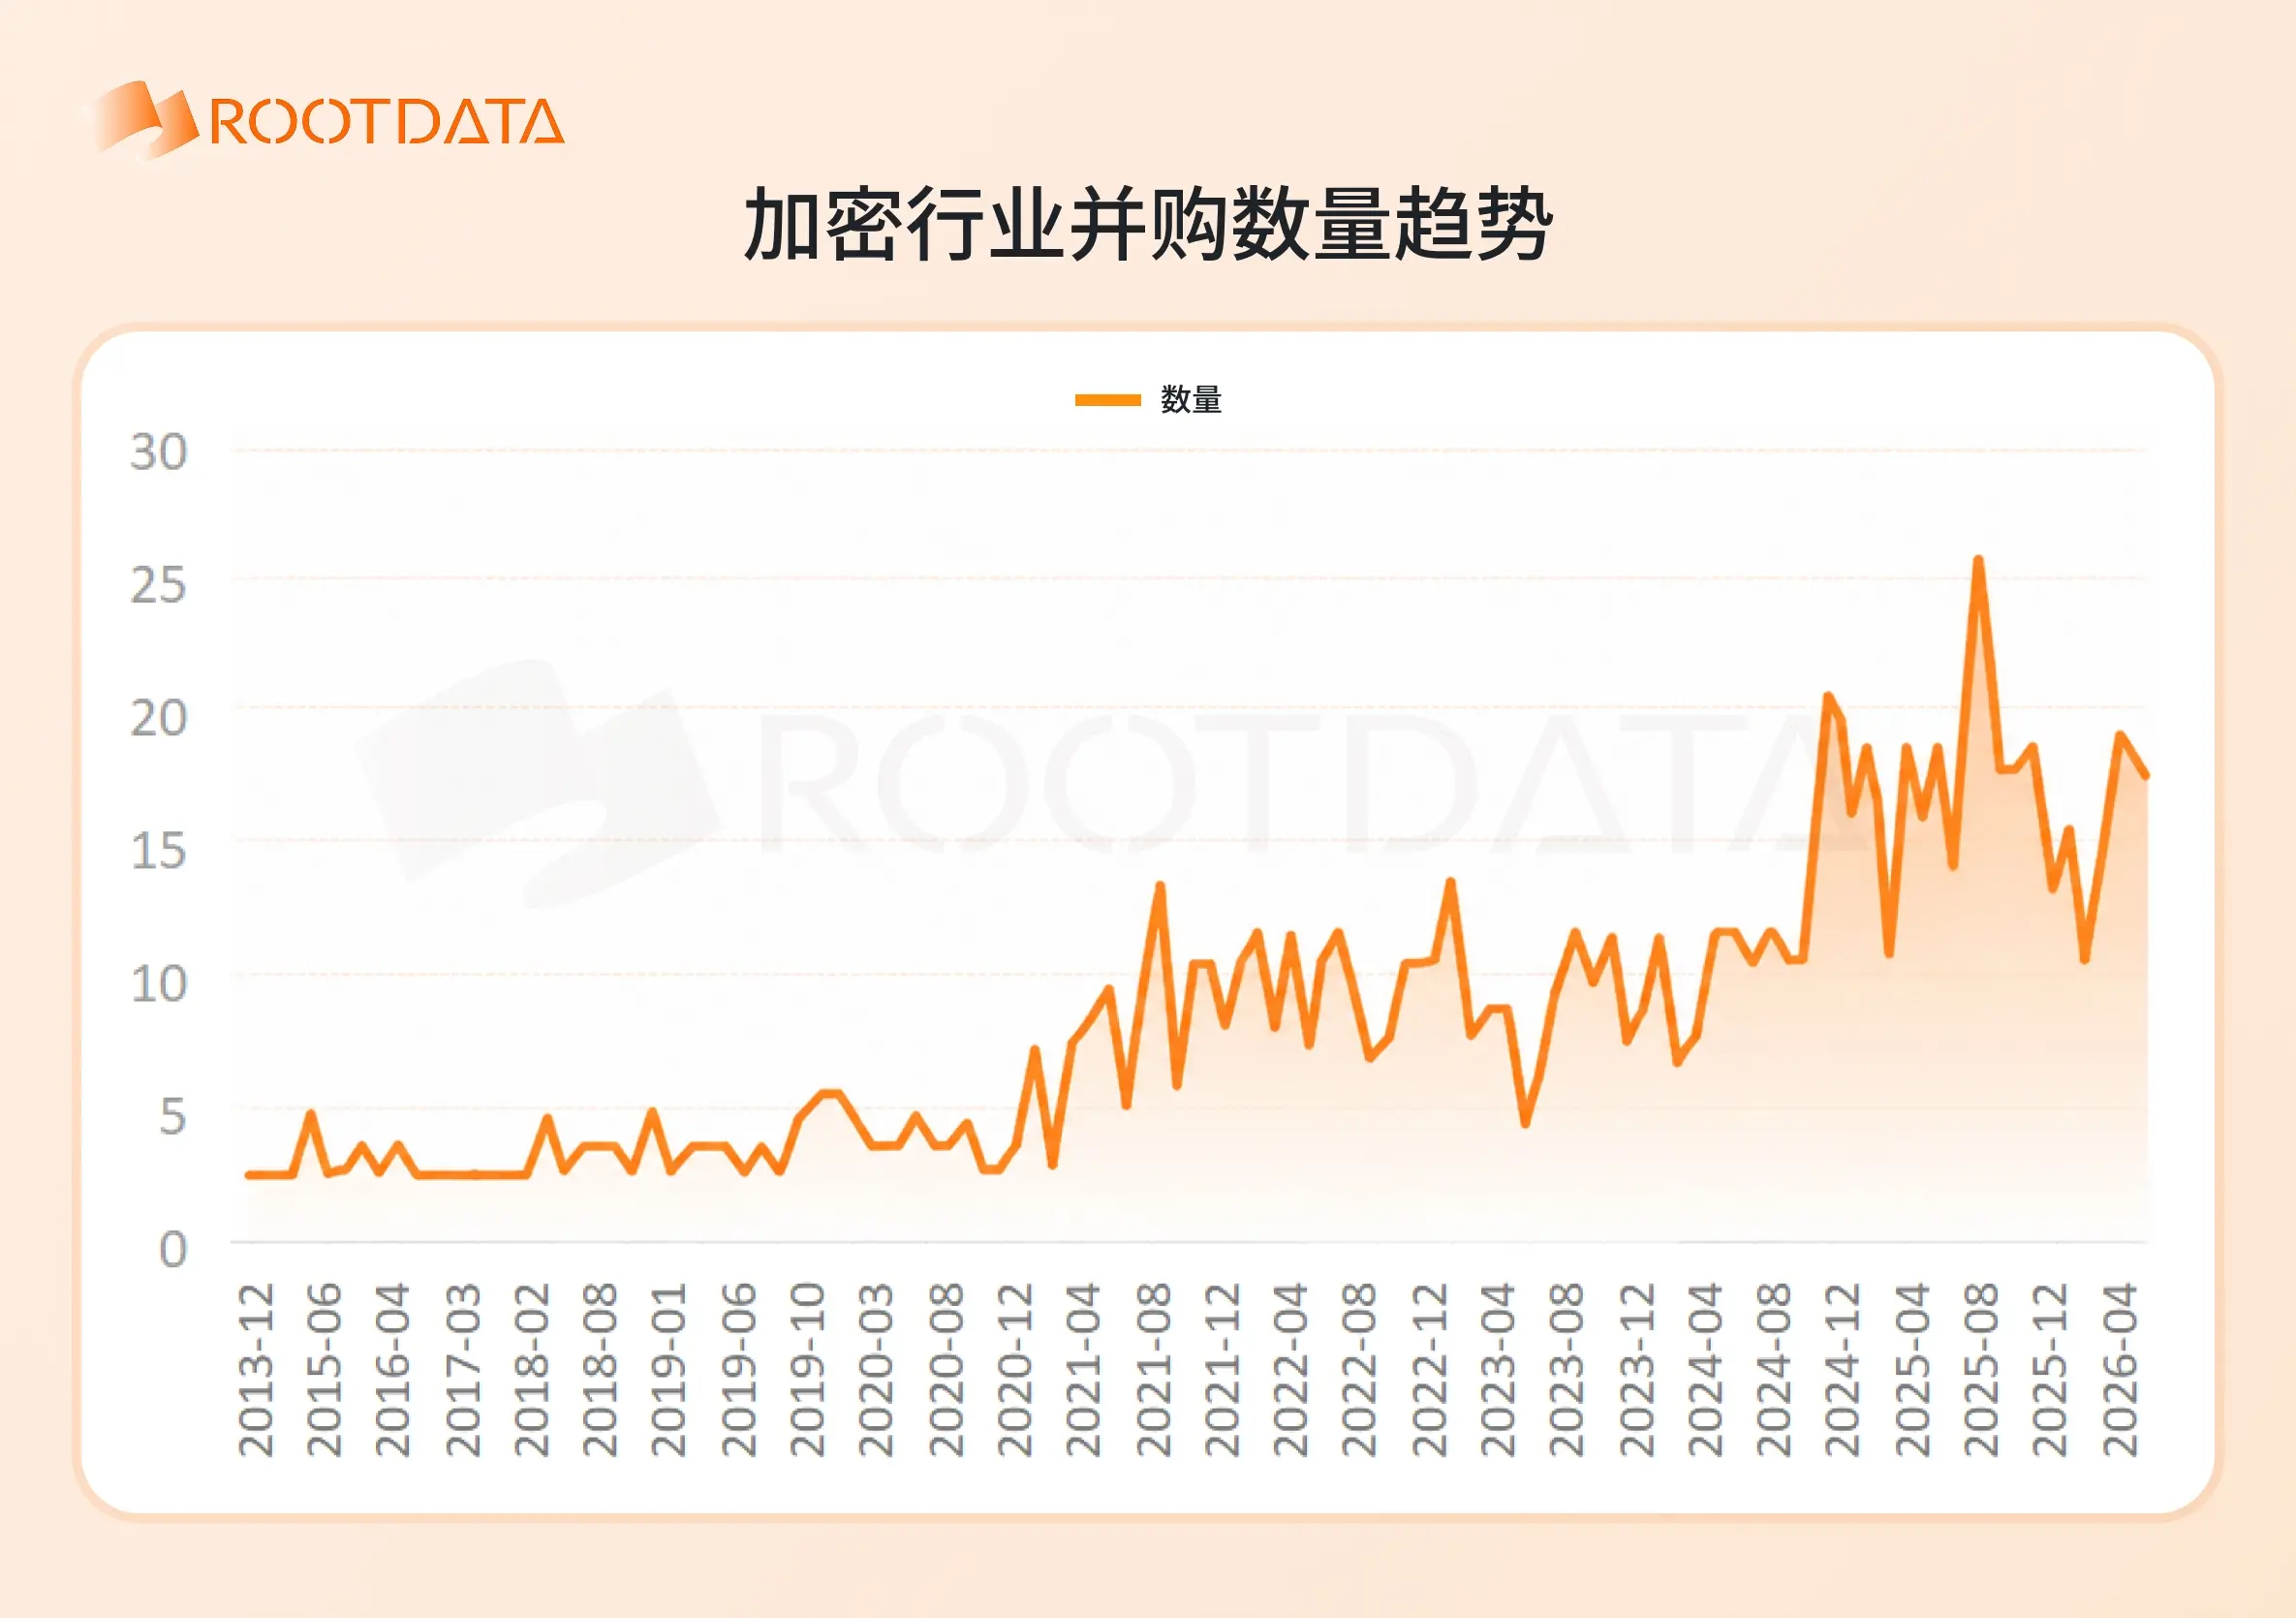
In contrast to the significant contraction trend in the crypto investment and financing market, the number of mergers and acquisitions in the crypto industry remains at a historical high, undergoing a structural transformation from sporadic exploration to full-scale explosion.
Between 2013 and 2020, the volume of mergers and acquisitions in the crypto industry remained in single digits for a long time, breaking 10 deals for the first time in 2021, reaching 11 deals in 2022, and then accelerating upward. The year 2025 became a landmark watershed: a total of 267 mergers and acquisitions were completed throughout the year, a year-on-year increase of over 50%.
Entering 2026, despite the bearish trend in the spot prices of the crypto market, merger and acquisition activities have instead heated up against the trend. In the first half of the year, there were 75 transactions totaling over $9 billion, a staggering 26-fold increase compared to the same period last year.
Typical cases include Mastercard's acquisition of payment infrastructure BVNK for $180 million, and Blockworks acquiring the data platform Messari at a price significantly below its previous valuation (over 90% discount), clearly indicating that low-price bottom-fishing and infrastructure positioning have become mainstream strategies.
At the same time, crypto giants like Coinbase, Kraken, and Moonpay are looking to enhance their control over the upstream and downstream industrial chains through mergers and acquisitions, filling in core capability gaps; traditional internet and financial companies are accelerating their entry into the market, acquiring core capabilities through mergers and acquisitions to gain an advantageous position in the increasingly large crypto market.
Overall, crypto mergers and acquisitions are evolving from cyclical activities into a wave of institutional integration. As the global regulatory framework gradually becomes clearer, the future of the crypto industry may be dominated by a few giants holding licenses and infrastructure, and the integration process will continue to deepen.
4. Number of New Tokens
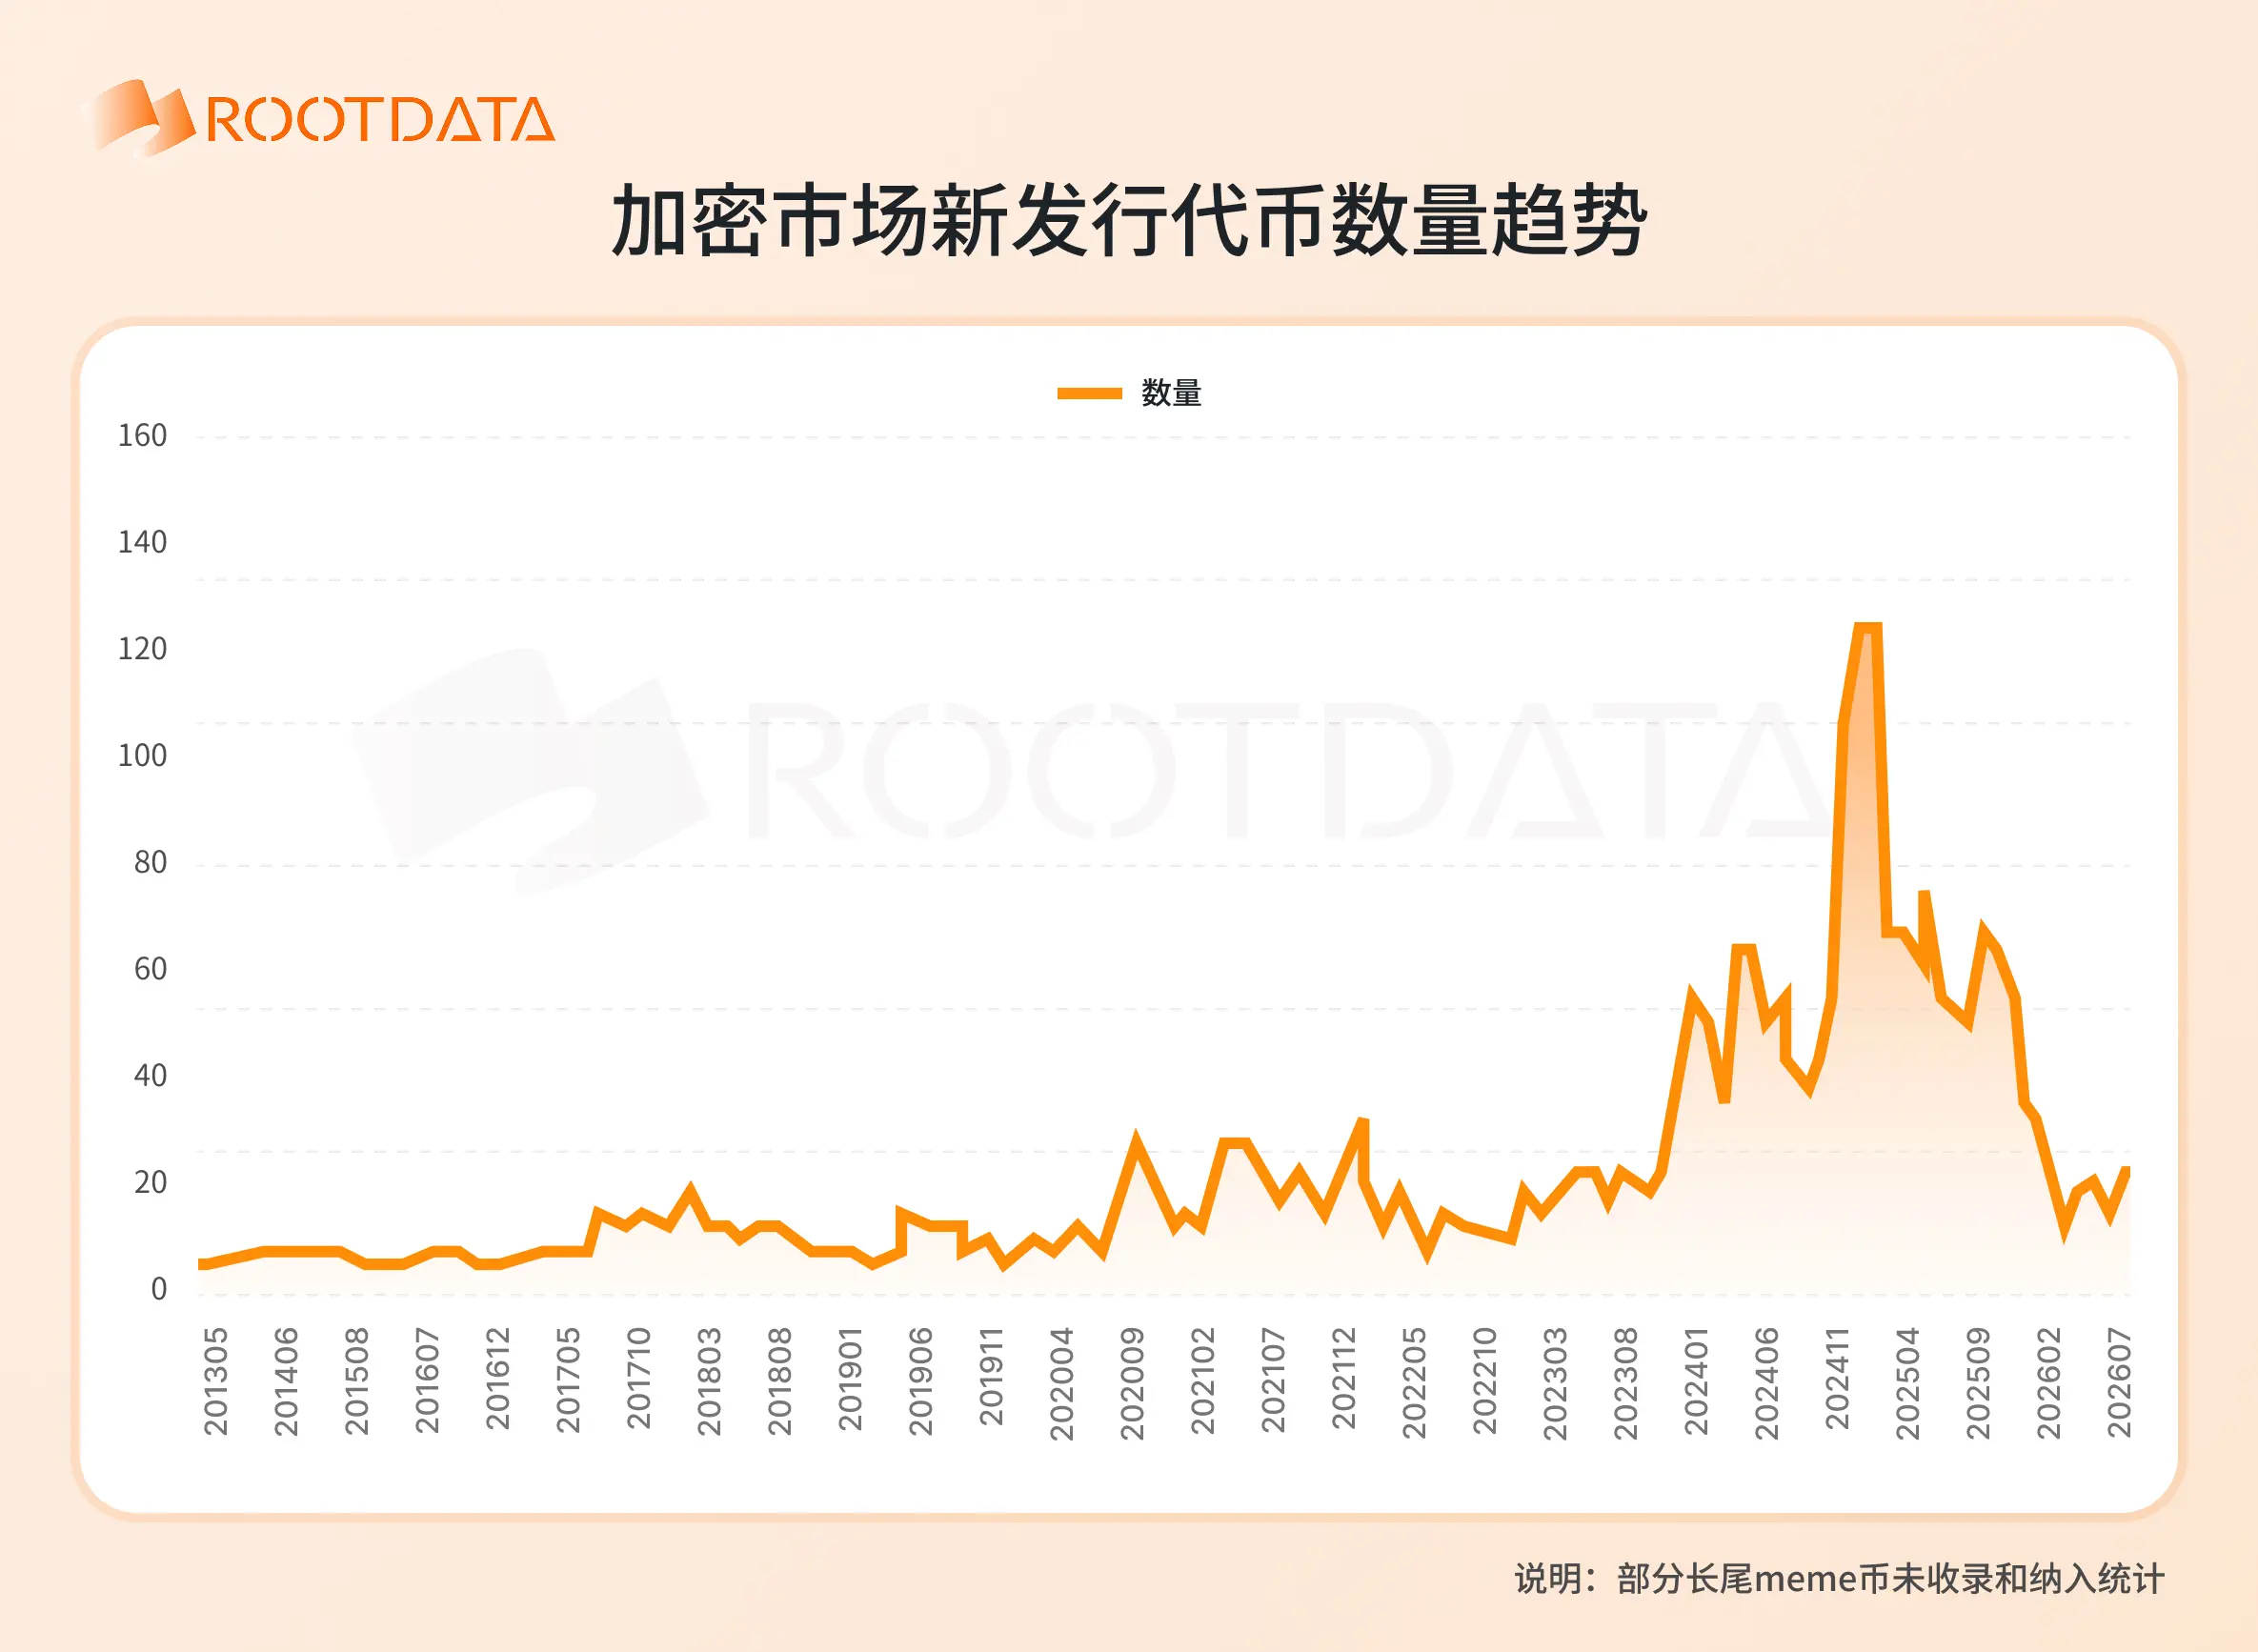
The number of new tokens is one of the most important indicators reflecting the activity in the crypto secondary market, with most project teams preferring to issue tokens during periods of market recovery and positive trends, closely related to the heat of new narratives.
Throughout the historical cycle, the number of new tokens experienced two small peaks in 2018 and 2021, but the real historical peak period began in March 2024, reaching a record of 145 new tokens in January 2025, which is far from the peak periods of other charts.
This is mainly related to the Meme craze and AI agent narratives that have emerged since 2024. In January 2024, pump.fun launched on the Solana mainnet, significantly lowering the technical barriers for ordinary users to issue tokens. Around March 2024, the meme craze officially erupted, with tokens like BONK, WIF, and BOME frequently seeing hundredfold increases, leading to a market narrative of "attention equals value": anything that can attract attention can be tokenized.
By the end of 2024, projects like Truth Terminal and ai16z drove the AI agent narrative to popularity, with Virtuals Protocol allowing users to quickly create, tokenize, and trade AI agents, resulting in the creation of over 10,000 AI agent projects in recent years.
The foundation is the technological democratization of token launch platforms, the fuel is meme culture, and the AI agent craze serves as a powerful booster in the later stages. These factors collectively contributed to the number of new tokens in the crypto market reaching a new high in January 2025.
However, in this cycle, many tokens have very short lifespans, with most tokens going to zero in a short time, leading to severe dilution of market liquidity, and the traditional "altcoin season" has been delayed or fragmented.
5. Number of Primary Market Investors
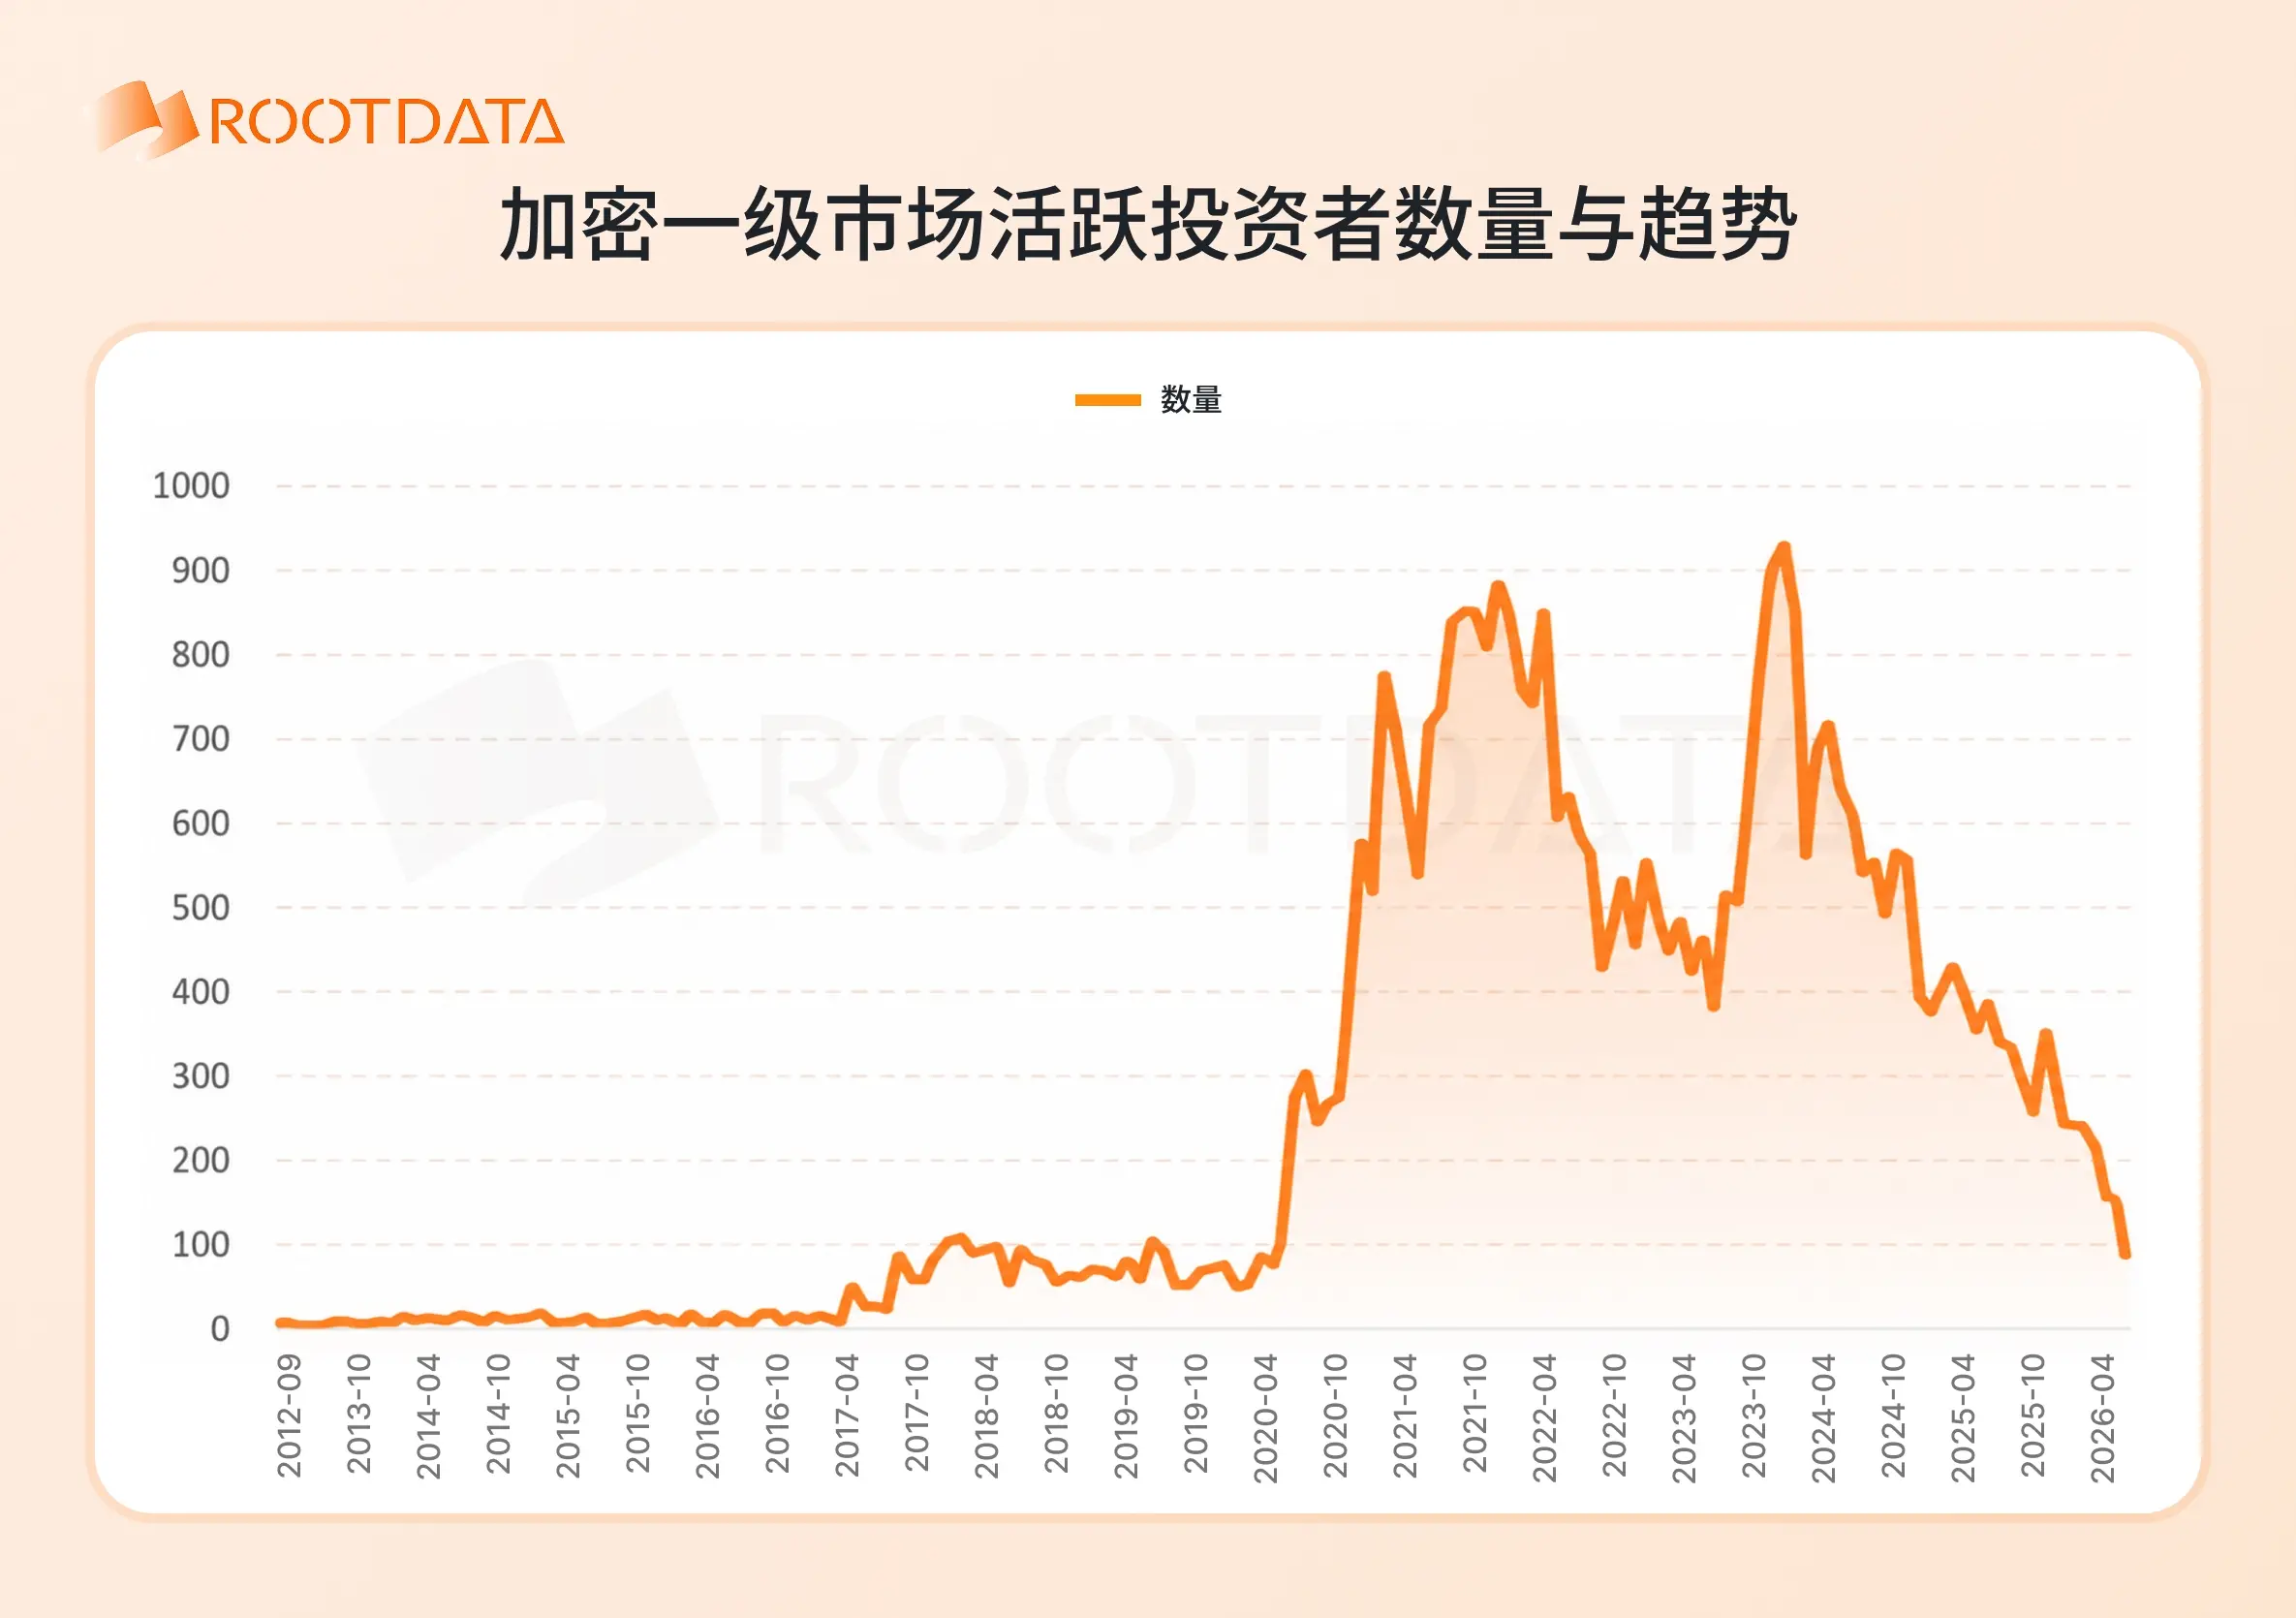
According to RootData, nearly 7,000 projects, VCs, or individuals have participated in primary market financing rounds, with the number of VCs being 2,617 and the number of individuals nearing 3,000.
Although all of these are closely related to the state of the crypto primary market, unlike the trends in financing amounts and quantities, this chart has not seen a significant decline since 2021, but rather experienced a peak in April 2024, with the cumulative number of participating investors exceeding 900, setting a historical record.
This is mainly due to changes in the structure of investor themes. In 2021-2022, the main participants in the crypto financing market were VCs, with many second and third-tier VCs heavily investing in altcoin projects, averaging over 20 investments per month at one point. Similarly, many projects' financing rounds often featured 20-40 VC names to showcase their popularity.
However, during the bear market of 2022-2023, many VCs were eliminated from the market, and angel investors, primarily consisting of entrepreneurs and KOLs, began to become one of the most active subjects in the primary market. Many projects' financing press releases began to feature dozens of angel investors' names, with the highest record exceeding 100.
But as the number of financing events continues to decline and investor returns are too poor, the presence of angel investors is also starting to fade from the investor lists of most projects. This month, the list of investors with investment records has only about 100 names, setting a new low since July 2020.
6. Number of New Ecosystem Projects
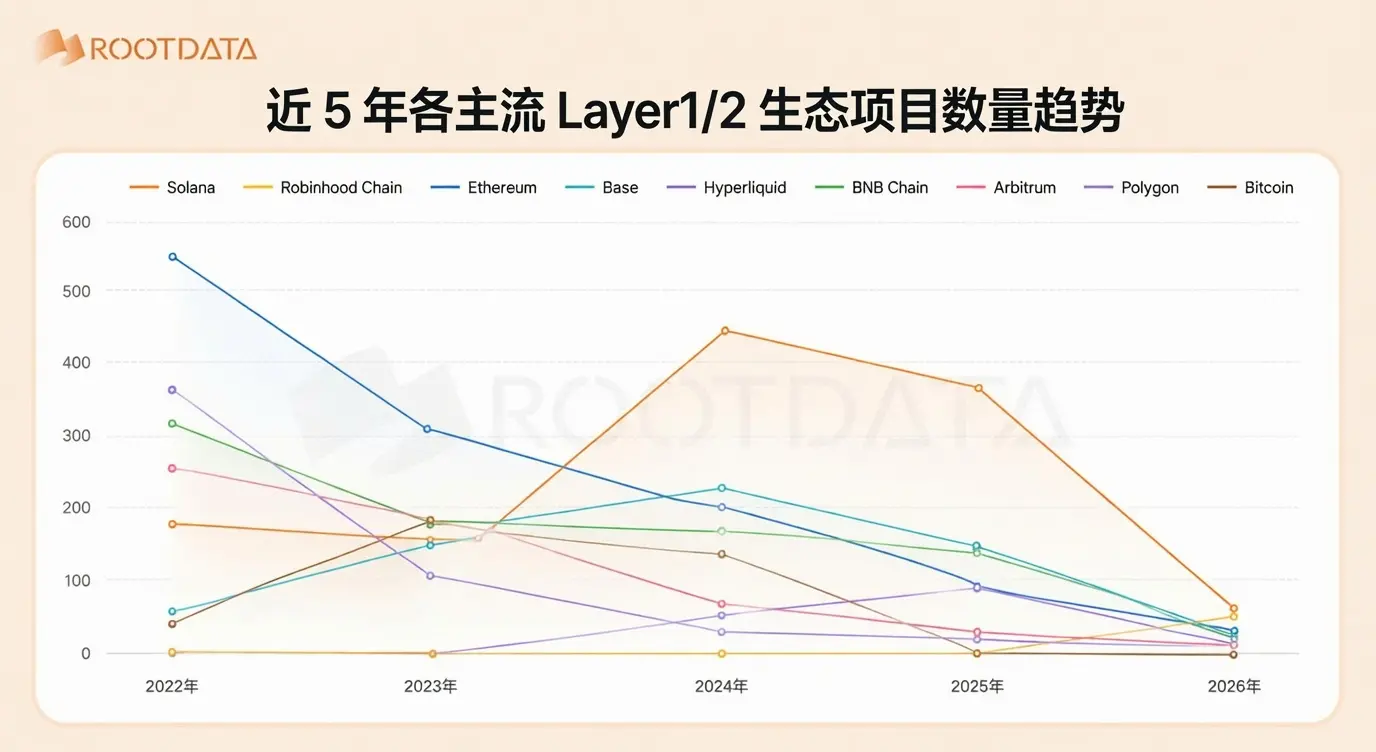
New ecosystem projects from various Layer 1/2 have long been a major source of new projects in the crypto industry, with many Layer 1/2 hosting various hackathons and incubation programs to enhance their ecosystem activity.
For a long time, Ethereum and its Layer 2 solutions held a dominant advantage in the number of new projects, sweeping the top four spots in 2022. However, since 2024, Solana has become a major destination for new projects amid its DeFi and meme craze. Meanwhile, Hyperliquid, Arc, and Robinhood Chain have become some of the few new Layer 1/2 projects to make the list in the past two years, further squeezing the market space of the Ethereum ecosystem.
In the first seven months of this year, the new ecosystem projects recorded by RootData across various Layer 1/2 have all shown significant declines, with the current top 8 Layer 1/2 being Solana (59), Robinhood Chain (42), Ethereum (36), Base (30), Hyperliquid (19), BNB Chain, Arbitrum, Polygon, Arc, and Sui.
 Risk warning Risk warning