ARK Invest Q3 DeFi Report: Tokenized stock trading volume reached 50 billion USD, driving a gradual recovery in on-chain transactions
 Core Viewpoint


 On-chain transactions and lending are gradually recovering, and application revenue continues to be higher than the underlying network, but both revenues are still significantly lower than the same period last year.
Original: ARK Invest
Compiled by: Jiahua, ChainCatcher
Market Overview
Tokenized Stocks Become the Main Driver of On-Chain Trading Activity
Stablecoins, RWA, and Tokenization
Adjusted stablecoin trading volume increased by approximately 16% month-on-month, reaching about $781 billion; the average monthly active address count grew by about 39%, reaching approximately 73 million. Meanwhile, the total supply of stablecoins decreased by about 3%, to approximately $309 billion.
The market capitalization of real-world assets (RWA) increased by about 19% month-on-month, reaching approximately $39 billion. Year-to-date, the scale of RWA on BNB Chain, Solana, and Stellar has expanded to about three times its original size.
Decentralized Exchanges and Market Focus
Spot DEX trading volume increased by about 13% month-on-month, reaching approximately $571 billion, marking the first growth in nearly four quarters. The ratio of spot trading volume between DEX and centralized exchanges (CEX) rebounded from about 20.3% to about 23.3%.
BNB Chain and Robinhood Chain lead in tokenized stock trading, with trading volumes of approximately $16.5 billion and $13.7 billion, respectively. Nvidia (NVDA) and SPDR S&P 500 ETF Trust (SPY) are the most actively traded assets, with trading volumes of approximately $3.1 billion and $2.5 billion, respectively.
Lending Protocols
Deposits in lending protocols increased by about 51% month-on-month, reaching approximately $81 billion. Morpho's deposit share rose to about 19%, setting a new high since its inception.
The scale of outstanding loans increased by about 41% month-on-month, reaching approximately $29 billion. Year-to-date, the fastest-growing loans are from Maple Finance, Spark, and Morpho, with increases of approximately 116%, 107%, and 79%, respectively.
ARK Core Views
Tokenized stocks became an important on-chain market this quarter. The spot DEX trading volume for tokenized stocks grew by about 9 times, reaching approximately $50 billion, accounting for about 9% of total spot DEX trading volume, up from about 1% in the second quarter. This trading activity also drove growth in stablecoin address counts and application revenues.
Robinhood Chain demonstrated how quickly a brokerage channel can kickstart a new network. In its first quarter of operation, its DEX trading volume reached approximately $65 billion, with network revenue of about $51 million, which is close to BNB Chain. However, recent adjustments to the gas mechanism are expected to cause its revenue to decline from current levels.
The open interest value for perpetual contract traders expanded, but trading activity decreased. The open interest value for perpetual contract DEX grew by about 76%, reaching approximately $24 billion, while trading volume decreased by about 16%; the ratio of futures trading volume between DEX and CEX fell to about 11.7%. This change indicates that traders tend to hold fewer, larger, and longer-term positions, primarily driven by Hyperliquid and its HIP-3 market.
01 Stablecoins, RWA, and Tokenization
Despite Token Price Rebound, Stablecoin Supply Still Slightly Decreases
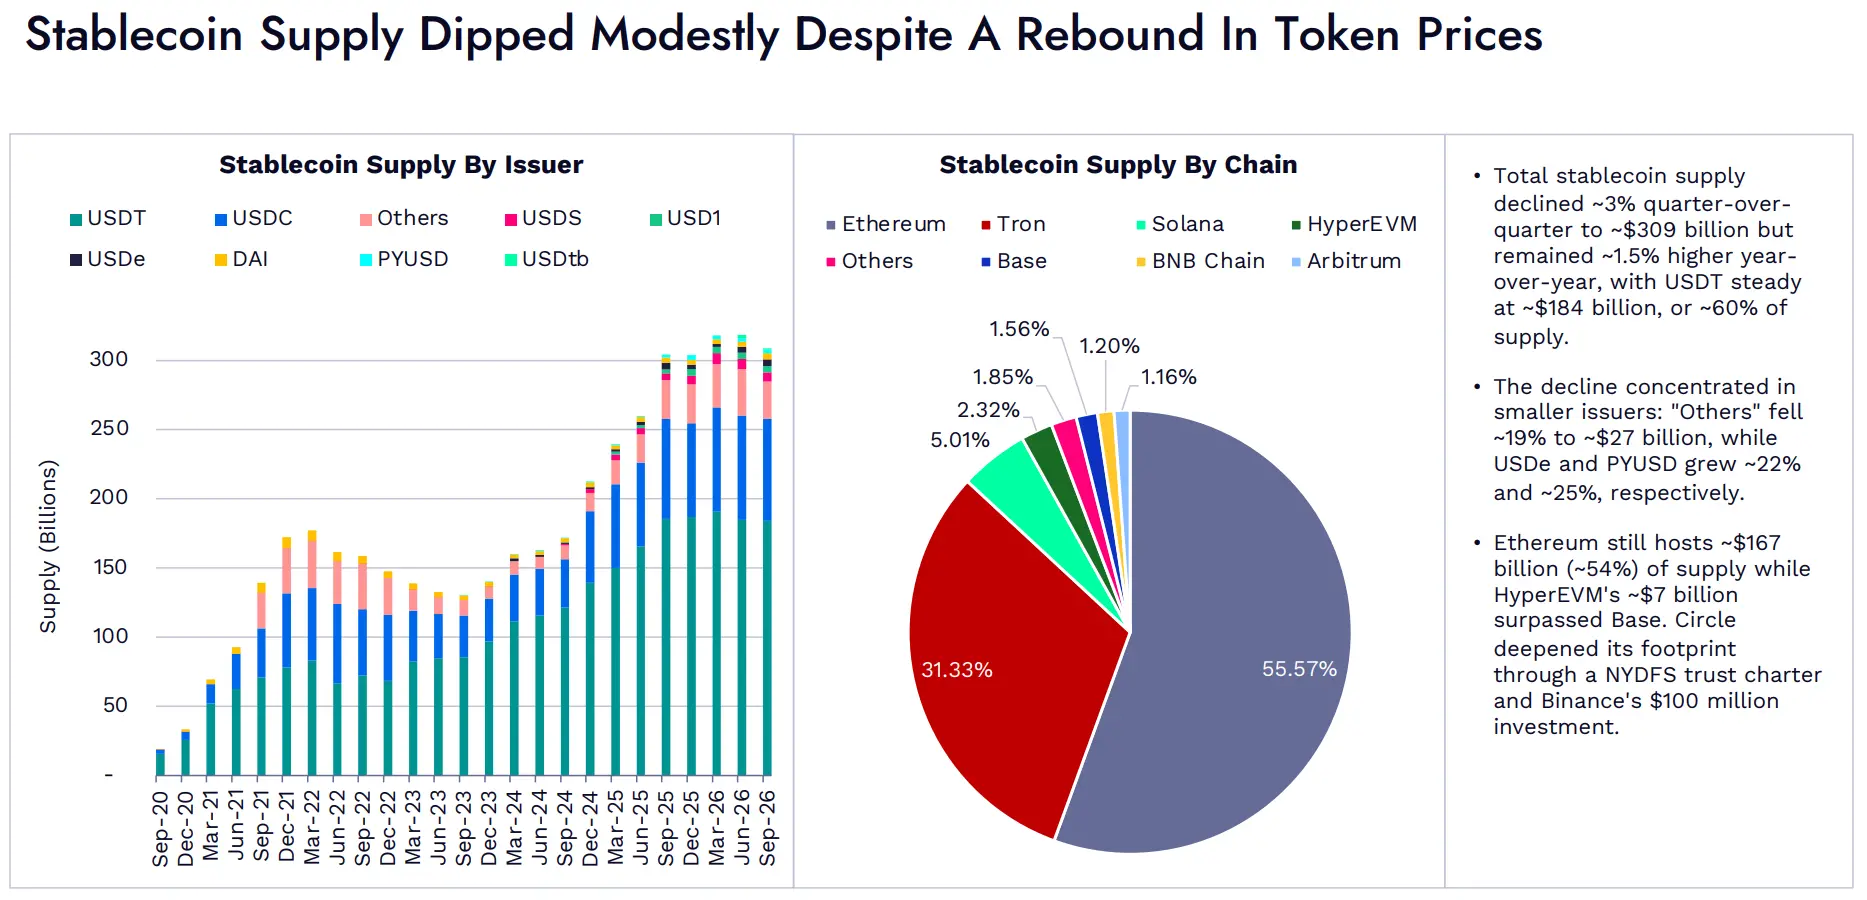
Image: Stablecoin supply categorized by issuer. Stablecoin supply categorized by chain.
The total supply of stablecoins decreased by about 3% month-on-month, to approximately $309 billion, but is still about 1.5% higher than the same period last year. The supply of USDT remained stable at about $184 billion, accounting for about 60% of the total supply.
The decline in supply is mainly concentrated among smaller issuers. The "Other" category decreased by about 19%, to approximately $27 billion; USDe and PYUSD grew by approximately 22% and 25%, respectively.
Ethereum still hosts about $167 billion in stablecoins, accounting for about 54% of the total supply. The stablecoin supply on HyperEVM reached about $7 billion, surpassing Base. Circle further expanded its business layout by obtaining a trust license from the New York State Department of Financial Services (NYDFS) and a $100 million investment from Binance.
Stablecoin Usage Continues to Increase, Adjusted Trading Volume and Active Address Count Grow in Sync
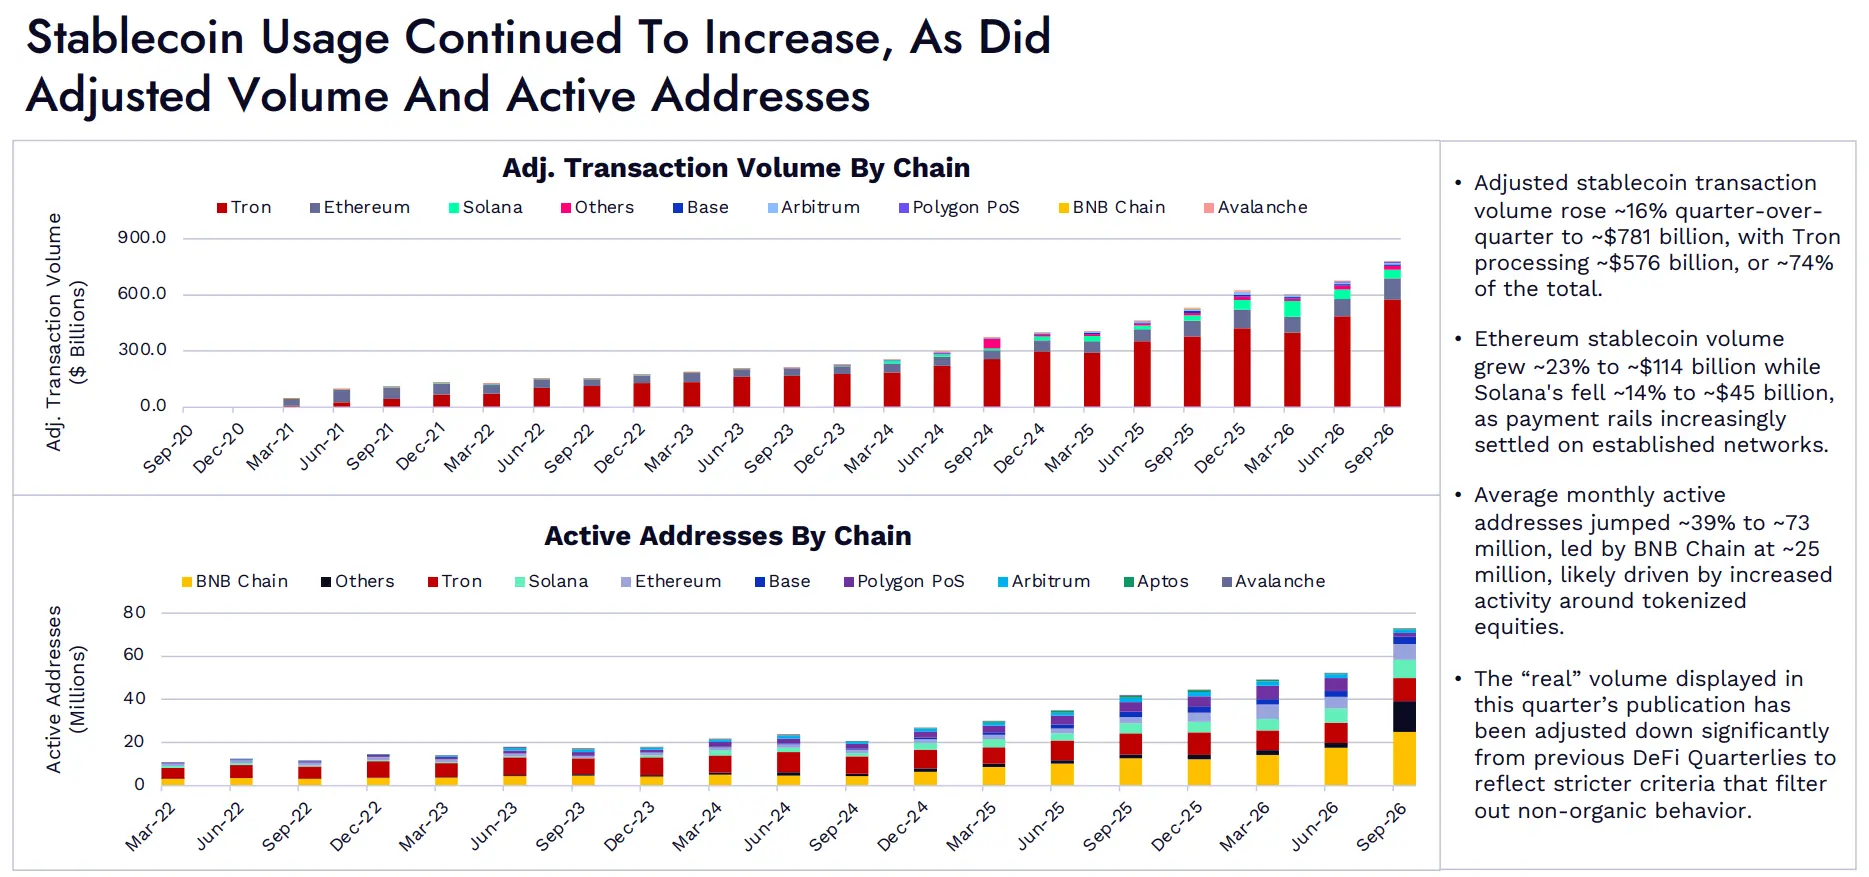
Image: Adjusted stablecoin trading volume across various blockchains. Active address count for stablecoins across various blockchains.
Adjusted stablecoin trading volume increased by about 16% month-on-month, reaching approximately $781 billion. Among them, Tron processed about $576 billion, accounting for about 74% of the total.
Stablecoin trading volume on Ethereum grew by about 23%, reaching approximately $114 billion; Solana, on the other hand, decreased by about 14%, to approximately $45 billion. Payment settlement activities are increasingly concentrated in mature networks.
The average monthly active address count grew by about 39%, reaching approximately 73 million. BNB Chain leads with about 25 million addresses, which may be related to increased activities surrounding tokenized stocks.
The "real" trading volume reported this quarter shows a significant downward adjustment compared to previous DeFi quarterly reports. This is because we adopted stricter standards to filter out non-natural trading behaviors.
Emerging Markets Continue to Dominate Real Stablecoin Transactions on Tron, USDT Turnover Accelerates
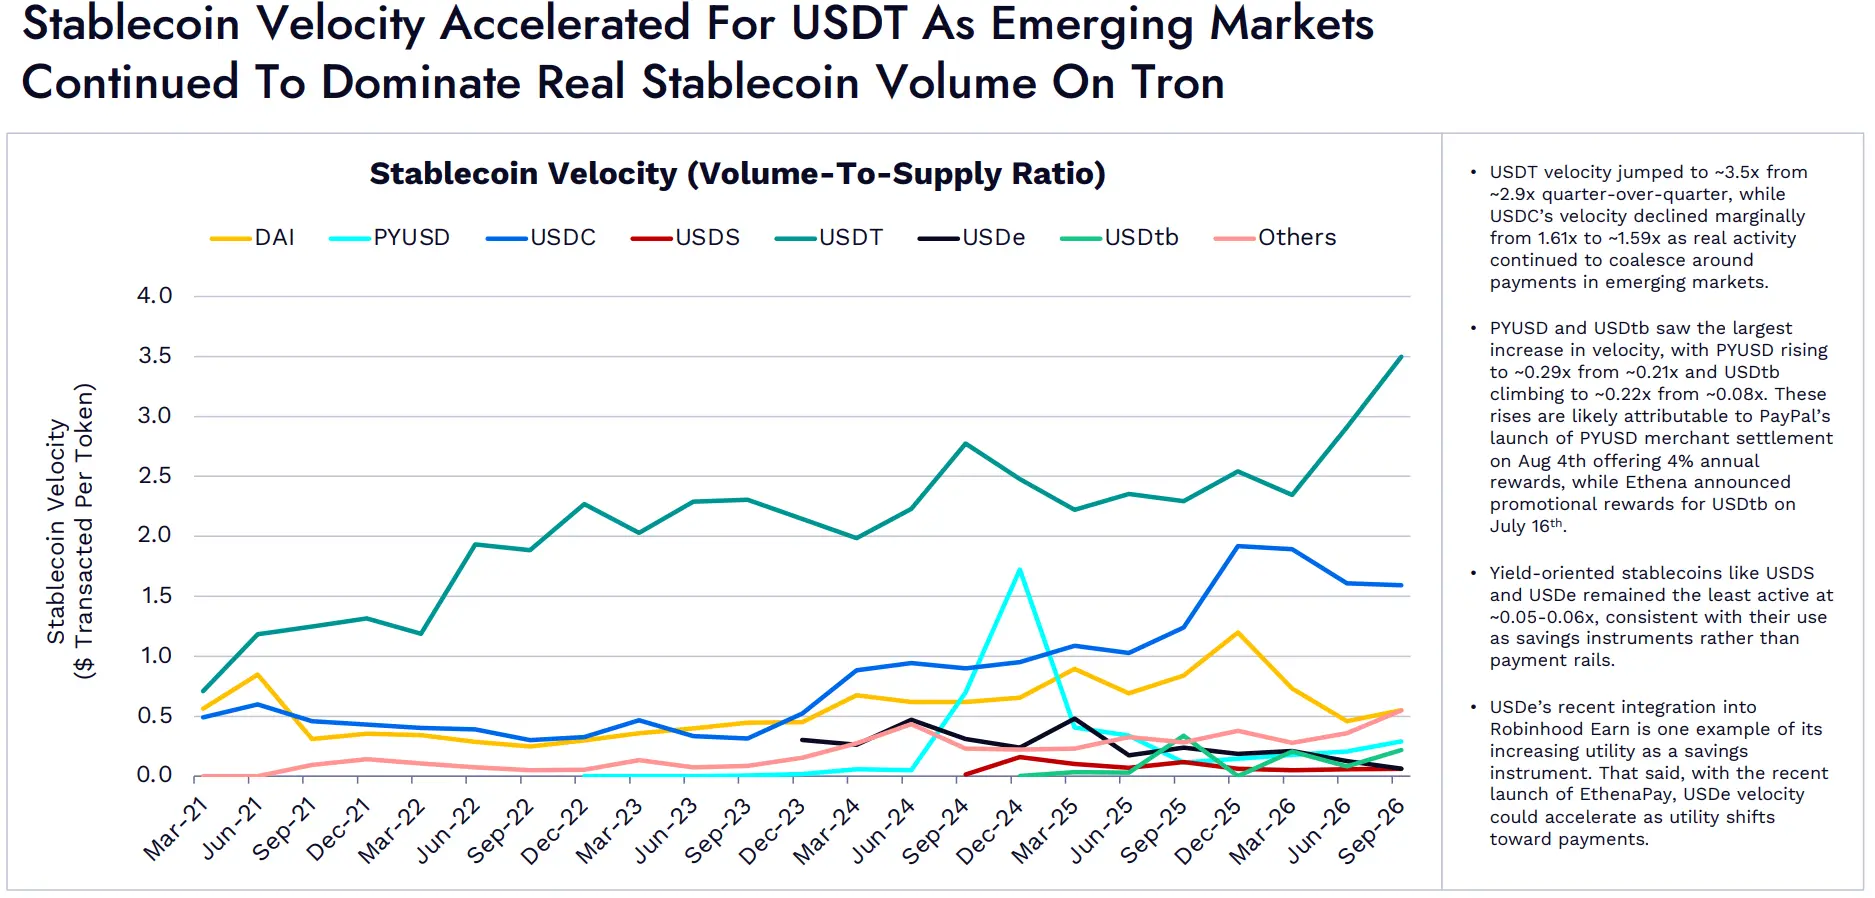
Image: Stablecoin turnover rate, i.e., the ratio of trading volume to supply.
The turnover rate of USDT increased from about 2.9 times in the previous quarter to about 3.5 times; the turnover rate of USDC slightly decreased from 1.61 times to about 1.59 times. Real usage activities continue to concentrate on payment scenarios in emerging markets.
PYUSD and USDtb saw the largest increases in turnover rates. PYUSD rose from about 0.21 times to about 0.29 times, while USDtb increased from about 0.08 times to about 0.22 times. These increases may be related to two initiatives: PayPal launched PYUSD merchant settlement services on August 4, offering a 4% annualized reward; Ethena announced USDtb promotional rewards on July 16.
Stablecoins like USDS and USDe, which are more focused on earning yields, remain the least active, with turnover rates of about 0.05 to 0.06 times. This aligns with their primary use as savings tools rather than payment channels.
USDe recently integrated with Robinhood Earn, reflecting its expanding use as a savings tool. However, with the recent launch of EthenaPay, if USDe's usage shifts more towards payments, its turnover rate may also accelerate.
Tokenized Stocks and Active Investment Strategies Drive RWA Growth, Tokenized Government Bonds Stabilize
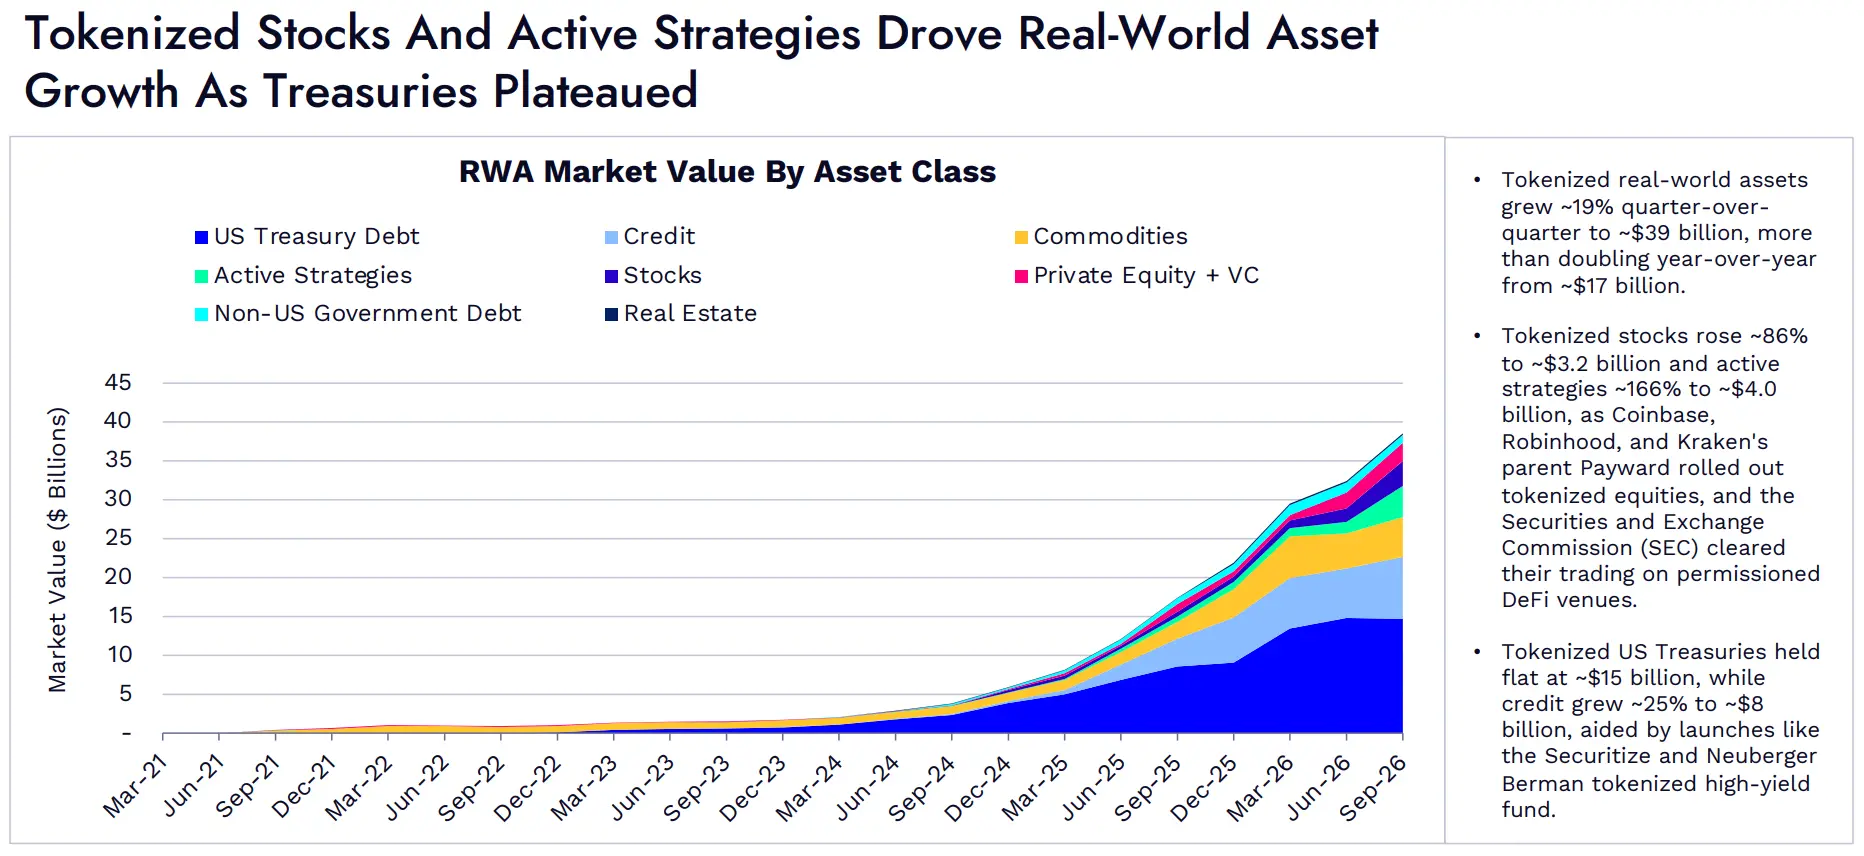
Image: RWA market capitalization categorized by asset class. Categories include U.S. Treasury bonds, credit, commodities, active investment strategies, stocks, private equity and venture capital, non-U.S. government debt, and real estate.
The scale of tokenized real-world assets grew by about 19% month-on-month, reaching approximately $39 billion, more than doubling from about $17 billion in the same period last year.
The scale of tokenized stocks grew by about 86%, reaching approximately $3.2 billion; the scale of active investment strategies grew by about 166%, reaching approximately $4 billion. During the same period, Coinbase, Robinhood, and Kraken's parent company Payward successively launched tokenized stocks, and the U.S. Securities and Exchange Commission (SEC) also allowed these assets to be traded on DeFi platforms requiring access licenses.
The scale of tokenized U.S. Treasury bonds remained stable at about $15 billion; credit assets grew by about 25%, reaching approximately $8 billion. Institutions like Securitize and Lendable launched tokenized high-yield funds to support growth.
Other Networks Grow Faster, Ethereum's RWA Market Capitalization Share Declines This Quarter
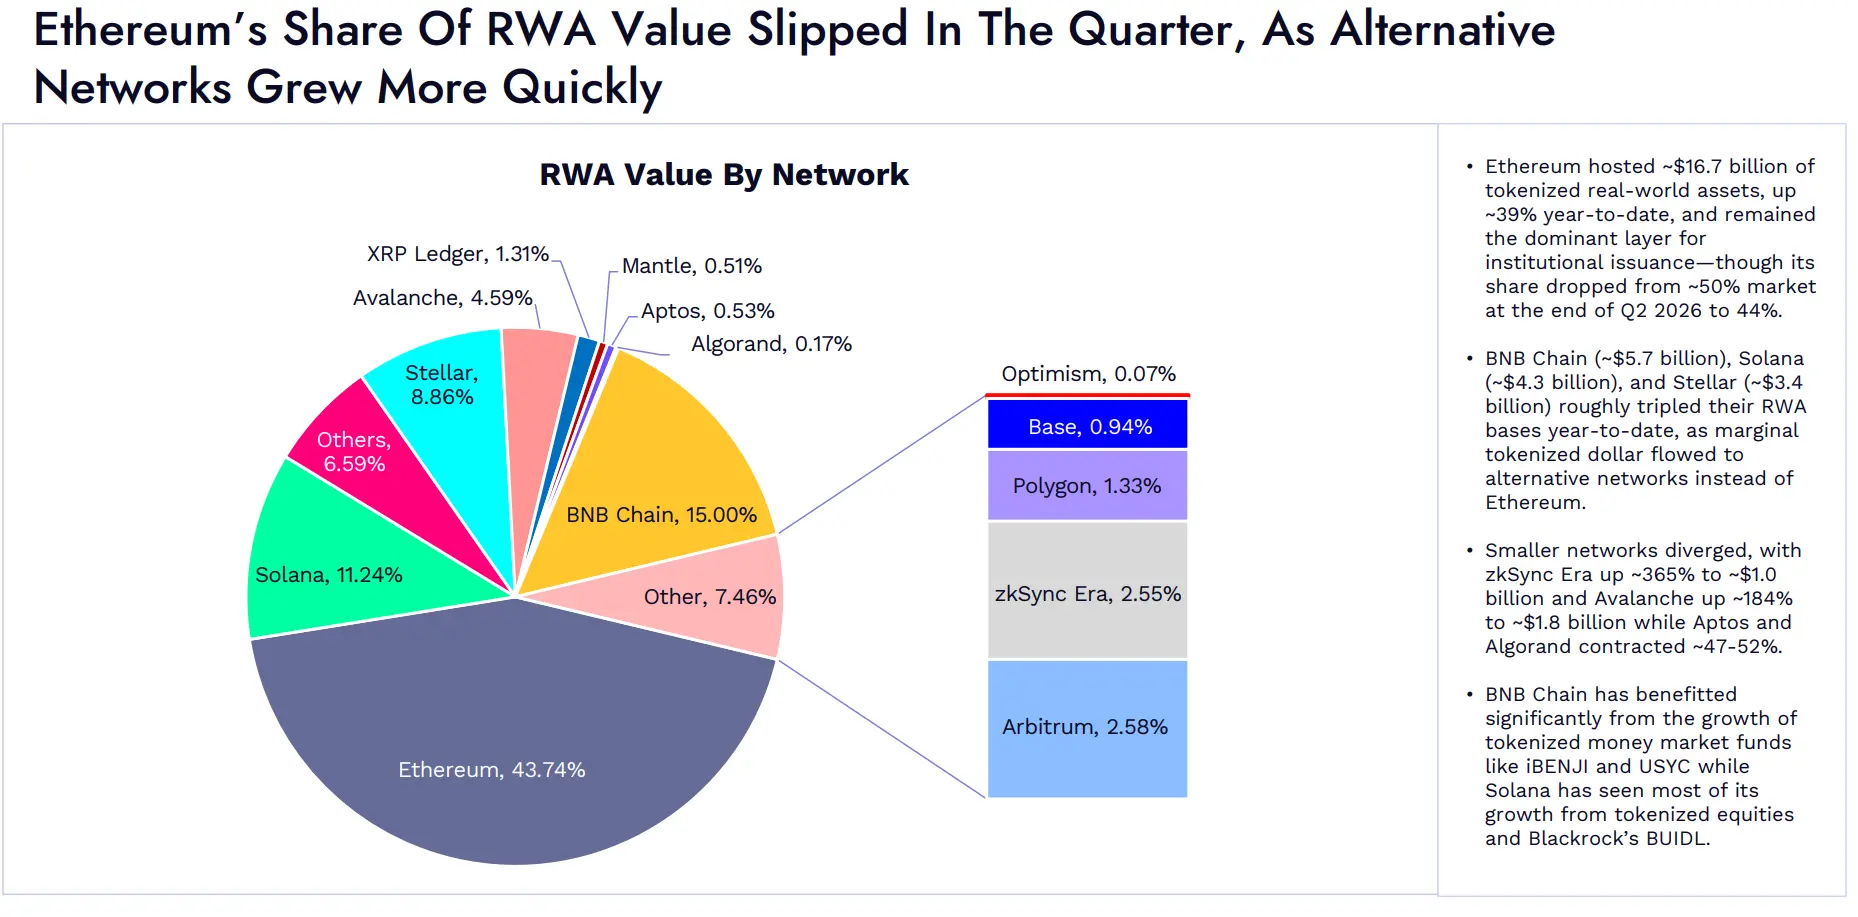
Image: RWA market capitalization distribution across various blockchains. Ethereum accounts for 43.74%, BNB Chain for 15.00%, Solana for 11.24%, and Stellar for 8.86%. The distribution of other networks and smaller networks is also shown in the image.
The tokenized real-world assets hosted on Ethereum amount to about $16.7 billion, growing by about 39% year-to-date, still making it the primary network for institutions issuing such assets. However, its market share declined from about 50% at the end of the second quarter of 2026 to 44%.
The RWA scale on BNB Chain, Solana, and Stellar is approximately $5.7 billion, $4.3 billion, and $3.4 billion, respectively, each expanding to about three times its original size year-to-date. Newly tokenized assets are increasingly flowing to networks outside of Ethereum.
The performance of smaller networks has diverged. zkSync Era grew by about 365%, reaching approximately $1 billion; Avalanche grew by about 184%, reaching approximately $1.8 billion; Aptos and Algorand decreased by about 47% to $520 million.
BNB Chain significantly benefited from the growth of tokenized money market funds like iBENJI and USYC; Solana's growth mainly came from tokenized stocks and BlackRock BUIDL.
02 Economic Performance of Networks and Applications
DeFi TVL Continues to Rebound from Second Quarter Low, Base and Tron Grow Against the Trend This Year
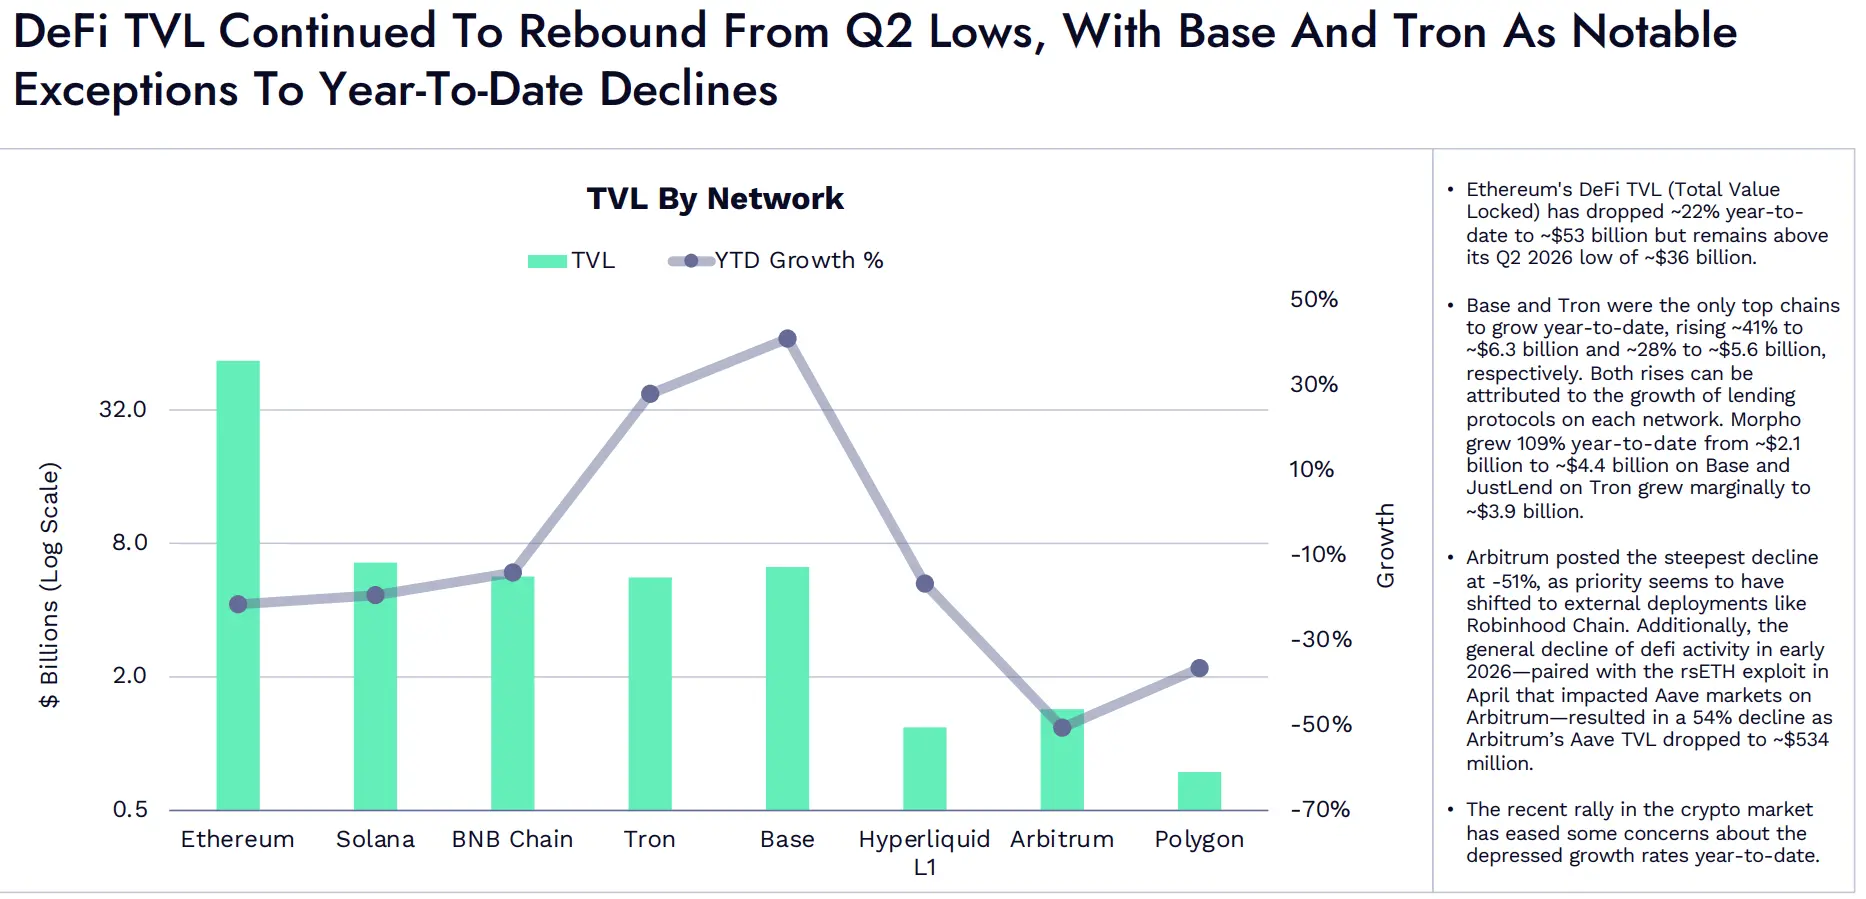
Image: Total locked value (TVL) across various networks and year-to-date growth.
The total locked value (TVL) in Ethereum DeFi has decreased by about 22% year-to-date, to approximately $53 billion, but remains above the low point of about $36 billion in the second quarter of 2026.
Among the major networks, only Base and Tron have achieved growth year-to-date, rising approximately 41% to about $6.3 billion and about 28% to approximately $5.6 billion, respectively. The growth of both can be attributed to the expansion of lending protocols on their respective networks. Morpho on Base has grown 109% year-to-date, increasing from about $2.1 billion to approximately $4.4 billion; JustLend on Tron has seen a slight increase to about $3.9 billion.
Arbitrum has experienced the largest decline, approximately 51%, with its development focus seemingly shifting towards external deployments like Robinhood Chain. Additionally, the overall decline in DeFi activity at the beginning of 2026, compounded by the impact of the April rsETH attack on the Aave market on Arbitrum, has led to a 54% drop in Aave's TVL on Arbitrum, down to about $534 million.
The recent rise in the crypto market has alleviated some concerns among market participants regarding weak growth year-to-date.
Solana's Recovery and Robinhood Chain Launch Drive Slight Increase in Network Revenue
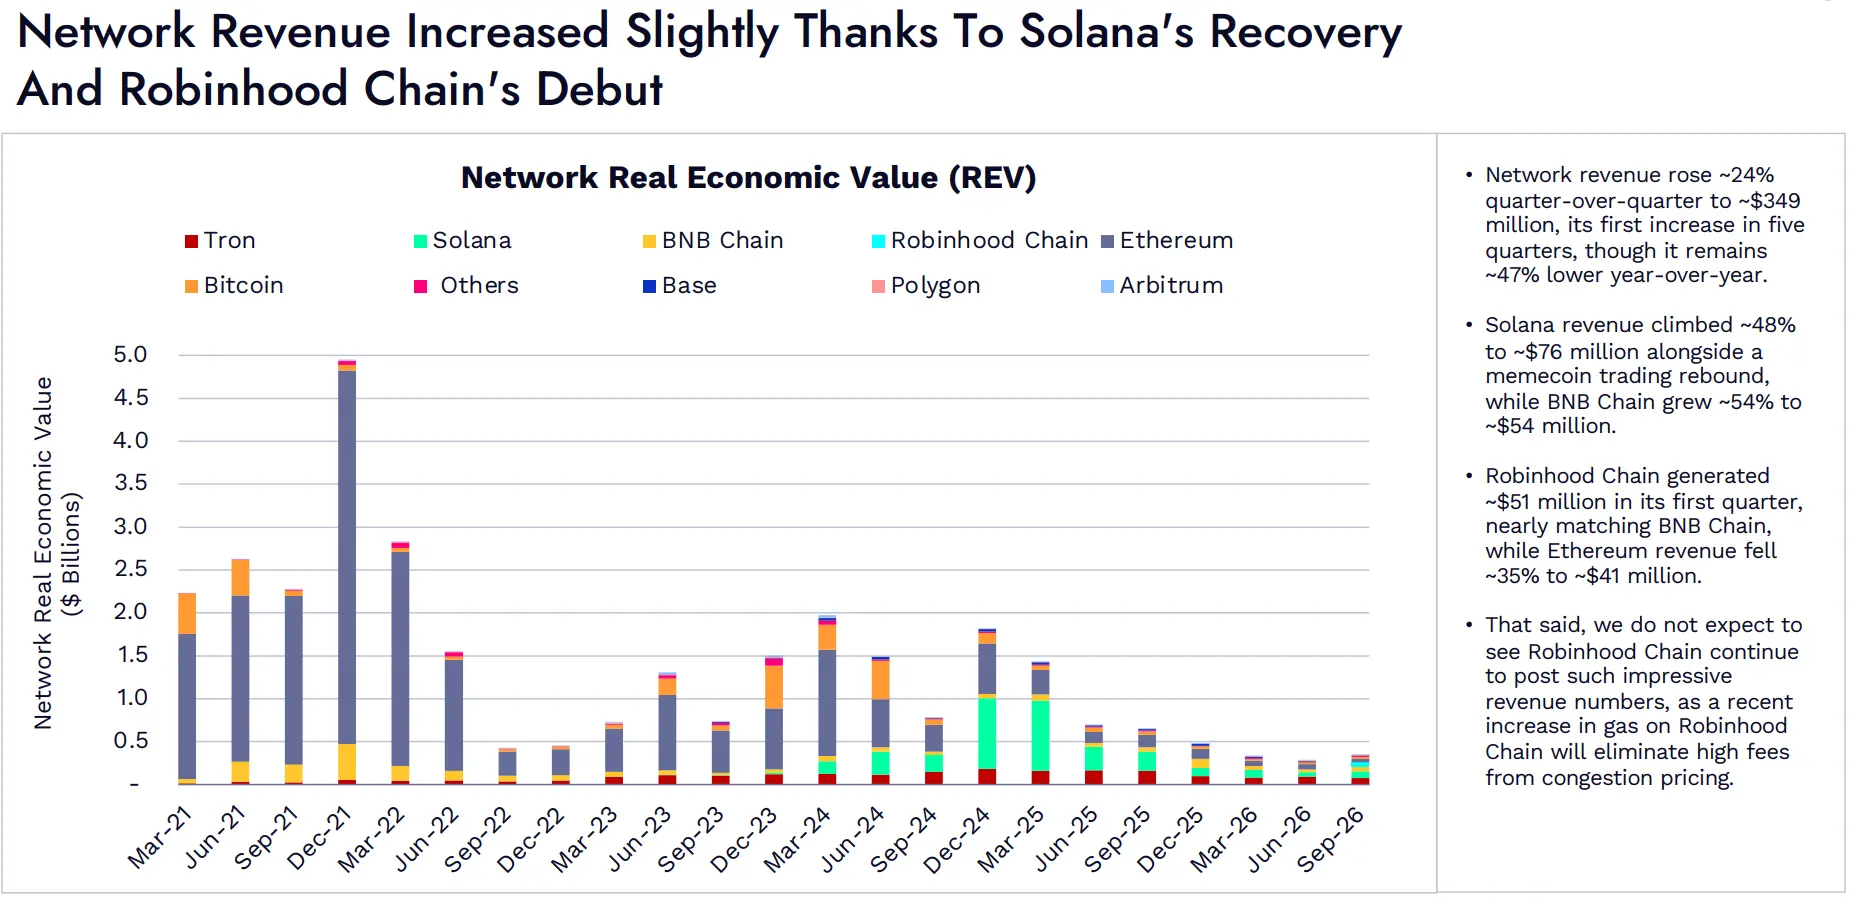
Image: Real Economic Value (REV) of the network.
Network revenue has increased approximately 24% quarter-over-quarter, reaching about $349 million, marking the first growth in nearly five quarters, but still about 47% lower than the same period last year.
With the resurgence of meme coin trading, Solana's revenue has grown approximately 48%, reaching about $76 million; BNB Chain has increased about 54%, reaching approximately $54 million.
Robinhood Chain generated about $51 million in revenue in its first quarter after launch, nearing BNB Chain; Ethereum's revenue, however, has decreased by about 35%, to approximately $41 million.
However, we expect Robinhood Chain to struggle to maintain such impressive revenue performance. After the network recently adjusted gas-related parameters, the high fees resulting from congestion pricing will be eliminated.
Trading Applications and Meme Coin Issuance Platforms Recover, Application Revenue Resumes Growth
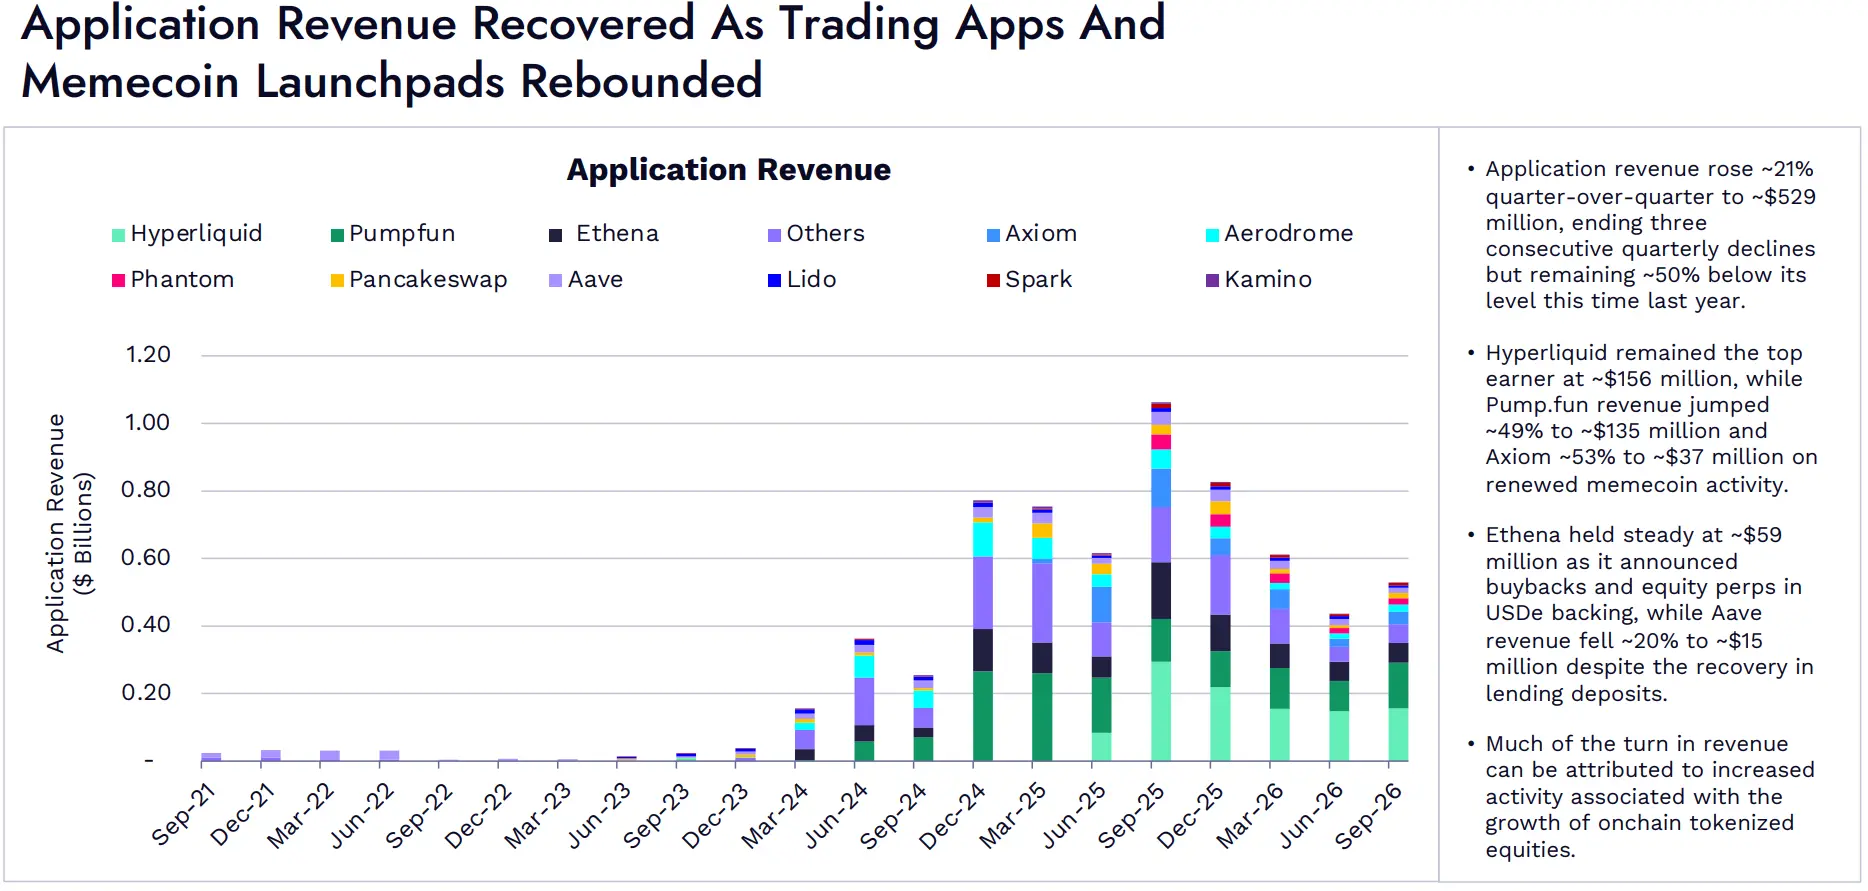
Image: Application Revenue.
Application revenue has increased approximately 21% quarter-over-quarter, reaching about $529 million, ending three consecutive quarters of decline, but still about 50% lower than the same period last year.
Hyperliquid continues to lead in revenue, at about $156 million. Driven by the resurgence of meme coin activity, Pump.fun's revenue has grown approximately 49%, reaching about $135 million; Axiom has increased about 53%, reaching approximately $37 million.
Ethena's revenue remains stable at about $59 million. The project has announced a buyback plan and introduced stock perpetual contracts into the asset-backed mechanism of USDe. Despite a rebound in lending deposits, Aave's revenue has still decreased by about 20%, to approximately $15 million.
The revenue rebound can largely be attributed to the increase in activity brought about by the growth of on-chain tokenized stocks.
Application Revenue Continues to Be About 1.5 Times the Underlying Network Revenue
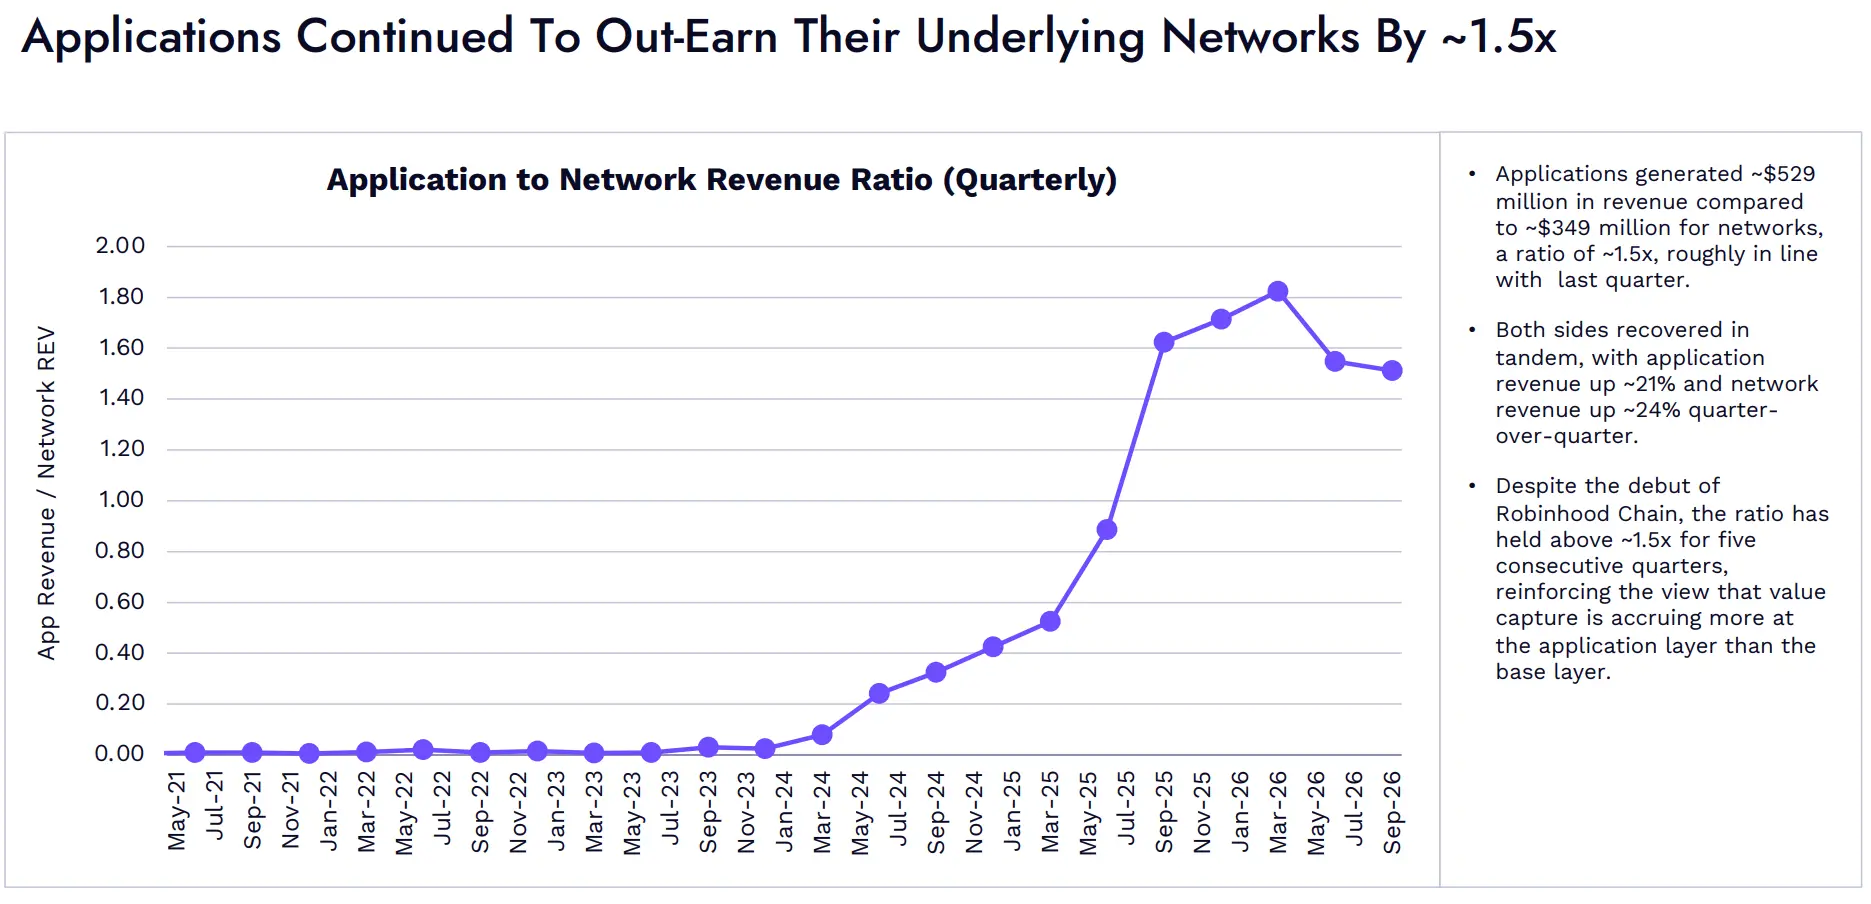
Image: Quarterly Ratio of Application Revenue to Network Revenue, calculated as Application Revenue divided by Network REV.
Applications generated about $529 million in revenue, while network revenue was approximately $349 million, resulting in a ratio of about 1.5 times, roughly equivalent to the previous quarter.
Both have rebounded simultaneously, with application revenue increasing approximately 21% quarter-over-quarter and network revenue growing about 24%.
Despite the launch of Robinhood Chain, this ratio has remained above approximately 1.5 times for five consecutive quarters. This further supports the judgment that more value is being captured by the application layer compared to the underlying network.
03 Decentralized Exchanges
Tokenized Assets and Meme Coins Drive Growth in Spot DEX Trading Volume
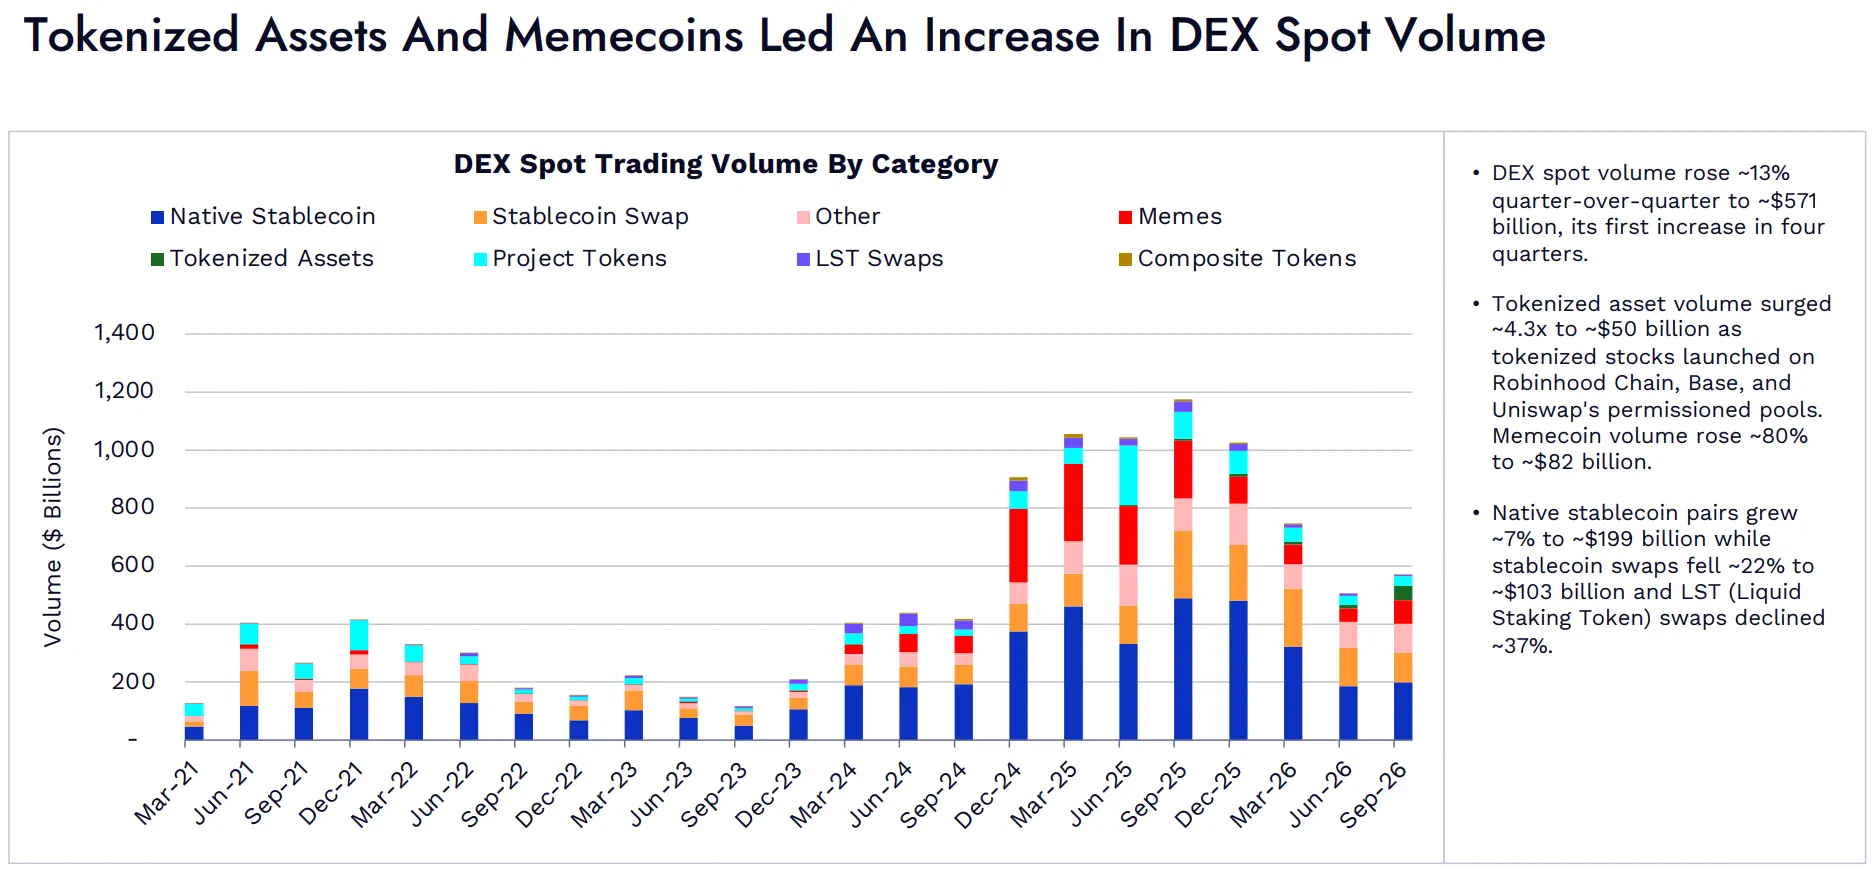
Image: Spot DEX Trading Volume by Transaction Type.
Spot DEX trading volume has increased approximately 13% quarter-over-quarter, reaching about $571 billion, marking the first growth in nearly four quarters.
With the launch of tokenized stocks on Robinhood Chain, Base, and Uniswap's permissioned pools, the trading volume of tokenized assets has grown approximately 4.3 times, reaching about $50 billion. Meme coin trading volume has increased by about 80%, reaching approximately $82 billion.
Trading volume for native tokens/stablecoin pairs has grown about 7%, reaching approximately $199 billion; stablecoin swap trading volume has decreased by about 22%, to approximately $103 billion; and liquid staking token (LST) swap trading volume has decreased by about 37%.
Solana and Robinhood Chain's DEX Market Share Increases, Uniswap Expands Lead
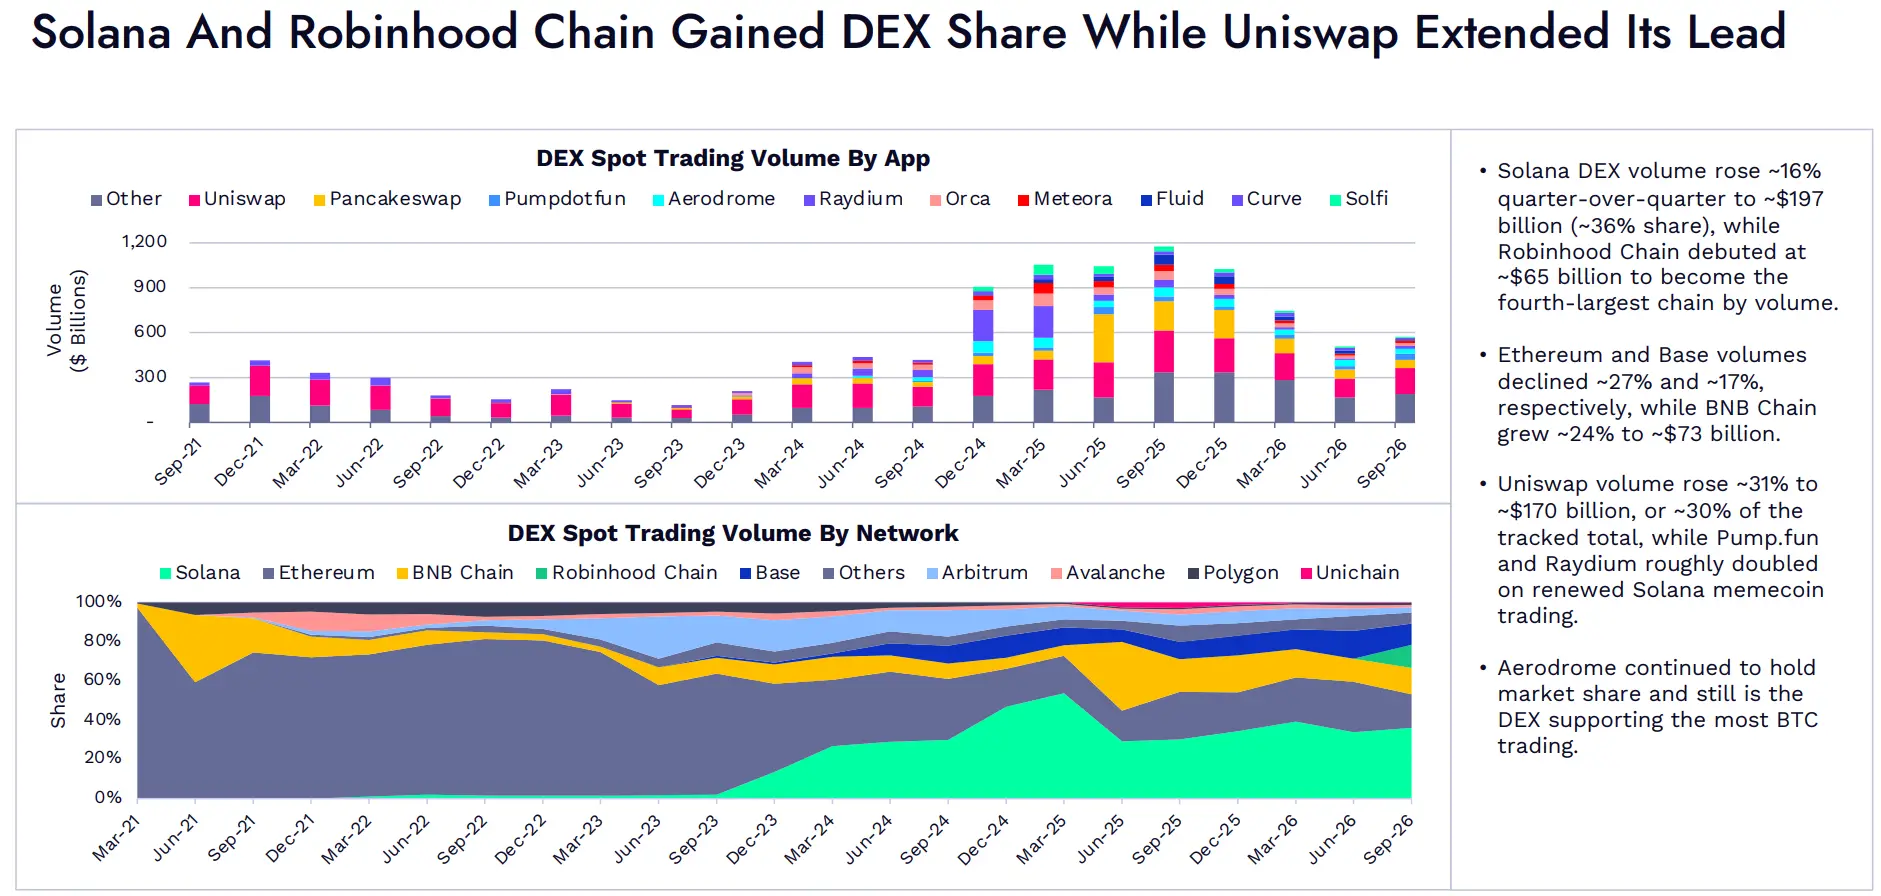
Image: Spot DEX Trading Volume by Application. Market Share of Spot DEX Trading Volume by Network.
Solana's DEX trading volume has increased approximately 16% quarter-over-quarter, reaching about $197 billion, accounting for about 36%. Robinhood Chain's trading volume in its first quarter reached about $65 billion, making it the fourth largest network by trading volume.
Trading volumes for Ethereum and Base have decreased by approximately 27% and 17%, respectively; BNB Chain has increased by about 24%, reaching approximately $73 billion.
Uniswap's trading volume has grown approximately 31%, reaching about $170 billion, accounting for about 30% of the total trading volume within the scope of the statistics. With the resurgence of meme coin trading on Solana, the trading volumes of Pump.fun and Raydium have both expanded to about twice their previous levels.
Aerodrome continues to maintain its market share, remaining the DEX with the most BTC transactions.
DEX's Relative Share in Spot Trading Recovers, Most Networks' Trading Volume/TVL Ratios Decline
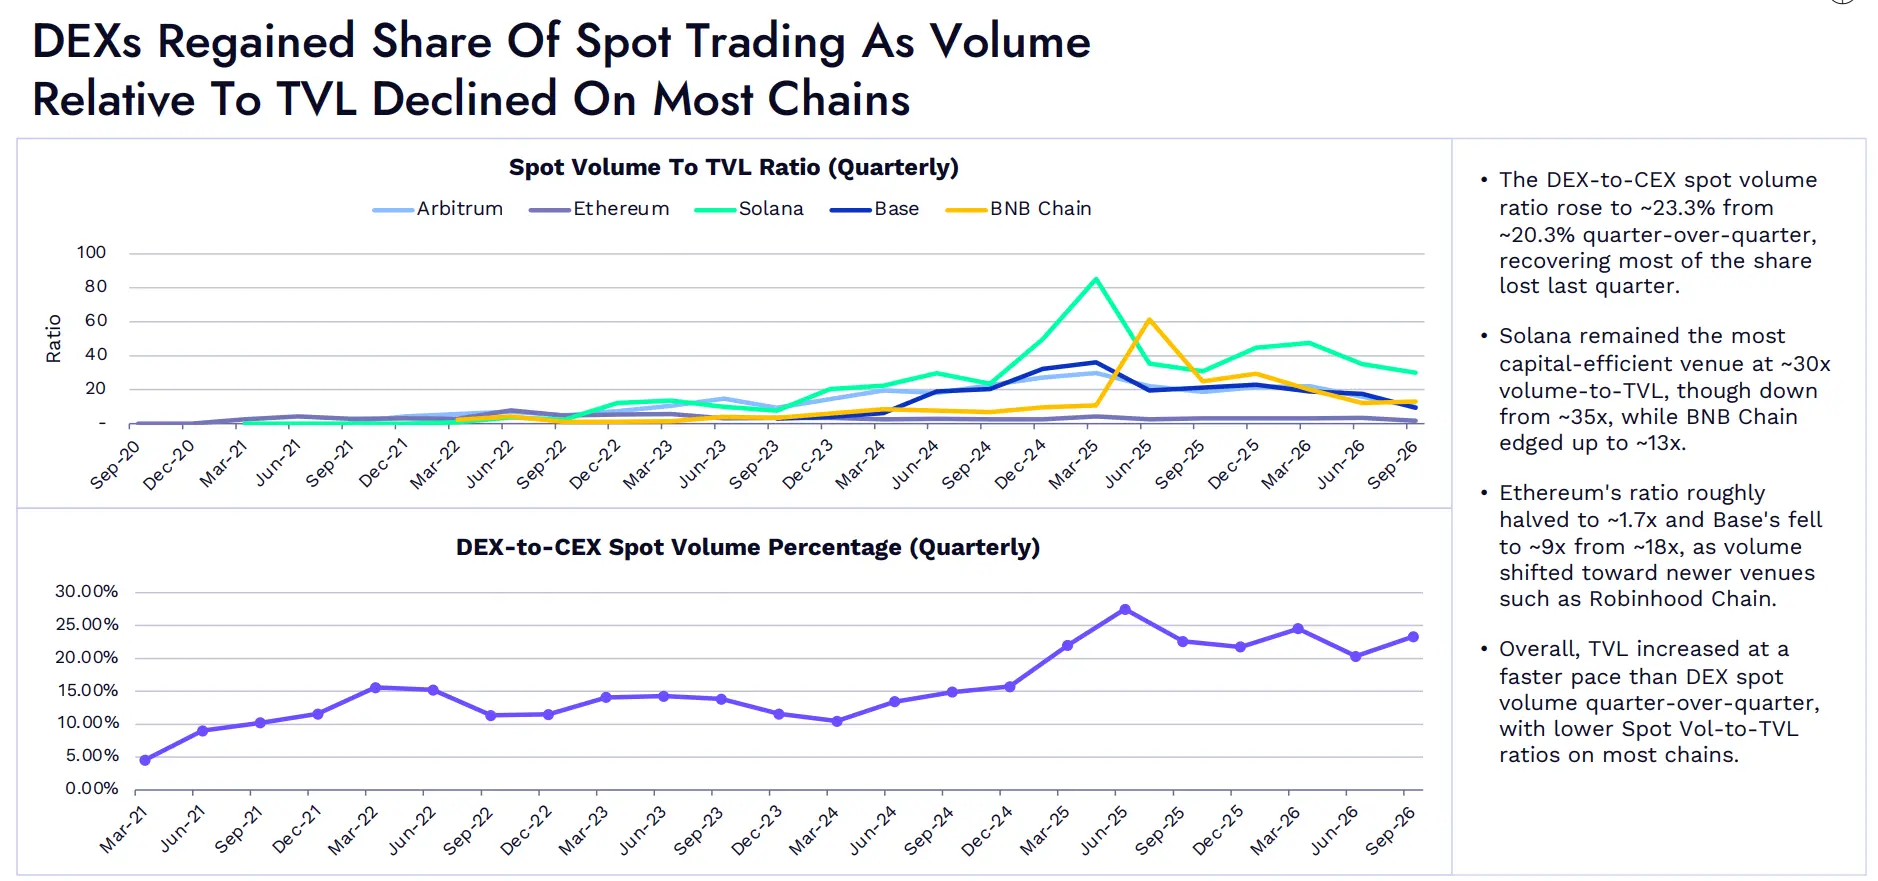
Image: Quarterly Ratio of Spot Trading Volume to TVL. Quarterly Ratio of DEX to CEX Spot Trading Volume.
The ratio of DEX to CEX spot trading volume has increased from approximately 20.3% in the previous quarter to about 23.3%, recovering most of the relative share lost in the previous quarter.
Solana remains the most efficient trading network in terms of capital utilization, with a trading volume/TVL ratio of about 30 times, although down from about 35 times previously. BNB Chain has slightly increased to about 13 times.
Ethereum's ratio has roughly halved, dropping to about 1.7 times; Base has decreased from about 18 times to about 9 times. Trading activity has shifted towards newer trading networks like Robinhood Chain.
Overall, the quarter-over-quarter growth of TVL has outpaced the spot DEX trading volume, leading to a decline in the spot trading volume/TVL ratio for most networks.
Perpetual Contract DEX Open Interest Increases Significantly, Trading Volume Cools
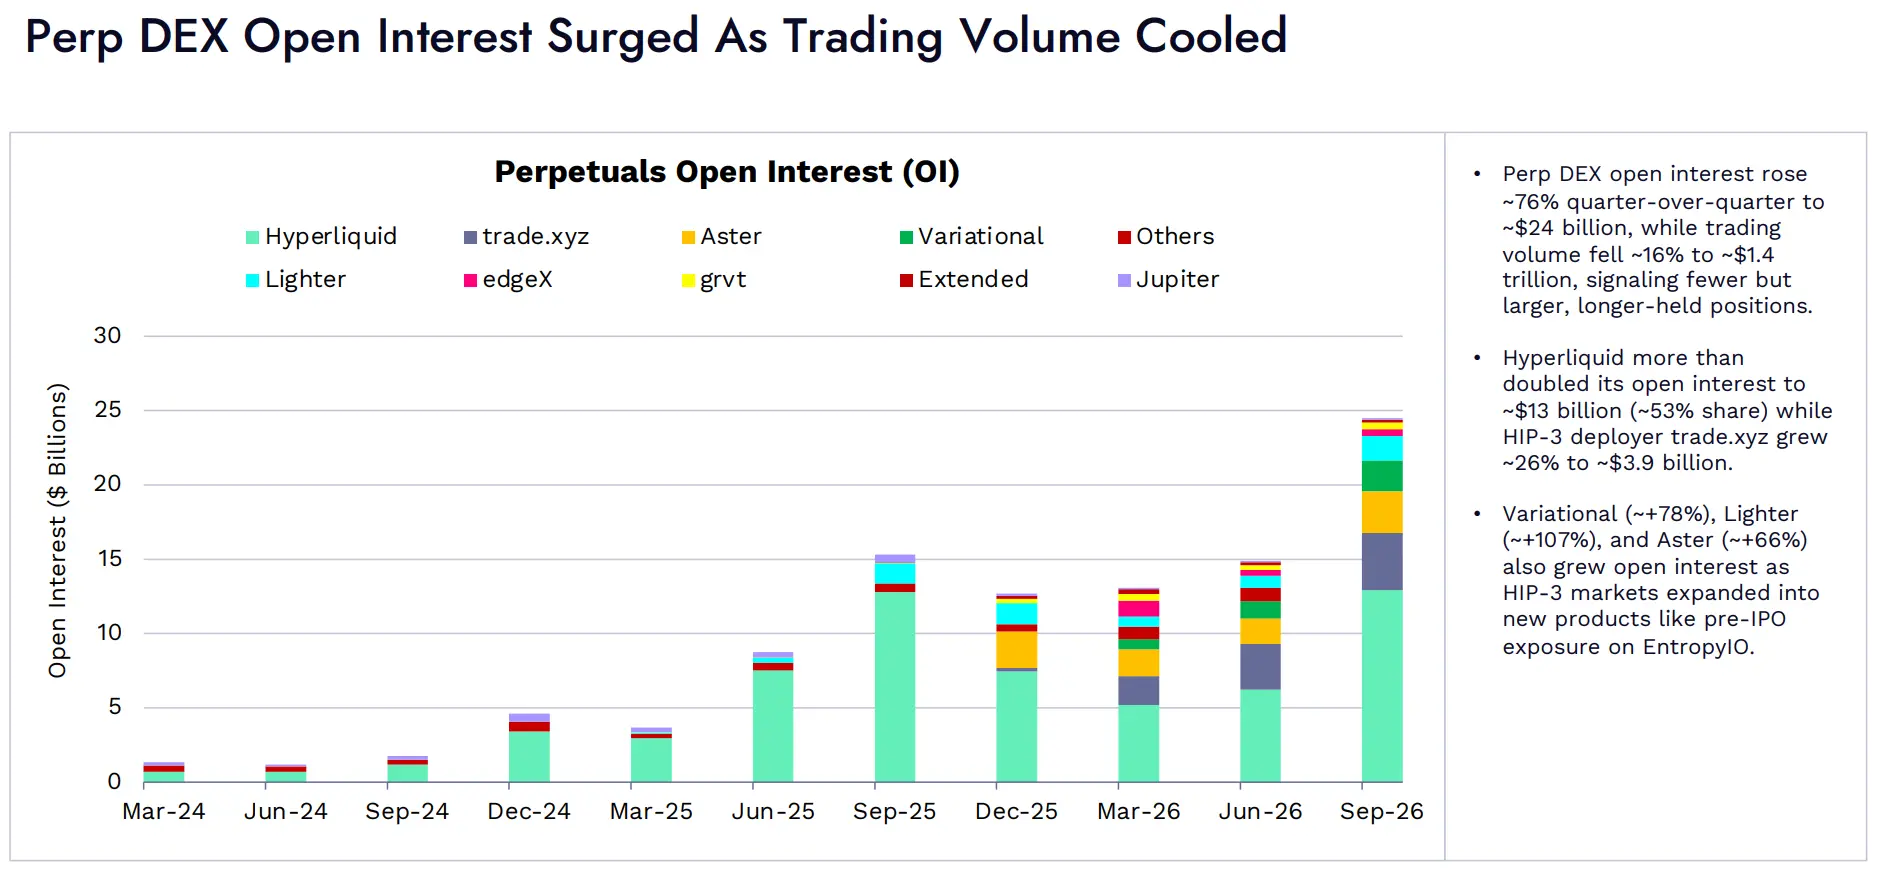
Image: Open Interest (OI) of Perpetual Contracts.
Open interest for perpetual contract DEX has increased approximately 76% quarter-over-quarter, reaching about $24 billion; however, trading volume has decreased by about 16%, to approximately $1.4 trillion. This indicates that traders are inclined to hold fewer, larger, and longer-term positions.
Hyperliquid's open interest has more than doubled, reaching about $13 billion, accounting for about 53%. The market deployer of HIP-3, trade.xyz, has grown approximately 26%, reaching about $3.9 billion.
The open interest of Variational, Lighter, and Aster has also increased by approximately 78%, 107%, and 66%, respectively. Meanwhile, the HIP-3 market has expanded to new products, such as pre-IPO asset exposure offered on EntropyIO.
DEX's Futures Trading Volume Ratio Relative to CEX Continues to Decline This Quarter
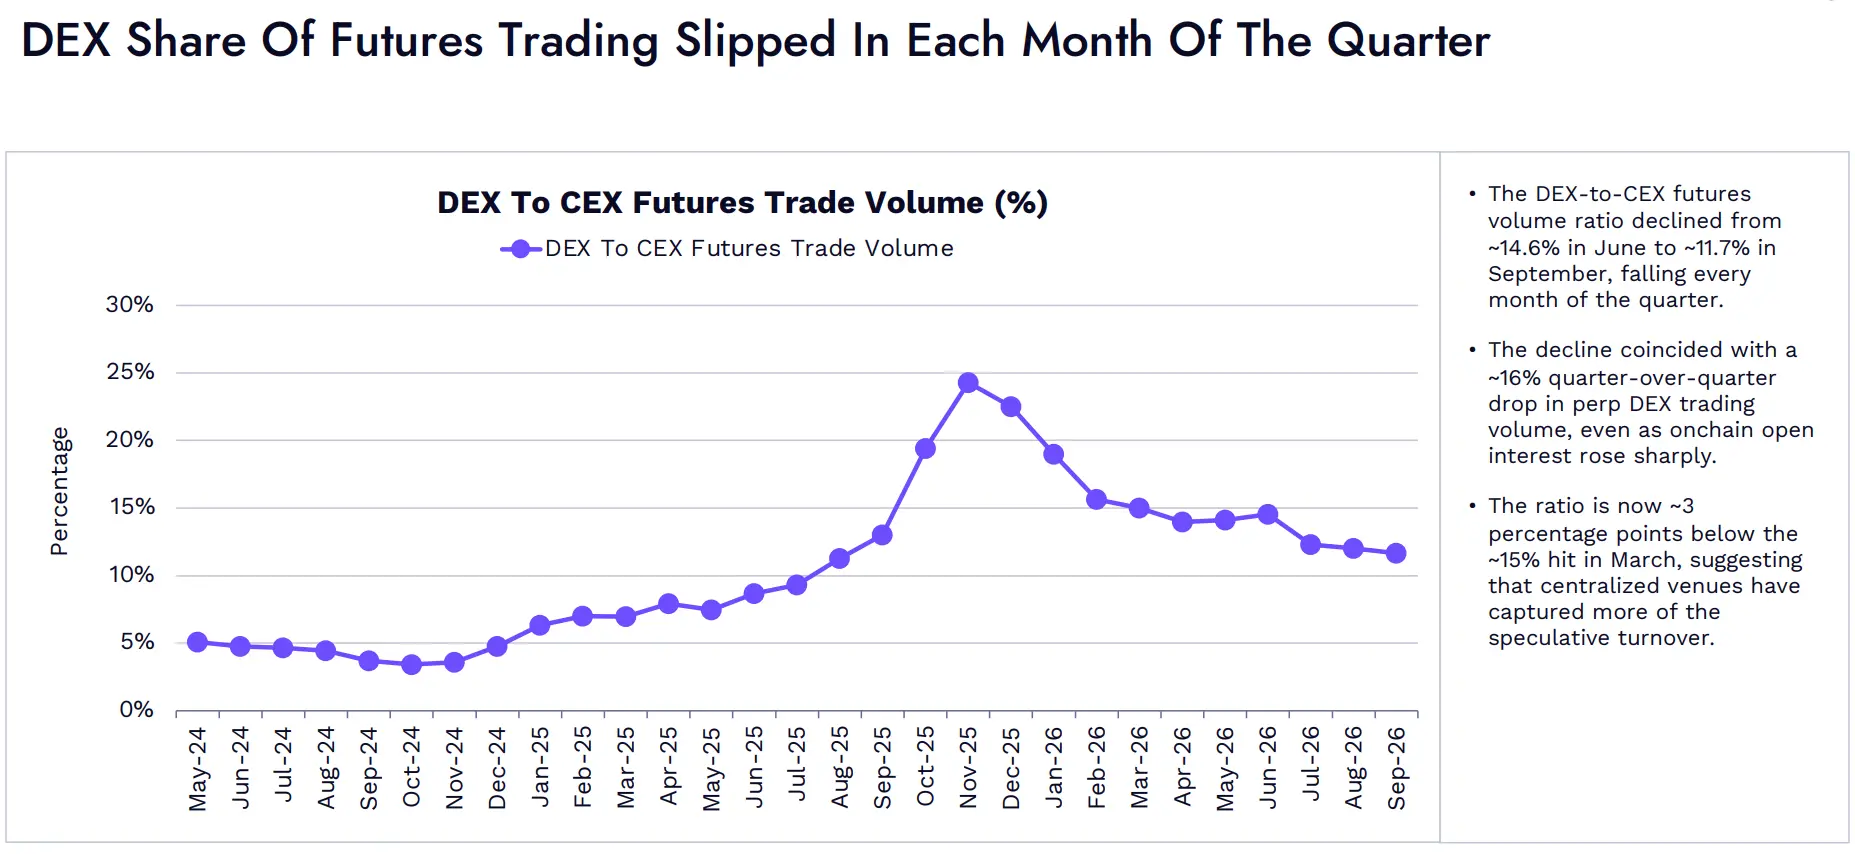
Image: Futures Trading Volume Ratio of DEX to CEX.
The ratio of DEX to CEX futures trading volume has decreased from about 14.6% in June to about 11.7% in September, declining every month this quarter.
During the same period, perpetual contract DEX trading volume has decreased by about 16%, despite a significant increase in on-chain open interest.
The current ratio is about 3 percentage points lower than the approximately 15% level in March, indicating that centralized trading platforms have taken on more speculative trading.
04 Lending Protocols
Aave and Morpho Lead the Way, Lending Deposits Rebound Significantly
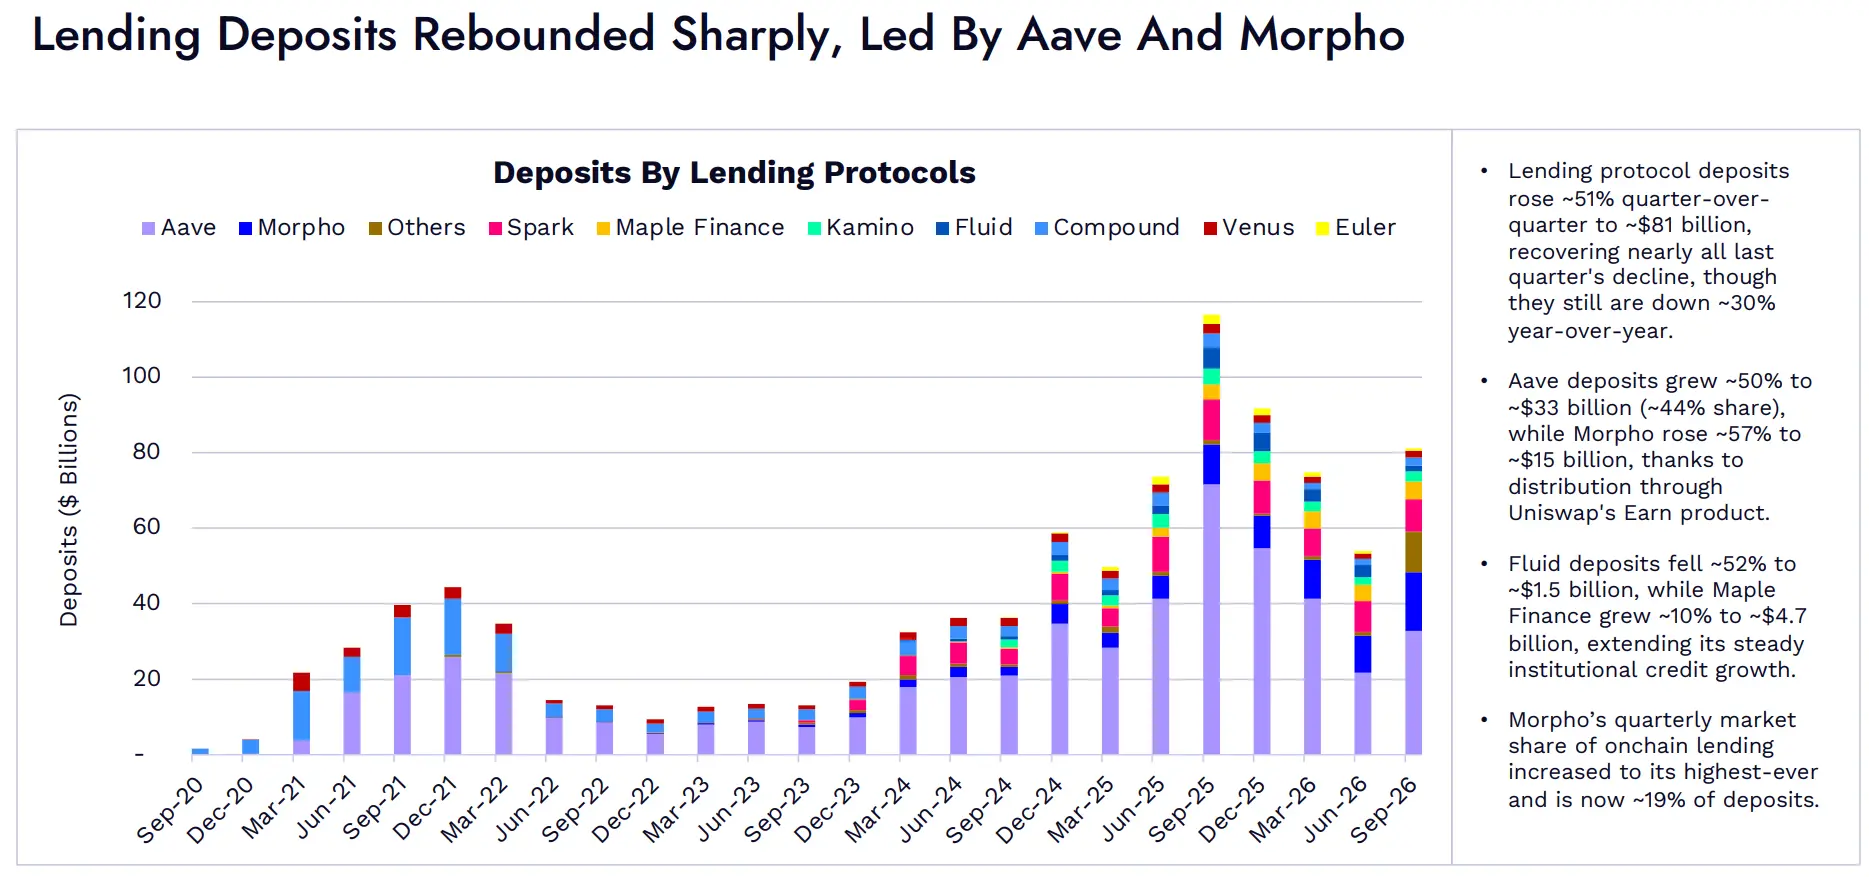
Image: Deposit Sizes of Various Lending Protocols.
Lending protocol deposits have increased approximately 51% quarter-over-quarter, reaching about $81 billion, nearly recovering all of the decline from the previous quarter, but still about 30% lower than the same period last year.
Aave's deposits have grown approximately 50%, reaching about $33 billion, accounting for about 44%; thanks to the distribution channels brought by the Uniswap Earn product, Morpho's deposits have increased approximately 57%, reaching about $15 billion.
Fluid's deposits have decreased by about 52%, to approximately $1.5 billion; Maple Finance has grown about 10%, reaching approximately $4.7 billion, continuing the steady growth of institutional credit business.
Morpho's share of on-chain lending deposits has risen to an all-time high this quarter, currently accounting for about 19% of total deposits.
Borrowing Demand is Recovering, Spark, Maple, and Morpho Lead Year-to-Date Growth
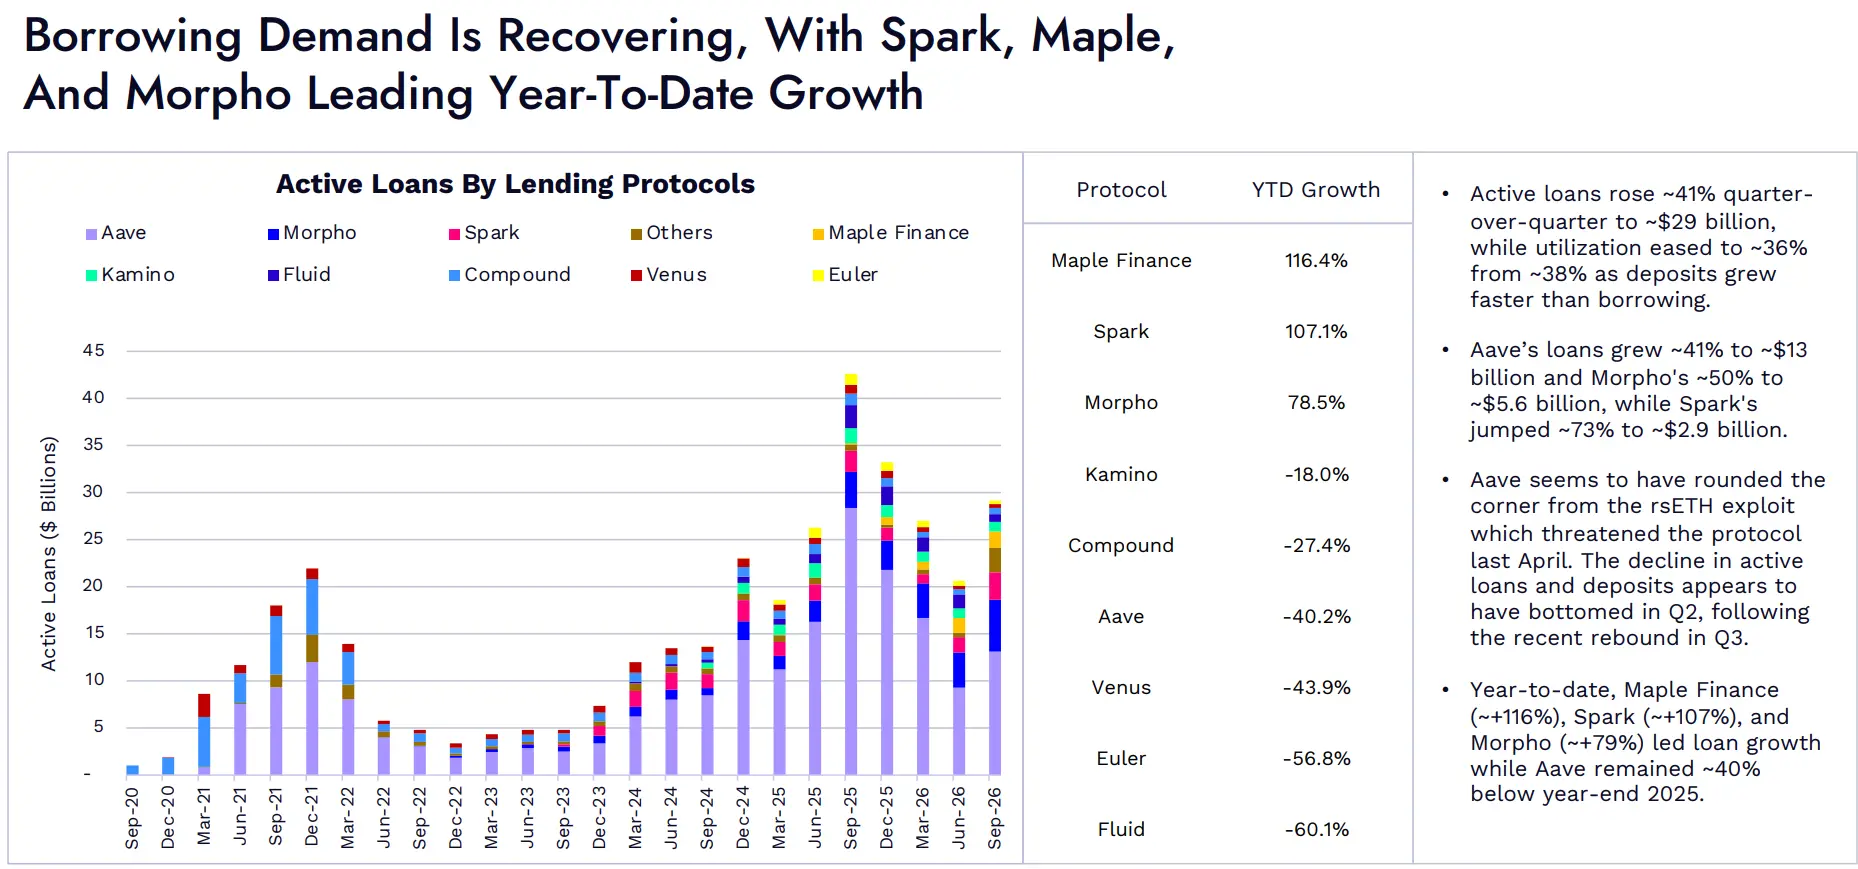
Image: The outstanding loan scale of various lending protocols.
The outstanding loan scale increased by about 41% month-on-month, reaching approximately $29 billion. As deposits grew faster than loans, the utilization rate slightly decreased from about 38% to approximately 36%.
Aave's loan scale increased by about 41%, reaching approximately $13 billion; Morpho grew by about 50%, reaching approximately $5.6 billion; Spark increased by about 73%, reaching approximately $2.9 billion.
Aave seems to have recovered from the impact of the rsETH attack incident that threatened the protocol's security in April this year. Combined with the rebound in the third quarter, the decline in its outstanding loans and deposits appears to have bottomed out in the second quarter.
Year-to-date, the loan growth of Maple Finance, Spark, and Morpho is approximately 116%, 107%, and 79%, respectively, leading the market; Aave, however, is still about 40% lower than at the end of 2025.
05 Market Focus: Tokenized Stocks
Tokenized stocks have become an important on-chain market, accounting for about 9% of spot DEX trading volume.
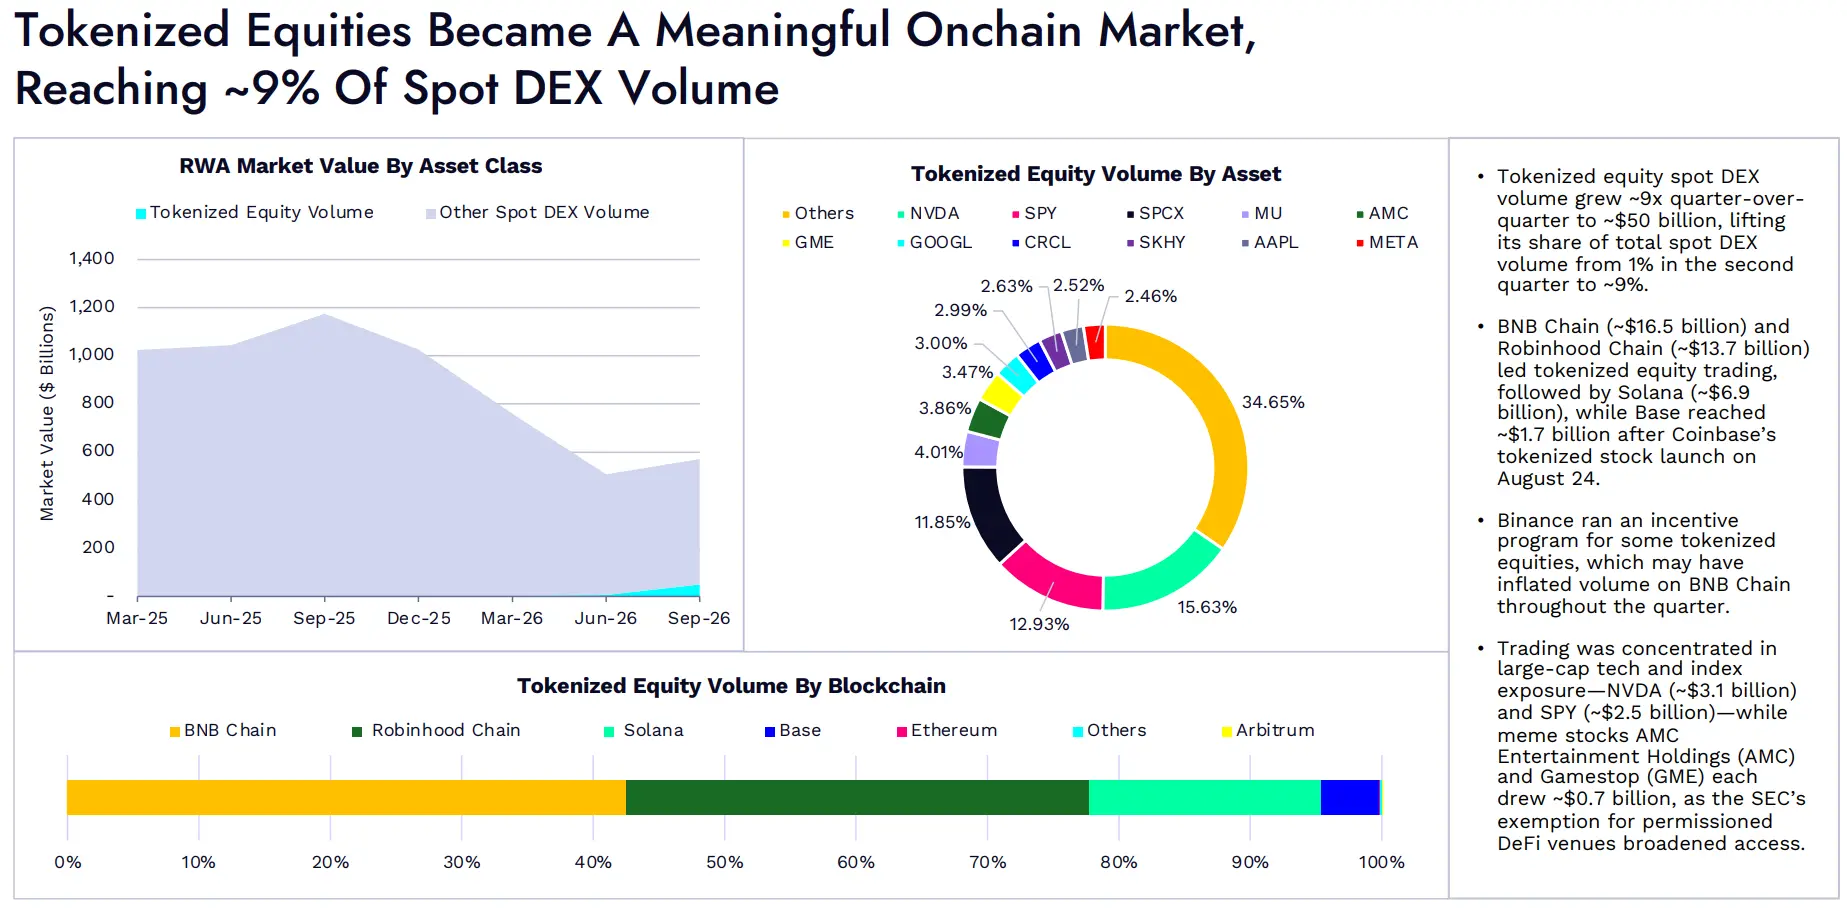
Image: RWA market capitalization by asset class. Trading volume of tokenized stocks by asset class. Trading volume of tokenized stocks by blockchain.
The spot DEX trading volume of tokenized stocks increased by about 9 times month-on-month, reaching approximately $50 billion, with its share of total spot DEX trading volume rising from 1% in the second quarter to about 9%.
BNB Chain and Robinhood Chain lead in tokenized stock trading, with trading volumes of approximately $16.5 billion and $13.7 billion, respectively; Solana follows with about $6.9 billion. After Coinbase launched tokenized stocks on August 24, the related trading volume on Base reached approximately $1.7 billion.
Binance has launched incentive programs for certain tokenized stocks, which may have boosted BNB Chain's trading volume throughout the quarter.
Trading is primarily concentrated on large tech stocks and index-type assets, with NVDA trading volume at approximately $3.1 billion and SPY at about $2.5 billion. Meme stocks AMC Entertainment Holdings (AMC) and GameStop (GME) each had trading volumes of about $700 million. The SEC has granted exemptions to DeFi platforms that require access licenses, expanding investors' access to these assets.
 Risk warning




Popular articles