



Huobi HTX Chief Analyst Review: The Three-Stage Trends and Long-Cycle Support and Resistance Levels of the Top Ten Track Representative Cryptocurrencies Over the Past Year

 Cloud, the chief analyst of Huobi HTX, recently released the annual review report, summarizing the trends and long-term support and resistance levels of the top ten representative cryptocurrencies over the past year, aiming to help users understand the positions of various assets in a differentiated market. Below is the full report.

The Chief Analyst of Huobi HTX, Cloud, recently released an annual review report, summarizing the trends and long-term support and resistance levels of the top ten representative cryptocurrencies over the past year, aiming to help users understand the position of various assets in a differentiated market. Below is the full report.
Introduction: A Year in Three Phases, A River of Differentiation
The cryptocurrency market over the past year was not a simple switch between bull and bear markets, but a complete three-phase decline---recovery---secondary drop. We selected the most representative assets from ten sectors------value storage (BTC), smart contract L1 (ETH, SOL), exchange platform tokens (BNB), cross-border payments (XRP), meme culture (DOGE), oracle (LINK), DeFi derivatives (HYPE), privacy (ZEC), AI computing networks (TAO)------based on Huobi HTX USDT perpetual contract daily data, tracing the complete trend from November 4, 2025, to November 5, 2026, a total of 367 days. It should be noted that all "highest points" and "lowest points" in this article refer to data within this one-year window; historical extremes outside the window (such as BTC's historical high of $126,199.6 recorded on October 6, 2025) will be separately noted; long-term Fibonacci calculations are based on the high and low points of the year.
The selection and inclusion logic for the representative coins from the ten sectors is as follows, with each chapter title indicating the corresponding sector:
Sector | Representative Coin | Inclusion Logic
Value Storage | BTC | First in market capitalization and liquidity, the pricing benchmark and risk preference anchor for the entire market
Smart Contract L1 | ETH | The preferred chain for settlement and RWA, the most direct representative of cash flow in the application layer
High-Performance L1 | SOL | The leading public chain with high throughput, the main hub for on-chain trading volume and MEME activity
Exchange Platform Token | BNB | The core of the top exchange ecosystem, the platform token with the most mature cash flow buyback model
Cross-Border Payments | XRP | The oldest asset narrative for cross-border settlement, a target for institutional allocation after regulatory implementation
Meme Culture | DOGE | The largest and most liquid cultural asset in the meme sector, a representative of the emotional cycle
Oracle | LINK | The leading provider of off-chain data and cross-chain infrastructure, the water seller for RWA tokenization
DeFi Derivatives | HYPE | The leading decentralized perpetual DEX, a representative of real income and cash flow from the buyback mechanism
Privacy Sector | ZEC | The original leader of zero-knowledge privacy coins, the core target of the current privacy narrative
AI×Crypto | TAO | A representative of decentralized computing power and subnet economy, the pricing carrier of the AI narrative in the crypto space
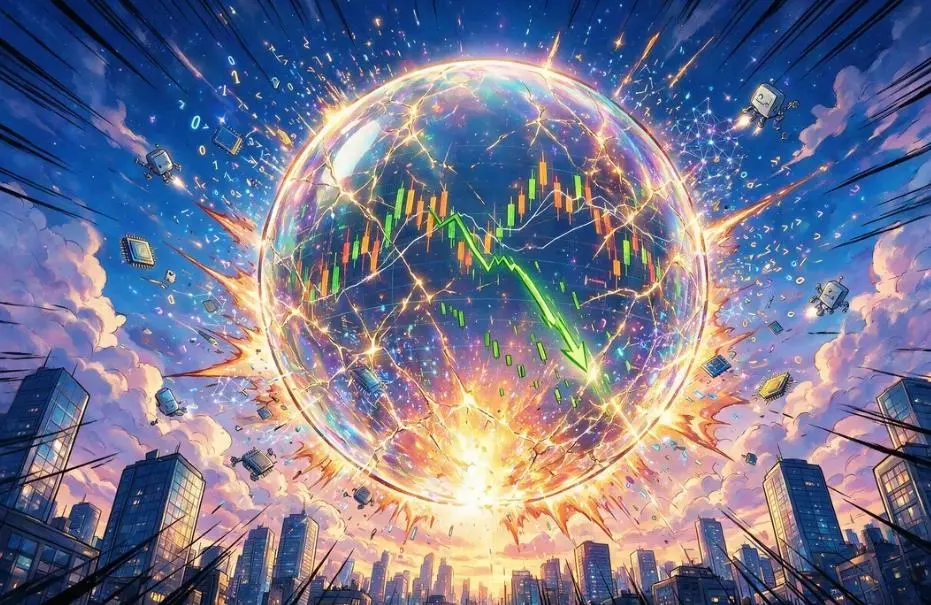
Let’s start with the conclusion. The first phase is the peak range from October to early November 2025: BTC reached a high of $126,199.6 on October 6, 2025 (also its historical peak, which falls outside the one-year window), and recorded the highest point within the window at $107,736 on November 4; mainstream assets like ETH, SOL, XRP, and DOGE almost simultaneously peaked in the same month. The second phase is the deep bear market in the first half of 2026: BTC hit a one-year low of $57,761 on July 1, 2026, with a maximum drawdown of 44.4%; the lows for ETH, SOL, LINK, and TAO also appeared densely in February and June 2026, with maximum drawdowns generally between 55% and 65%. The third phase is the recovery in the third quarter and the secondary drop in October and November: most assets rebounded over 50% in Q3 before weakening again, giving back a considerable portion of the recovery.
Differentiation is the most profound characteristic of this year. Among the ten coins, only two had positive returns: HYPE increased by 115.7%, and ZEC rose by 232.0%------the former represents the real cash flow of decentralized derivatives, while the latter signifies the strong return of the privacy narrative; the weakest, DOGE, fell by 52.9% over the year, with only 14% distance from its one-year low. Positions have changed significantly over the past two days: BTC's current price of $80,700 has reclaimed the 61.8% retracement level (at $76,852) with volume, and is approaching the 50% level (at $82,749); BNB's current price of $720 is precisely at the 61.8% level (at $721)------this is another precise long-term level after BTC; LINK has also reclaimed the 61.8% level, TAO has rebounded about 8% from the 78.6% level (at $219.5), and XRP is currently retesting the 78.6% level (at $1.33), while DOGE remains deeply below the 78.6% level. Long-term levels are not metaphysics; they record the market's pricing memory over a complete interval------when prices settle at these levels, the divergence between bulls and bears also converges here.
1. BTC (Value Storage): Precisely Landing on the 61.8% Level, The Anchor Star of Mainstream Coins
Trend Review. BTC has completed a three-phase script over the past year: after recording a one-year window high of $107,736 on November 4, 2025, it fell below $83,000 in late November, and fluctuated widely between $87,000 and $93,000 from December to January; in the second quarter of 2026, it accelerated downward, hitting a one-year low of $57,761 on July 1, with a maximum drawdown of 44.4%; after recovering above $80,000 in the third quarter, it fell again to $76,511 in October and November, and on November 4, it reclaimed the $80,000 mark with volume, currently reported at $80,693, with a cumulative decline over the year narrowing to 21.8%, currently 25.1% away from the window high and 39.7% from the low. Among the ten coins, BTC has the shallowest one-year decline and maximum drawdown; it remains the main channel of this river------the relative strength of all other assets should be measured against BTC.
Long-Term Levels. Based on the one-year window high and low points of $107,736 and $57,761, BTC precisely retested the 61.8% retracement level of $76,852 on November 4 and reclaimed it with volume, currently reported at $80,693, having returned above the 61.8% level and is about 2.5% away from the 50% retracement level of $82,749. Support below is sequentially the reclaimed 61.8% level of $76,852 and the 78.6% retracement level of $68,456; resistance above is sequentially the 50% retracement level of $82,749 and the 38.2% retracement level of $88,645. A higher reference is the historical high of $126,199.6 on October 6, 2025: if we take this high and the low of $57,761 as the framework, the 50% retracement level is about $91,980, the 61.8% retracement level is about $83,905, and the 78.6% retracement level is about $72,387. The two metrics corroborate each other------the range of $82,700 to $83,900 is a resistance zone (the 50% level from the window metric overlaps with the 61.8% level from the ATH metric), and an effective breakthrough would lead to a main upward phase of the recovery; below, $76,852 would turn from resistance back to support, and if lost, we would look at $72,400 and $68,500, which is also a dense cost area near the gap start of the September recovery.
Future Influencing Factors. First, the flow of ETF funds: since 2026, spot ETFs have seen multiple weeks of net outflows (recently a net outflow of $203 million in one week), and institutional marginal funds have been the marginal price setters over the past two years; whether they turn or not will determine if the box can break upward. Second, the macro interest rate path: changes in bets on whether the Federal Reserve will raise rates in December directly affect risk appetite, and every data point from non-farm payrolls and inflation will be amplified. Third, on-chain structure: long-term holder supply, exchange balances, miner income, and other on-chain indicators often lead price bottoms in the later stages of deep bears; Q3 recovery has validated this once, and whether it gives signals again in the secondary drop is worth tracking. Fourth, the behavior of treasury companies: disclosures of increases or decreases in holdings by listed treasury companies have become independent event sources for short-term BTC fluctuations.
2. ETH (Smart Contract L1): Back Below the 61.8% Level, Waiting for Application Layer Cash Flow
Trend Review. ETH recorded a one-year window high of $3,682 almost simultaneously with BTC on November 4, 2025, but its downward slope was noticeably steeper: it hit a one-year low of $1,504 on June 6, 2026, with a maximum drawdown of 55.7%, deeper than BTC's 44.4%; after recovering in Q3, it briefly broke through the 50% retracement level, but fell again in October and November, rebounding with the market on November 4, currently reported at $2,431, with a cumulative decline over the year narrowing to 30.7%, currently 34.0% away from the window high and 61.5% from the low. The drawdown from the high is about 9 percentage points deeper than BTC, reflecting that the market's pricing of its application layer cash flow is still contracting this year.
Long-Term Levels. Based on the range of $3,682 to $1,504, ETH's 61.8% retracement level is at $2,337, and the current price of $2,431 has reclaimed this level with volume, approaching the 50% level of $2,594; $2,337 has turned from resistance back to support, serving as a short-term boundary between bulls and bears. Support below is sequentially the 61.8% level of $2,337, the 78.6% retracement level of $1,971, and the one-year low of $1,504; resistance above is sequentially the 50% level of $2,594 and the 38.2% level of $2,851. After stabilizing at $2,337, the next target is $2,594; if lost again, it indicates that this round of recovery is still dominated by short covering.
Future Influencing Factors. First, the diversion of fees from L2 to the mainnet: L2 pulls trading activity away, reducing mainnet burns, and the deflation narrative of ETH continues to weaken, which is the core reason for valuation contraction. Second, staking and ETF structure: an increase in staking-type ETFs and institutional staking ratios will lock up circulating supply, which is a potential positive variable. Third, the share of RWA and stablecoin settlements: Ethereum remains the preferred settlement layer for institutional tokenization; if the scale of RWA expands rapidly, fees and burns will return. Fourth, the pace of technological upgrades: expectations around upgrades for scaling and consensus layers over the next year will periodically change market pricing.
3. SOL (High-Performance L1): Stuck Between 61.8% and 78.6%, A High Beta Asset
Trend Review. SOL recorded a one-year window high of $171.74 on November 11, 2025, slightly later than other mainstream large coins; it hit a one-year low of $60.14 on June 6, 2026, with a maximum drawdown of 62.5%, the deepest among L1s; after recovering in Q3, it fell again below $84 in October and November, followed by a rebound over the next two days, currently reported at $96.29, with a cumulative decline of 40.3% over the year, currently 43.9% away from the window high and 60.1% from the low. As a high beta asset, SOL's volatility has always been greater than BTC------it rises more during uptrends and falls deeper during downtrends, making this year a complete annotation.
Long-term price points. Based on the range of 171.74---60.14, the current price of SOL at $96.29 is still between the 61.8% retracement level of $102.77 and the 78.6% retracement level of $84.03, having rebounded about 15% from the low of the 78.6% level, but still 6.7% away from the 61.8% level. The support levels below are $84.03 at the 78.6% level and $60.14 at the one-year low; the resistance levels above are $102.77 at the 61.8% level, $115.94 at the 50% level, and $129.11 at the 38.2% level. The $84 level has withstood a second test of the bottom and is the last line of defense for the bulls; reclaiming $102.8 would reopen the repair space.
Future influencing factors. First, the performance of validator clients: The advancement of new-generation clients like Firedancer determines network stability and throughput limits, which is a prerequisite for institutional capital entry. Second, on-chain trading activity: MEME trading and DEX share are the main sources of SOL fees, and their activity cycle directly reflects the price elasticity. Third, progress on spot ETFs: The approval and capital inflow rhythm of the US SOL spot ETF is the most important incremental variable for 2026. Fourth, the competitive narrative with ETH: In the L1 arms race, where developers and liquidity migrate determines the long-term valuation anchor.
4. BNB (Exchange Platform Token): The mainstream coin that has fallen the least, cash flow resilience of platform tokens
Price trend review. BNB recorded a one-year window high of $1,018 on November 10, 2025, and a one-year low of $537.5 on July 1, 2026, the same day as BTC, with a maximum drawdown of 45.1%; after a recovery in Q3, it fell back in October-November, and then rebounded with the market, currently reported at $720, a cumulative decline of 24.2% over the year, currently 29.3% away from the window high and 33.9% from the low. Among the ten coins, BNB's one-year decline and maximum drawdown are second only to BTC, showing significantly better resilience than other public chain assets—platform tokens have real, stable exchange cash flow support, demonstrating defensive properties during liquidity contraction periods.
Long-term price points. Based on the range of 1,018---537.5, BNB's 78.6% retracement level is at $640, and the current price of $720 not only stays above the 78.6% level but also just stops at the edge of the 61.8% retracement level of $721.13—this is another precise long-term price point after BTC, better positioned than XRP and DOGE. The support levels below are $640 at the 78.6% level and $537.5 at the one-year low; the resistance levels above are $778 at the 50% level and $835 at the 38.2% level. The gain or loss at $721 is the first short-term hurdle: if it stands above, it confirms the recovery of the 61.8% level, and above $778, it enters the main rising segment of the repair market.
Future influencing factors. First, the prosperity of exchange business: Spot and contract trading volume, and new user growth directly determine platform revenue and repurchase and destruction intensity, with quarterly destruction amounts being the hardest pricing anchor. Second, on-chain ecology: The DEX trading volume of BNB Chain and the activity level of the MEME ecosystem determine on-chain demand. Third, regulatory environment: Compliance costs and licensing progress faced by leading exchanges affect risk premiums. Fourth, marginal changes in the destruction mechanism: If the rhythm or rules of destruction are adjusted, it will directly change the supply curve.
5. XRP (Cross-border Payment): Falling below the 78.6% level, the latecomer with the latest low
Price trend review. XRP recorded a one-year window high of $2.58 on November 11, 2025; unlike most assets, its one-year low did not occur in mid-2026 but at $0.984 on August 15—this second dip was two months later than mainstream large coins, with a maximum drawdown of 60.4%; after rebounding to above $1.6 in Q3, it weakened again, and on November 4, it rebounded with the market, currently reported at $1.31, a cumulative decline of 42.6% over the year, currently 49.3% away from the window high and 33.0% from the low. The latest low means that XRP's clearing rhythm is independent of the overall market, and its pricing is more driven by its own events rather than following BTC.
Long-term price points. Based on the range of 2.58---0.984, XRP's 78.6% retracement level is at $1.33, and the current price of $1.31 is testing this level—only less than 2% away from reclaiming it, but it is still one of the weakest assets among the ten coins. The support levels below are the short-term cost area around $1.27 and the one-year low of $0.984; the resistance levels above are $1.33 at the 78.6% level, $1.59 at the 61.8% level, $1.78 at the 50% level, and $1.97 at the 38.2% level. The gain or loss at $1.33 is the short-term dividing line: reclaiming it confirms the start of the repair, while the $1 integer level and the one-year low form a dual psychological defense.
Future influencing factors. First, the implementation of cross-border payments: The scale of settlement cooperation with traditional banks and the share of stablecoins in cross-border channels determine the speed of its transformation from a narrative asset to a cash flow asset. Second, ETF progress: The approval and capital inflow of the XRP spot ETF is the most direct event variable for 2026. Third, institutional allocation after regulatory clarity: The rhythm of releasing compliance dividends after the lawsuit ends is still slowly being realized. Fourth, the competitive relationship with stablecoins: The cross-border payment market is also being eroded by stablecoins, and XRP needs to prove it is faster and cheaper than dollar stablecoins.
6. DOGE (Meme Culture): Just a step away from the one-year low, a clearing sample of Memes
Price trend review. DOGE recorded a one-year window high of $0.186 on November 11, 2025, and a one-year low of $0.0677 on August 2, 2026, with a maximum drawdown of 61.4%; currently reported at $0.0772, a cumulative decline of 52.9% over the year, still the weakest among the ten coins—currently 58.5% away from the window high and 14.1% from the low. In the past two days, it has rebounded about 14% from the low, but it is still running almost at the one-year low, with the deepest clearing among the ten coins. Meme assets lack cash flow anchors, and during liquidity contraction periods, they experience the most thorough price contraction among all assets; DOGE is a complete sample of this logic.
Long-term price points. Based on the range of 0.186---0.0677, DOGE's 78.6% retracement level is at $0.090, which has clearly fallen below; the 61.8% level at $0.11, the 50% level at $0.13, and the 38.2% level at $0.14 all constitute layers of pressure above the current price. The only remaining support below is the one-year low of $0.0677, and further down is the old cost area before 2024. If $0.0677 is lost, it will technically open up new downward space; conversely, if a double bottom is completed here, the sentiment repair of the Meme track will lead with DOGE.
Future influencing factors. First, the liquidity environment: Meme assets are the most sensitive to global liquidity and risk appetite, with every change in the Federal Reserve's interest rate hike rhythm directly affecting their valuation, which is DOGE's Achilles' heel. Second, social platforms and payment narratives: The progress of payment functions on platform X and the cyclical return of celebrity effects are unique catalytic paths for DOGE. Third, the funding structure of the track: Incremental funds in the MEME track come from retail risk appetite, and changes in on-chain active addresses and holding concentration are leading indicators. Fourth, substitution effects: New generations of Meme assets continuously divert existing attention, and DOGE, as an established Meme, needs to prove its ability to continuously monetize its cultural assets.
7. LINK (Oracle): Holding the 78.6% level, the invisible seller of tokenized water
Price trend review. LINK recorded a one-year window high of $16.78 on November 11, 2025, and a one-year low of $7.00 on June 6, 2026, with a maximum drawdown of 55.3%; after a recovery in Q3, it fell back to around $10 in October-November, and on November 4, it rebounded with the market, currently reported at $11.49, a cumulative decline of 23.9% over the year, currently 31.5% away from the window high and 64.1% from the low. Its drawdown depth is between BTC/BNB and ETH/SOL, and the one-year low appeared in early June, synchronizing with ETH and SOL, with a clearing rhythm consistent with mainstream large coins.
Long-term price points. Based on the range of 16.78---7.00, LINK's 78.6% retracement level is at $9.09, and the current price of $11.49 has reclaimed the 61.8% level of $10.74 with volume, approaching the 50% level of $11.89; $10.74 has turned from resistance to support. The support levels below are $10.74 at the 61.8% level, $9.09 at the 78.6% level, and $7.00 at the one-year low; the resistance levels above are $11.89 at the 50% level and $13.04 at the 38.2% level. Standing above $11.89 would lead the repair market into the main rising segment; if it loses $10.74 again, it indicates that this rebound is still an event-driven pulse.
Future influencing factors. First, the infrastructure demand for RWA and bank tokenization: As a leading oracle, LINK is a necessary service provider in the asset onboarding process, and the pilot progress with Swift, DTCC, and several global banks is the core support for long-term valuation. Second, the adoption of the CCIP cross-chain protocol: Growth in institutional-level cross-chain settlement volume will translate into real income. Third, the advancement of staking economics: After staking goes live, LINK begins to have yield attributes, changing its pure narrative valuation. Fourth, the competitive landscape: The market share erosion by other oracles and emerging cross-chain solutions is a marginal variable that needs continuous tracking.
8. HYPE (DeFi Derivatives): One of the only two positive yield assets among the ten coins, cash flow premium of derivative DEX
Price trend review. HYPE is one of the two positive yield assets among the ten coins: its one-year low appeared at $20.5 on January 21, 2026, after which it embarked on an independent trend, reaching a one-year high of $98.1 on September 23, currently reported at $84.4, a cumulative increase of 115.7% over the year, currently 13.9% away from the high and 312% from the low. Against the backdrop of a deep bear market across the network, HYPE has achieved a doubling trend with only a little over a 10% drawdown from the high—this extreme divergence from the overall market reflects the ongoing erosion of trading volume share from decentralized perpetual exchanges against centralized exchanges, as well as the repurchase mechanism driven by the platform's real income.
Long-term price points. Since HYPE's highs and lows both occurred within this year (January low, September high), its Fibonacci framework differs from mainstream coins that peaked a year ago, with the calculation range being $98.1---20.5: 38.2% retracement level at $68.46, 50% level at $59.31, and 61.8% level at $50.15. The current price of $84.4 is near the upper edge of the range, with a shallow drawdown. The first support below is at the 38.2% level of $68.46, followed by the 50% level of $59.31; the resistance is at the one-year high of $98.1. For assets still reaching new highs, whether the previous high breaks is the only technical criterion for trend continuation.
Future influencing factors. First, the share competition of perpetual DEX: The trading volume and margin stock growth of Hyperliquid determine the sustainability of its cash flow premium. Second, the repurchase and distribution mechanism: The rhythm of platform income used for repurchase directly constitutes buying power. Third, ecological airdrops and point cycles: The expectations of airdrops from ecological projects attract existing funds to settle, serving as a leveraged growth flywheel and a potential point of deleveraging risk. Fourth, regulatory margins: The compliance scrutiny faced by decentralized derivatives is heating up, and the response capability of leading platforms determines valuation discounts.
9. ZEC (Privacy Track): The king of privacy that has doubled in a year, crowded trading under high volatility
Market Review. ZEC is the strongest asset among the ten coins: after hitting a one-year low of $184.63 on February 6, 2026, it began a major rally, reaching a one-year high of $1,691 on September 27, with a maximum increase of over eight times. It is currently priced at $1,313, with a year-to-date increase of 232.0%, currently 22.3% away from its high and 611% away from its low. It is important to note that this explosive rise has not been smooth—there was a maximum drawdown of 72.1% within the year, most of which occurred during the deep washout amid the surge. The narrative of privacy has suddenly shifted from a regulated and niche track to the market mainstream, and ZEC has completed a textbook-level repricing.
Long-term Price Levels. Based on the range of $1,691 to $184.63, the 38.2% retracement level for ZEC is at $1,115.57, and the current price of $1,313 is above this level; the 50% level is at $937.82, and the 61.8% level is at $760.06, forming a deeper support zone; the upper pressure is the one-year high of $1,691. For an asset that has more than doubled in a year, losing the 38.2% level would mean a phase-ending of the major upward trend, at which point the 50% level of $938 will become a true test for the bulls.
Future Influencing Factors. First is the sustainability of the privacy narrative and regulatory attitude: every step of loosening or tightening the compliance market channels (exchange listings, fiat deposits and withdrawals) directly affects the price. Second is the funding structure: surging assets often come with high leverage and crowded positions, and extreme values of funding rates and perpetual open interest are warning signals for drawdowns. Third is technological adoption: the real growth in the usage of privacy pools and demand for transaction privacy determines the fundamental quality beyond the narrative. Fourth is the competitive landscape: other privacy solutions and emerging anonymous assets may preemptively exhaust the enthusiasm for the track.
10. TAO (AI×Crypto): Precisely hitting the 78.6% level, the second bottom of the AI narrative
Market Review. TAO recorded a one-year window high of $502.15 on November 4, 2025, the same day as BTC, and a one-year low of $142.54 on February 6, 2026, with a maximum drawdown of 64.2%; after a recovery in Q3, it fell back to near the 78.6% retracement level in October and November, then rebounded precisely over the next two days, currently priced at $236.51, with a year-to-date decrease of 41.9%, currently 52.9% away from the window high and 65.9% away from the low. AI×Crypto was one of the most crowded narratives in 2025, and this year's significant drawdown was precisely the clearing of that crowd—but unlike DOGE, TAO still has an operational computing network and subnet economy generating real activity.
Long-term Price Levels. Based on the range of $502.15 to $142.54, the 78.6% retracement level for TAO is at $219.5, and from November 3 to 4, the price rebounded precisely from this level to $236.51, rising about 8% over two days—this $219.5 level has already been validated as the first wave of recovery. The lower support levels are sequentially the 78.6% level of $219.5 and the one-year low of $142.54; the upper pressure levels are sequentially the 61.8% level of $279.91, the 50% level of $322.34, and the 38.2% level of $364.78. The $219.5 level has shifted from a watershed to support; if it is lost, we will look to the low; if it rises above $279.91, it will confirm the second market movement of the AI narrative starting from this level.
Future Influencing Factors. First is the realization of dTAO and the subnet economy: adjustments to the subnet token mechanism have changed the supply and value capture logic of TAO, and its effects are being validated by the market season by season. Second is real AI demand: the generation of reasoning and training services in the subnet that can be externally purchased is the only channel from narrative to cash flow. Third is the mapping of the AI mainline: the capital expenditure cycles of centralized AI giants and the progress of open-source models will transmit to the valuation of decentralized computing networks. Fourth is the balance of emissions and demand: TAO continues to issue with each block, and if the growth rate of demand does not keep up with issuance, it will face structural selling pressure in the long term.
Summary: Replace Emotion with Price Discipline, Find Exceptions through Differentiation
Placing the ten coins on the same long-term map, the conclusions are clear: BTC has regained the 61.8% retracement level with volume and is approaching the 50% level, BNB is exactly at the 61.8% level, TAO has rebounded approximately 8% from the 78.6% level, LINK has reclaimed the 61.8% level and is nearing the 50% level, SOL is still stuck in the narrow gap between 61.8% and 78.6%, XRP is currently bouncing off the 78.6% level, DOGE remains below it, while HYPE and ZEC, both positive yield assets, continue to operate at the upper edge of their respective ranges. The positions themselves do not constitute predictions, but they provide a set of discipline: once support and resistance are clearly defined, adding positions, stop-losses, and breakout confirmations all have executable coordinates, without relying on directional beliefs.
The three main lines worth repeated examination in the coming year are: First is liquidity: the Federal Reserve's decision on whether to raise interest rates in December and the subsequent interest rate path will determine the valuation center of all risk assets, especially the life and death of cash flow-less assets like DOGE. Second is cash flow realization: this year the market has voted with real money—HYPE with real income stands out, while purely narrative assets have generally halved, "pricing based on returns rather than narratives" will continue to deepen in 2026. Third is structural events: the ETF progress of XRP and SOL, the regulatory margins of the privacy track, and the bank-level landing of RWA infrastructure, each of which could allow individual assets to break away from the market and develop independent trends. Long-term price levels tell us where we are, and these three main lines tell us where we might go.
Risk Warning: The data in this article is sourced from Huobi HTX USDT perpetual contracts daily, as of November 5, 2026; the terms "highest point" and "lowest point" refer to data within the one-year window from November 4, 2025, to November 5, 2026 (BTC's historical high of $126,199.6 on October 6, 2025, is outside the window and has been separately noted); support and resistance levels are based on Fibonacci retracement calculations from the one-year high and low points, for technical reference only, and do not constitute any investment advice. Cryptocurrency asset prices are highly volatile; please carefully assess your own risk tolerance.
 Risk warning Risk warning