In-depth analysis of the competition between second-tier public chains from the perspective of Avalanche

 Now, public chains are in a chaotic era. The leading public chain Ethereum has repeatedly fallen into the abyss, while the second-tier public chains continue to emerge in response to the times. What are the advantages and disadvantages of the currently popular second-tier public chains?
Author: Maco, W3.Hitchhiker
1. Basic Information
1. Avalanche Architecture and Technology
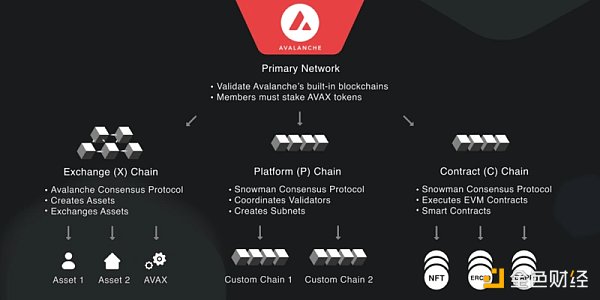
Avalanche features a three-chain architecture, consisting of the Transaction Chain (X-Chain, DAG), Contract Chain (C-Chain), and Platform Chain (P-Chain). The diagram below provides a clear division of labor.
Avalanche adopts horizontal scaling, similar to Cosmos and Polkadot, with a simple comparison as follows:
Dot network validators maintain a unified global state, and parallel chains have shared security (highest security); flexibility/autonomy is the worst, and future scalability and performance will be constrained by the relay chain; inter-chain interoperability is the best;
Validators in the Avax network are completely independent, consisting of a subnet of validating nodes that do not share state but "partially" share security (medium security, subnets can operate multiple chains while enjoying fee rewards from multiple networks and also bear penalty risks); flexibility/autonomy is medium, scalability is good; theoretically, interoperability within subnets is good.
Validators in the Cosmos network are completely independent, with non-shared state and security (lowest security, with improvements in the future), and the security level of hubs/zones varies; flexibility/autonomy is the best, zones have high freedom, and scalability is not limited; inter-chain interoperability is good;

Advantages:
New BFT consensus: low latency and high scalability. By adopting small sample repeated sampling and a DAG information transmission architecture, this structure eliminates the "complexity of secondary message passing" between nodes (the amount of messaging is the square of the number of nodes), thus the network consensus/verification efficiency will not decline with an increase in the number of nodes, theoretically supporting more nodes than PBFT (number of nodes Avax: 1283, Atom: 175, Dot: 297).
Subnets: provide horizontal scalability, referred to as "overlapping validation networks," requiring all subnets to act as validators for the main network ------ staking 2000 Avax. This not only strengthens the overall security of the network but also empowers the Avax token, making the economic model and theoretical network security stronger than Cosmos, but lower than Dot; however, the entry threshold for subnets is relatively low.
Compared to similar architectures like Cosmos and Dot, Avax has the C-Chain, a market-tested model, allowing projects to create a sovereign chain more confidently.
Disadvantages:
Interactivity between subnets: Interactions within a subnet are instantaneous and protected by shared security, but interactions between subnets can currently only occur through bridges. This is weaker than Cosmos's IBC and Dot's XCM.
The adoption rate of subnets is not as widespread as Cosmos and Dot, and is singular (only GameFi), raising questions about whether the innovative consensus mechanism can withstand pressure in a formal market environment.
Avax has not yet been tested through a bear market.
2. Key Team Members
Founder & CEO: Emin Gün Sirer, professor at Cornell University, founded the blockchain organization IC3 funded by the National Science Foundation, and developed the first POW currency system Karma seven years before Bitcoin.
Co-founder & COO & CPO: Kevin Sekniqi, PhD in Computer Science from Cornell University.
Co-founder & CPO: Ted Yin, PhD from Cornell University, inventor of the HotStuff consensus used by Libra.
President: John Wu, Cornell University/Harvard Business School, professional investor and manager, previously worked at Tiger Global.
3. Financing
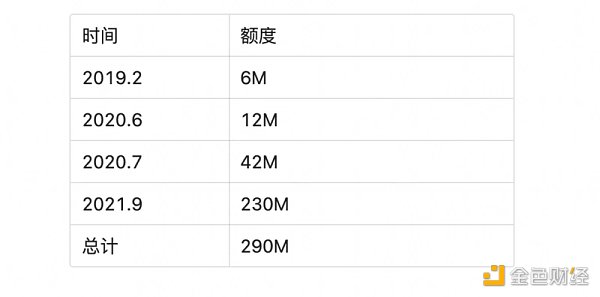
According to Crunchbase, Ava Labs has raised funds 7 times, with a total financing amount of 290M.
Major investors include: a16z, Polychain, Three Arrows, Bitmain, Galaxy Digital, Dragonfly Capital, NGC Ventures, Initialized Capital.
TL;DR:
The team has strong technical capabilities, the funding is also solid, and the direction of scalability is currently quite mainstream, with a competitive edge among mainstream multi-chain networks, along with real use cases and customization features.
2. Public Chain Performance
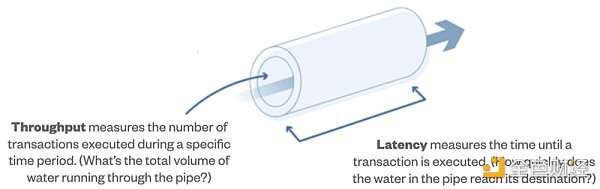
1. Throughput
To differentiate from ETH, public chains have reported impressive TPS figures, in the thousands, but after practical calculations and experiences, we feel there are some differences, but they are far from what is officially advertised.
The most reliable way to evaluate public chain performance currently observed is Dragonfly's research article "The AMM test: A no BS look at L1 performance." The following TPS results are calculated based on swap transactions (contract interactions) consuming gas (this is also a relatively fair theoretical calculation method we recognize, as the transaction components on each chain vary, and calculating only ordinary transactions would show significant differences).
Due to some chains having gas targets and gas limits, the solid columns represent the Target, indicating that the public chain operates well within this TPS range, and user experience is also good. Exceeding this will lead to poor experience/gas fees skyrocketing (as shown in Figure 2). We can see that the highest TPS limit among public chains is SOL at 273, with the highest EVM-compatible chain being BSC at 194, and ETH at 18. Although there is a 15X gap between the highest and lowest, it is not as significant as the hundreds or thousands claimed by each chain's official statements.
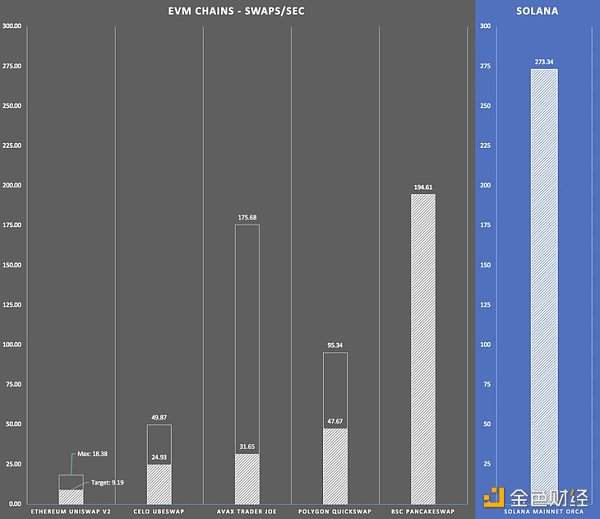
(Figure 1)
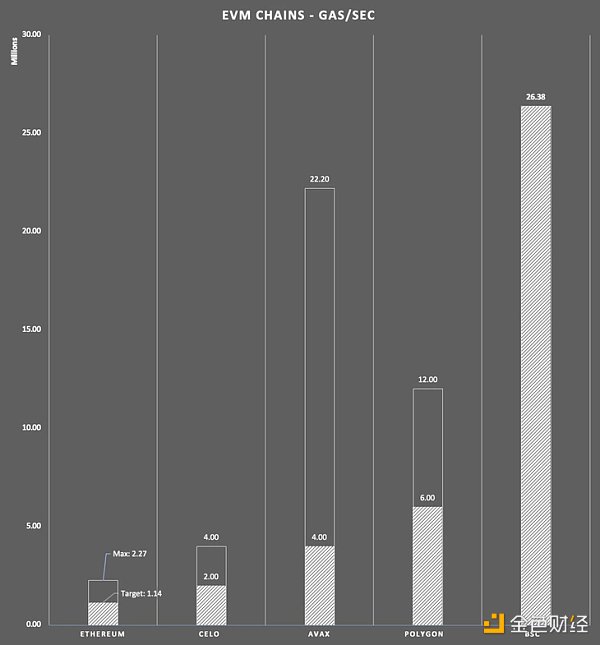
(Figure 2)
The above calculations are similar to W3's performance estimation of BSC last year, but we used the actual gas limit and actual transactions in a running environment for estimation. This logic better simulates real-world conditions, but this method is only applicable to EVM chains with relatively stable block times and actual ecological usage reaching/approaching chain limits.
We calculated the theoretical maximum TPS limit that the chain can achieve in a real operating environment using the following formula:

We obtained the corresponding data for each chain (gas limit, gas used/day, tx/day, block time) from the browser and averaged them to find that the TPS limits for ETH and BSC are 18.9 and 146.7, respectively.
In processing the gas used/tx data, we can see that we took the average value that actually occurred on the chain, rather than simply using the consumption data from contract interactions or simple transfers (21k gas):
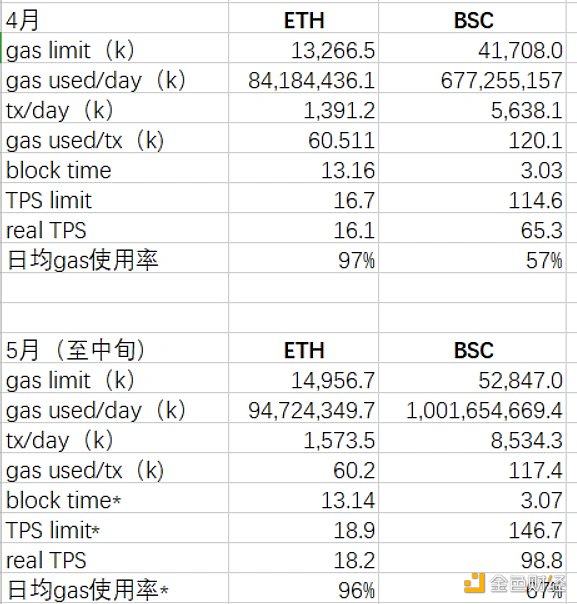
According to the above table, we can see that ETH has been in a "full run" state, with gas usage rates consistently above 95%. Therefore, the actual performance is around 18.
As the "EVM peak," the BSC ecosystem experienced a massive explosion in the second quarter of last year, with frequent on-chain activities, which also tested the chain's performance in a real environment. Although the official continuously raised the gas limit as a temporary performance enhancement solution starting in April, the TPS only reached around 146 at most, but the user experience was very poor ------ congested and frequent block synchronization issues. Therefore, based on actual experience, the TPS that could run well is around 100, far from reaching 194. (From subsequent data in November, TPS reached a new high (219), possibly due to Binance upgrading equipment, but under the same architecture, there is limited room for further improvement, so Binance also began adopting the BNB chain multi-chain solution.)
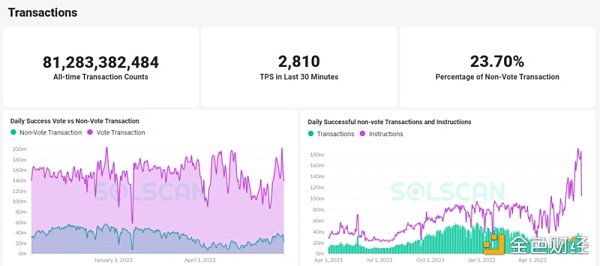
The SOL chain is somewhat special, as it does not have the concept of gas limits, so we have not yet found a corresponding calculation method. We can only observe its potential upper limit through historical data in the browser.
Excluding the impact of special events like IDO and NFT minting, under normal circumstances, SOL's TPS can stabilize around 3000, but we can see from the browser that about 76% of this 3000 TPS is for achieving on-chain consensus messages (voting), which cannot be counted as real user transactions and should be excluded. In the remaining TPS, we observed that simple transactions interacting with Serum occupy a significant proportion (due to SOL's special mechanism, most protocols will interact with Serum), so we believe this also cannot be counted as real user consumption and should be excluded. The remaining real user transactions are around 10%, so the real TPS is about 300. However, this method does not measure SOL's limit, so the actual TPS should be 300+. As for the frequent outages of the SOL chain leading to poor user experience, that is another matter and is not within the scope of this discussion.
2. Latency
When evaluating public chain performance, most people only assess TPS throughput, as it represents how many transactions can be accommodated in a certain time (how much water can flow through the pipe). However, we should also look at another dimension ------ latency, which indicates how long it takes for these transactions to be executed (how long it takes for this water to flow through the pipe). This metric can even surpass TPS in terms of user experience.
Latency is difficult to quantify; we mainly observe the confirmation time of transactions, meaning the shorter the confirmation time, the better the user experience.
We first exclude special cases of high concurrency, as all chains will experience high latency during high concurrency moments. Here, we only consider normal situations, observing from the user's subjective experience (random interviews and perceptions). SOL had noticeable transaction confirmation delays and particularly high transaction failure rates (averaging 15%-20%) during its explosive period last year. Subsequently, although the official implemented emergency throttling measures, the effects were average; Polygon and BSC also experienced very high transaction delays after their explosions, which have not been resolved.
According to incomplete feedback and personal experience, all chains have transaction confirmation delay issues during peak periods, and these are difficult to resolve. In comparison, Avax's experience is somewhat better ------ although transaction fees are high during peak periods, there has not been large-scale congestion delays (under normal conditions). Besides the advantages of the mechanism, this is also significantly related to network utilization.
3. Events
Regarding performance, various chains have encountered issues and are currently actively improving:
Solana: Previously implemented throttling on requests during peak periods. The latest v1.1 update has restored TPS to previous highs, improving user experience; future plans include introducing data flow control technology to improve gas models.
Avalanche: A large influx of traffic may expose some performance issues. Avalanche once triggered cross-chain functionality errors due to high load from the DEX Pangolin, causing some short-term panic in the community.
BSC / Polygon: In the second quarter of last year, due to an explosion of on-chain activities, both chains experienced severe congestion and skyrocketing gas fees.
TL;DR:
Currently, the single-chain TPS ceiling is SOL, and the performance ceiling for all EVM chains is basically BSC, but the gap is far less than what is officially advertised, and high TPS chains have all experienced issues to varying degrees (SOL outages, BSC node synchronization issues).
Each chain's theoretical performance limits come at a significant cost ------ skyrocketing gas fees. SOL will not be affected by this, as it does not have the concept of gas limits.
Each chain is powerless in the face of instantaneous high concurrency, and current solutions are insufficient to support sustained high-frequency on-chain activities, leaving room for improvement in user experience.
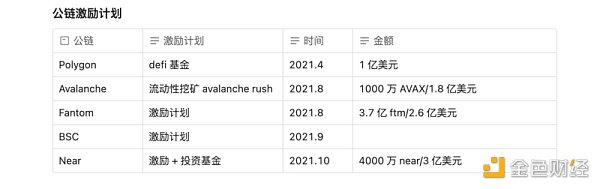
3. Ecological Support and Incentives
In 2021, major public chains launched numerous incentive programs to capture TVL, and here is a simple list:
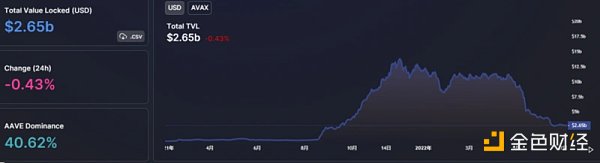
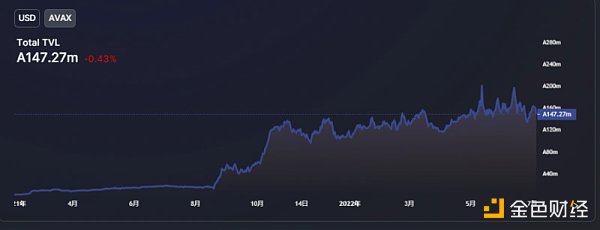
Avalanche Rush's incentives increased the chain's TVL nearly tenfold in just ten days, from $260 million to $2.3 billion, creating a positive cycle. Coupled with the rise in Avax's price, the public chain's TVL surged, reaching a peak of $13 billion. To this day, although TVL has plummeted with the market, there are no signs of asset outflows from the Avax chain from a coin-based perspective, indicating that the public chain has retained a portion of loyal assets/users.
Other Incentives
In November 2021, the Avalanche Foundation launched an incentive program called Blizzard with over $220 million. The incentive program focuses on developers in DeFi, enterprise applications, NFTs, and cultural products. The Blizzard Fund's funding mainly comes from the Avalanche Foundation, Ava Labs, Polychain Capital, Three Arrows Capital, Dragonfly Capital, and others.
From December 2021 to early March 2022, the Avalanche Foundation collaborated with the Web3.0 development platform Moralis to conduct its largest-scale hackathon, aimed at accelerating the development of DApps, Web3 applications, and DeFi projects within the ecosystem.
In March 2022, the Avalanche Foundation announced the launch of the "Avalanche Multiverse" incentive subnet program, providing a total of approximately $290 million worth of 4 million AVAX Tokens. At the same time, Ava Labs, one of the core developers of Avalanche, also provided assistance and support for subnet development.
It can be seen that the direction of each incentive is quite clear: liquidity incentives ------ hackathons ------ subnet incentives.
TL;DR:
Avalanche's early incentives were similar to Polygon, directly targeting user liquidity mining incentives; later, Avax's incentives shifted to developers and ecological cooperation, with both funding volume and coverage being superior to competitors.
BSC does not need to incentivize users due to the traffic from CEX, focusing instead on incentivizing project parties; Fantom also adopts a similar approach.
4. Funds and Users
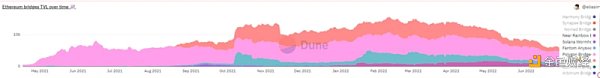
1. Bridges
The funding sources for the explosive growth of public chains partly come from CEX support, and partly from bridges. Therefore, we can glimpse the funding amounts of various cross-chain bridges to observe the public chain's explosive growth. The chart clearly shows significant inflows into Polygon (April), Avalanche (August), Near (August), and Fantom (October), which led to the subsequent explosion of projects on each chain.
Avalanche launched the bi-directional cross-chain bridge (AEB) and Avalanche Bridge (AB) with Ethereum in February last year. Its features include low fees and fast speeds ($1-5, with any cross-chain mechanism's transaction fees mainly occurring on Ethereum, but in the AB mechanism, transactions on Ethereum are ordinary transfer transactions that do not require calling contracts, thus ensuring lower transaction fees).
2. TVL
TVL has decreased by over 80% from its peak, performing at levels comparable to SOL and BSC, second only to ETH, but better than other chains. From a coin-based perspective, the funds on the entire Avax chain have not shown significant outflows, but rather an upward trend, clearly outperforming competitors (mainly due to stable contributions from Aave), with Near showing a similar trend.
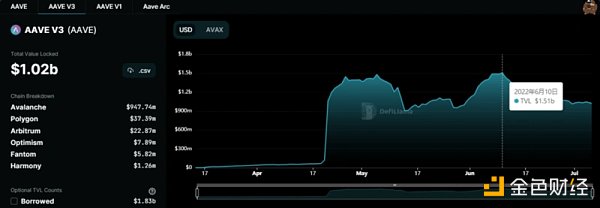
Aave accounts for nearly half of the TVL across all ecological projects, largely due to its minimal decline, with only a 30% drop from its peak, while other projects have seen declines of 70%-90%.
However, it is important to note that Aave V3 has 90% of its share on Avalanche, which is certainly related to token incentives, but it also indicates that the Avax ecosystem is developing well.
In terms of quantity, among the top 10 projects by TVL, 7 are native projects, placing them at an upstream level among EVM-compatible competing chains.
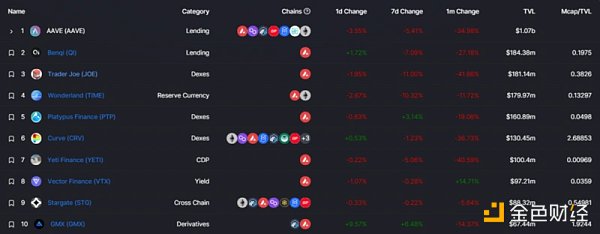
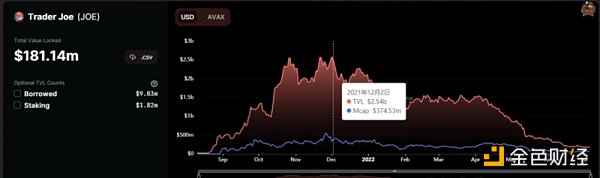
From an ecological segmentation perspective, it is also quite rich and healthy, with both large cross-chain protocols (Aave, Curve) and native gems (TIME, Traderjoe, Benqi). The categories include DEXs serving as infrastructure (general and stablecoin exchanges) and lending, yield aggregation projects and insurance in DeFi Lego, DeFi 2.0 (Defrost (Abracadabra), TIME (OHM)), the once-popular GameFi (Crabada), and projects that have strategically migrated from other chains (NFT platform Kalao migrating from Wax).
In terms of coverage, DeFi and GameFi have not been missed. The rebound of TIME exceeding OHM's market cap also indicates Avalanche's ability to generate momentum and popularity.
3. Traffic
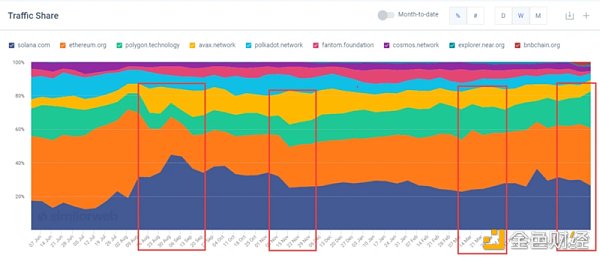
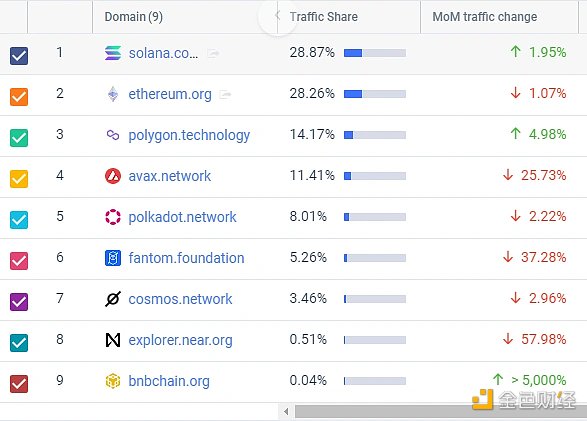
From the official website traffic over the past year, SOL and ETH have consistently occupied over 60% of the total share; Polygon and Avax hover around 10%-20%; other chains generally account for single digits.
In terms of trends, Avax's incentive programs in August, November, and March had a significant positive impact. However, after losing incentives, there has been a decline in the last two months; Ftm shows a similar trend, but the decline is more pronounced; SOL and Polygon have generally maintained high levels, with Polygon's rise being significantly related to the recent hackathon; Near has maintained an overall upward momentum this year.
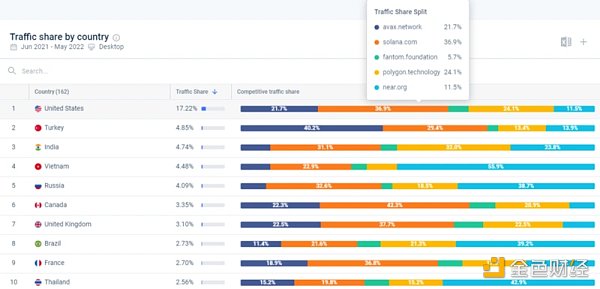
From the geographical perspective of visits, there are also noticeable characteristics: Avax has a Turkish background, Polygon has an Indian background, and Near has an Eastern European background (curiously, Near has significant traffic in Vietnam and Thailand?). However, in terms of magnitude and uniformity of distribution, Avax and Polygon are basically at the same level, lower than SOL and Near.
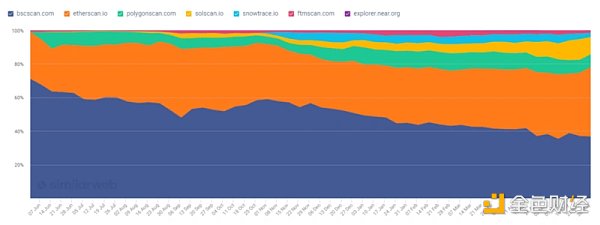
Looking at the traffic of each blockchain explorer, we believe this metric better represents real/retained users than website traffic. From the total visits over the past year, ETH and BSC have significantly larger shares, but BSC shows a continuous downward trend; SOL has the fastest growth; Polygon / Avax / Ftm have retained a certain amount after peaking; Near is the lowest but also shows an upward trend.
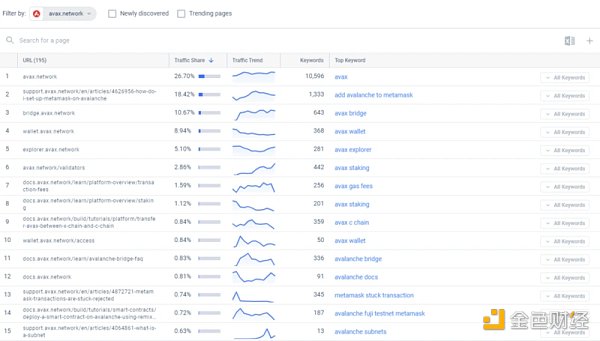
From the natural search of hot keywords, the most searched terms for each chain are several conventional categories: wallet, bridge, explorer.
Avax is most concerned with relatively conventional, application-oriented topics, while future-oriented topics like Subnet receive very little attention. Ftm and Polygon show similar situations, as they are both EVM chains with applications available from the start. Notably, searches for Polygon's Miden and Zero, which are more technical in nature, are also scarce.
On the SOL side, in addition to conventional keywords, Status, Rpc, and NFT are more frequently searched, reflecting the chain's characteristics: NFTs are booming, and there are frequent issues with Status.
Near's NFTs are also searched frequently.
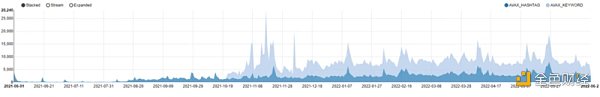
From W3's self-created tool "Twitter Hot Keyword Search Chart," we can observe that Avax's Twitter search volume has been on the rise since August last year, peaking in November, and maintaining a relatively high level for the following six months, with a downward trend only in the last month.
TL;DR:
From the perspectives of users, funds, and traffic, SOL is undoubtedly still the NO1 among altL1s due to its previous application explosion, Near is a dark horse worth observing, and Polygon and Avax are at the same level, with Ftm performing poorly.
5. Developers
Compared to user and fund flows, observing public chain developers may be a better indicator of a public chain's future development. We will look at the following dimensions.
1. Public Chain Development Activity
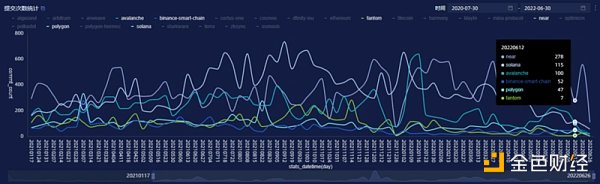
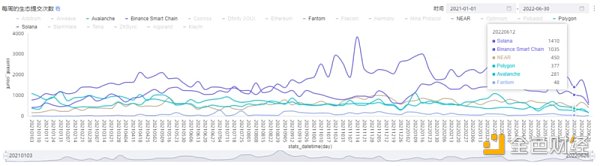
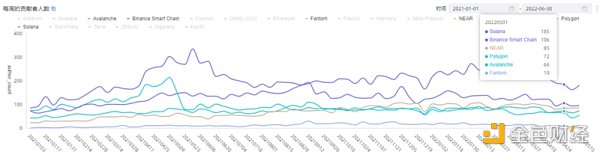
From W3's self-created tool "Public Chain Developer Statistics Chart," we can observe the situation of various public chains and draw the following conclusions:
Both the absolute number of code submissions and the number of active developers indicate that Near, SOL, and Avax are at the forefront, showing that they have done more work on public chain updates and iterations. After experiencing a period of active development last year, the development activity of each public chain has somewhat declined, especially noticeable in SOL and Avax, while Near has shown a completely different trend ------ maintaining last year's activity level and showing an upward trend, indicating that there is still much optimization work to be done at the underlying level, and the team is actively building.
2. Ecological Development Activity
Compared to the development activity of the public chain itself, the development activity of ecological projects is a more effective indicator for observing the development of the public chain ecosystem.
In terms of scale, SOL and BSC have long dominated the top two positions, followed by Near / Polygon / Avax, with Ftm at the bottom.
Development activity fully reflects the situation of public chain explosions:
BSC and Polygon started gaining momentum in the first quarter of last year, peaking around May, and then showing a downward trend (especially noticeable for Polygon), with many subsequent projects on BSC, but a significant loss of developers;
SOL's trend is strong, with the number of code submissions increasing ninefold over the past year, and the number of developers nearly quadrupling, peaking in February this year. Although there has been a significant decline in indicators this year, it still maintains a high level (especially in terms of the number of developers);
Near has performed the best in both metrics, consistently showing an upward trend, with developer growth exceeding fourfold, the largest increase among all public chains, and the smallest decline;
Avax has been relatively stable, with data increasing 2-3 times, peaking in September last year before starting to decline, with growth not matching SOL and Near, and the decline being relatively larger.
Overall, SOL, Near, and Avax have all performed excellently, especially in developer retention, with retention rates of 68%, 80%, and 60% from their peaks, respectively, basically reaching ETH's level (72%). In contrast, other public chains have retention rates below 40%. However, Avax and Near are slightly smaller in scale, so their ability to maintain this level needs to be continuously observed.
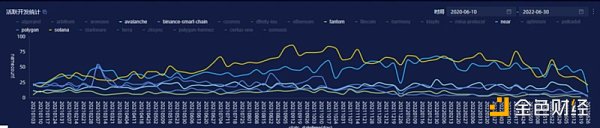
3. New Developer Traffic
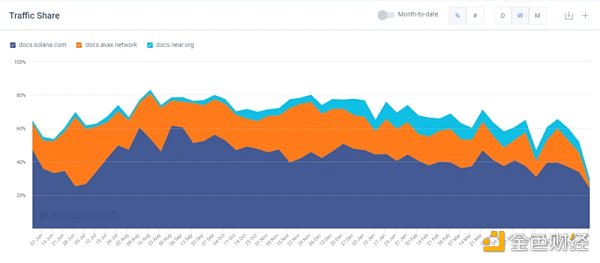
Finally, we will observe the traffic of developer documentation for each public chain over the past year to assess new developer traffic (only selecting SOL, Avax, and Near, as other chains have too many interference factors and are not meaningful for reference).
We can draw similar conclusions:
SOL has the largest scale, with a trend similar to Avax, experiencing a decline after the peaks in the third and fourth quarters of last year, but still maintaining a certain amount of traffic;
Near has the smallest scale, but its trend differs from theirs; although there has been a slight decline recently, it maintains an overall upward trend.
TL;DR:
From the developer dimension indicators: SOL is the strongest overall, Avax is second, Near has the fastest growth, Polygon and BSC are large but on a downward trend, and Ftm is the weakest overall.
6. Subnets and Collaborations
1. Subnets
Subnets can be private or public chains and can be customized according to client needs. Currently, the two officially running subnets are both game-related. However, Avalanche currently lacks a communication solution between subnets, and asset transfers between the mainnet and subnets are currently handled by third-party bridges.
DFK chain
4.1 The flagship chain game DeFi Kingdom, attracted from Harmony, established the subnet DFK chain (Avalanche provides $15 million in incentives).
The DFK Subnet uses a customized EVM, combining a Directed Acyclic Graph (DAG) model within the EVM, allowing the blockchain to scale efficiently at a lower cost.
Currently, the network has only 8 validating nodes and 40,169 addresses. Recently, the network utilization rate has been below 1%, with a rough theoretical TPS estimate of 600.
SwimmerNetwork
5.14 The game Crabada, previously on the C-Chain, established a subnet.
Currently, the network has only 8 validating nodes and 24,892 addresses. Recently, the network utilization rate has been below 4%, with a rough theoretical TPS estimate of 150.
Potential Future Subnets
Shrapnel: A 3A shooting game.
Arrow Markets: A decentralized options protocol.
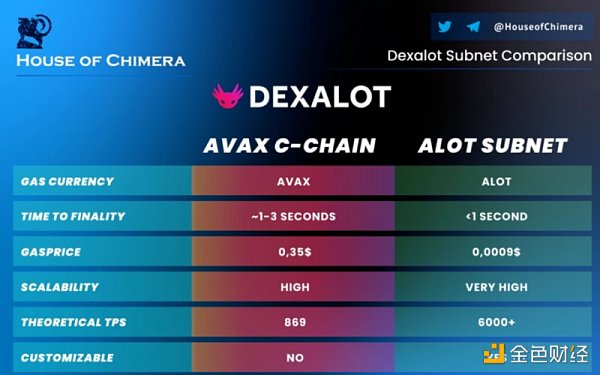
Dexalot: A high-performance DeFi subnet, with the following comparison to the C-Chain, claiming to outperform the C-Chain in all aspects.
2. Enterprise Use Cases
The adoption of enterprise-level institutions may become the next narrative focus for Avalanche. Currently, the initial collaborations do not seem to have a significant effect (needs observation):
NFT: Collaborated with the collectibles company Topps to issue a series of 2021 MLB NFT collections.
Payments: Digital payment platform Wirex announced the integration of Avalanche. This payment platform has 4.5 million users in traditional sectors.
Litigation Product ILO: Collaborated with law firm Roche Cyrulnik Freedman LLP and consulting firm Republic Advisory Services.
STO: Partnered with the U.S. STO institution Securitize, which can use the Avalanche chain for the issuance and management of private securities.
CAYG Disaster Relief Platform: Deloitte uses Avalanche for its disaster relief platform, improving efficiency and reducing costs through blockchain technology.
3. Others
3.1 Wallet Core
Ava Labs launched a non-custodial multifunctional wallet (browser extension): Core, featuring:
(1). Avalanche bridge, supporting native BTC cross-chain. Currently, over 690 BTC have been crossed, and ERC20 support will follow (https://snowtrace.io/token/0x152b9d0FdC40C096757F570A51E494bd4b943E50).
(2). Supports NFTs and subnet displays (currently DFK chain, Swimmer).
(3). Deposit and withdrawal (supported by MoonPay).
(4). Basic swap functionality.
3.2 Barcelona Avalanche Summit
From the March hackathon, we can glimpse the future direction of Avax:
The official Avalanche Foundation awarded 5 prizes and projects as follows:
EVM optimization solutions (OracleEVM).
Subnet compatible with Ledger (SubnetX, a tool for creating and managing subnets compatible with Ledger).
Management tools for creating subnets (subnet.center, an analysis and notification platform for validators, delegators, builders, and users).
Customized VM subnet solutions (AEVEREST++, based on C++, with a theoretical TPS limit of 13,500).
Creating DApps on subnets (zk-id, zero-knowledge identity protocol).
In addition to the official awards, several institutions/projects were invited and awarded:
Axelar (cross-chain communication solutions).
Covalent (API solutions).
Ankr (node services).
Aventures DAO; Chainlink.
Dexalot (DeFi subnet).
Hacken (anti-hacking).
LayerZero.
WOWswap.
Coinbase wallet.
From the award settings, it can be seen that Avax is currently focusing on exploring subnet construction, optimizing the underlying execution environment, and improving the user experience at various stages of development.
7. Conclusion
In summary,
The technical capabilities/architecture of the Avalanche public chain align with the future multi-chain trend, and capital support is at an upper-middle level.
In terms of the richness, popularity, and retention rates of ecological projects, the overall level is high, with the ecological comprehensive score on par with BSC, SOL, and Near, and higher than other competitors.
Overall, considering public chains and ecosystems, SOL > Avalanche > Near > BSC > Polygon > Ftm (As Cosmos and Polkadot are still in relatively early stages of construction, with their ecosystems just beginning to take shape, they are not included in this "ecological comparison section," but we highly recognize the direction of the public chains and the capabilities of their teams, and will continue to observe them closely).
Avalanche's ecosystem has the narrative capability of customized subnets/VMs and enterprise construction, along with the ability to generate momentum in grassroots communities (capturing projects, high-level imitations), and its ecosystem may follow a different path from ETH and altL1/L2 in the future, warranting continued observation.
Future Observations
Progress in enterprise collaborations.
Interactivity and performance of subnets.
Explosive growth of ecological projects (including imitations).
Whether community popularity, funding, and developers can be sustained.
Hosting of hackathons and the landing of projects.
 Risk warning
 Risk warning

Popular articles