a16z released the 2023 Cryptocurrency Market Status Report: Seven Key Points

 This report reflects that the cryptocurrency industry may be performing healthier than market prices suggest, as well as the development and continuous innovation cycle that a stable product needs to undergo.
Original Title: state of crypto report 2023
Authors: Daren Matsuoka, Eddy Lazzarin, Robert Hackett, Stephanie Zinn
Compiled by: Biscuit, ChainCatcher
Introduction: How to persistently track the progress of the crypto industry beyond the financial dimension? We created the State of Crypto Index, an interactive index that is updated regularly to track the growth of the industry.
Emerging technologies are in a cycle of development. In the cryptocurrency space, this cycle includes boom periods and the so-called crypto winters. In our recently released state of cryptocurrency report, careless observers may overlook the rapid progress being made in the crypto industry. Major infrastructure improvements like the Ethereum Merge do not make headlines as frequently as bankruptcy events.
Our 2023 report aims to address the imbalance between noise from price fluctuations and tracking important signals, including the progress of Web3 technology's persistence. Overall, the report reflects that the crypto industry may be healthier than market prices suggest, as well as a stable product development, release, and continuous innovation cycle.
This year, we also launched several new crypto status indices, which are interactive tools that track the health of the crypto industry from a technological rather than financial perspective. The index represents the weighted average monthly growth of 14 industry indicators—from the number of verified smart contracts to the number of trading wallets, and so on. In other words, the index displays the innovation and adoption rates of Web3 in one chart. The tool is also interactive, allowing users to adjust parameters to form their own views.
Key Points:
1) The blockchain has more active users and more ways to participate. Active addresses reached 15 million last month, setting a new record. This data has doubled over the past two years as more applications and services (like blockchain games) provide new ways for people to engage.
2) The continuous emergence of innovative applications, with DeFi and NFT activity seemingly on the rise again. After a period of frenzied speculation and subsequent cooling, it seems that more people are buying NFTs in recent months. Meanwhile, trading volume on decentralized exchanges exceeded $100 billion last month, marking positive growth for the third consecutive month.
3) The number of active developers in the crypto industry remains stable. Developers attracted by the 2020 bull market are still sticking around. Last month, nearly 30,000 developers contributed to crypto projects, a figure that has steadily grown by over 60% in the past three years.
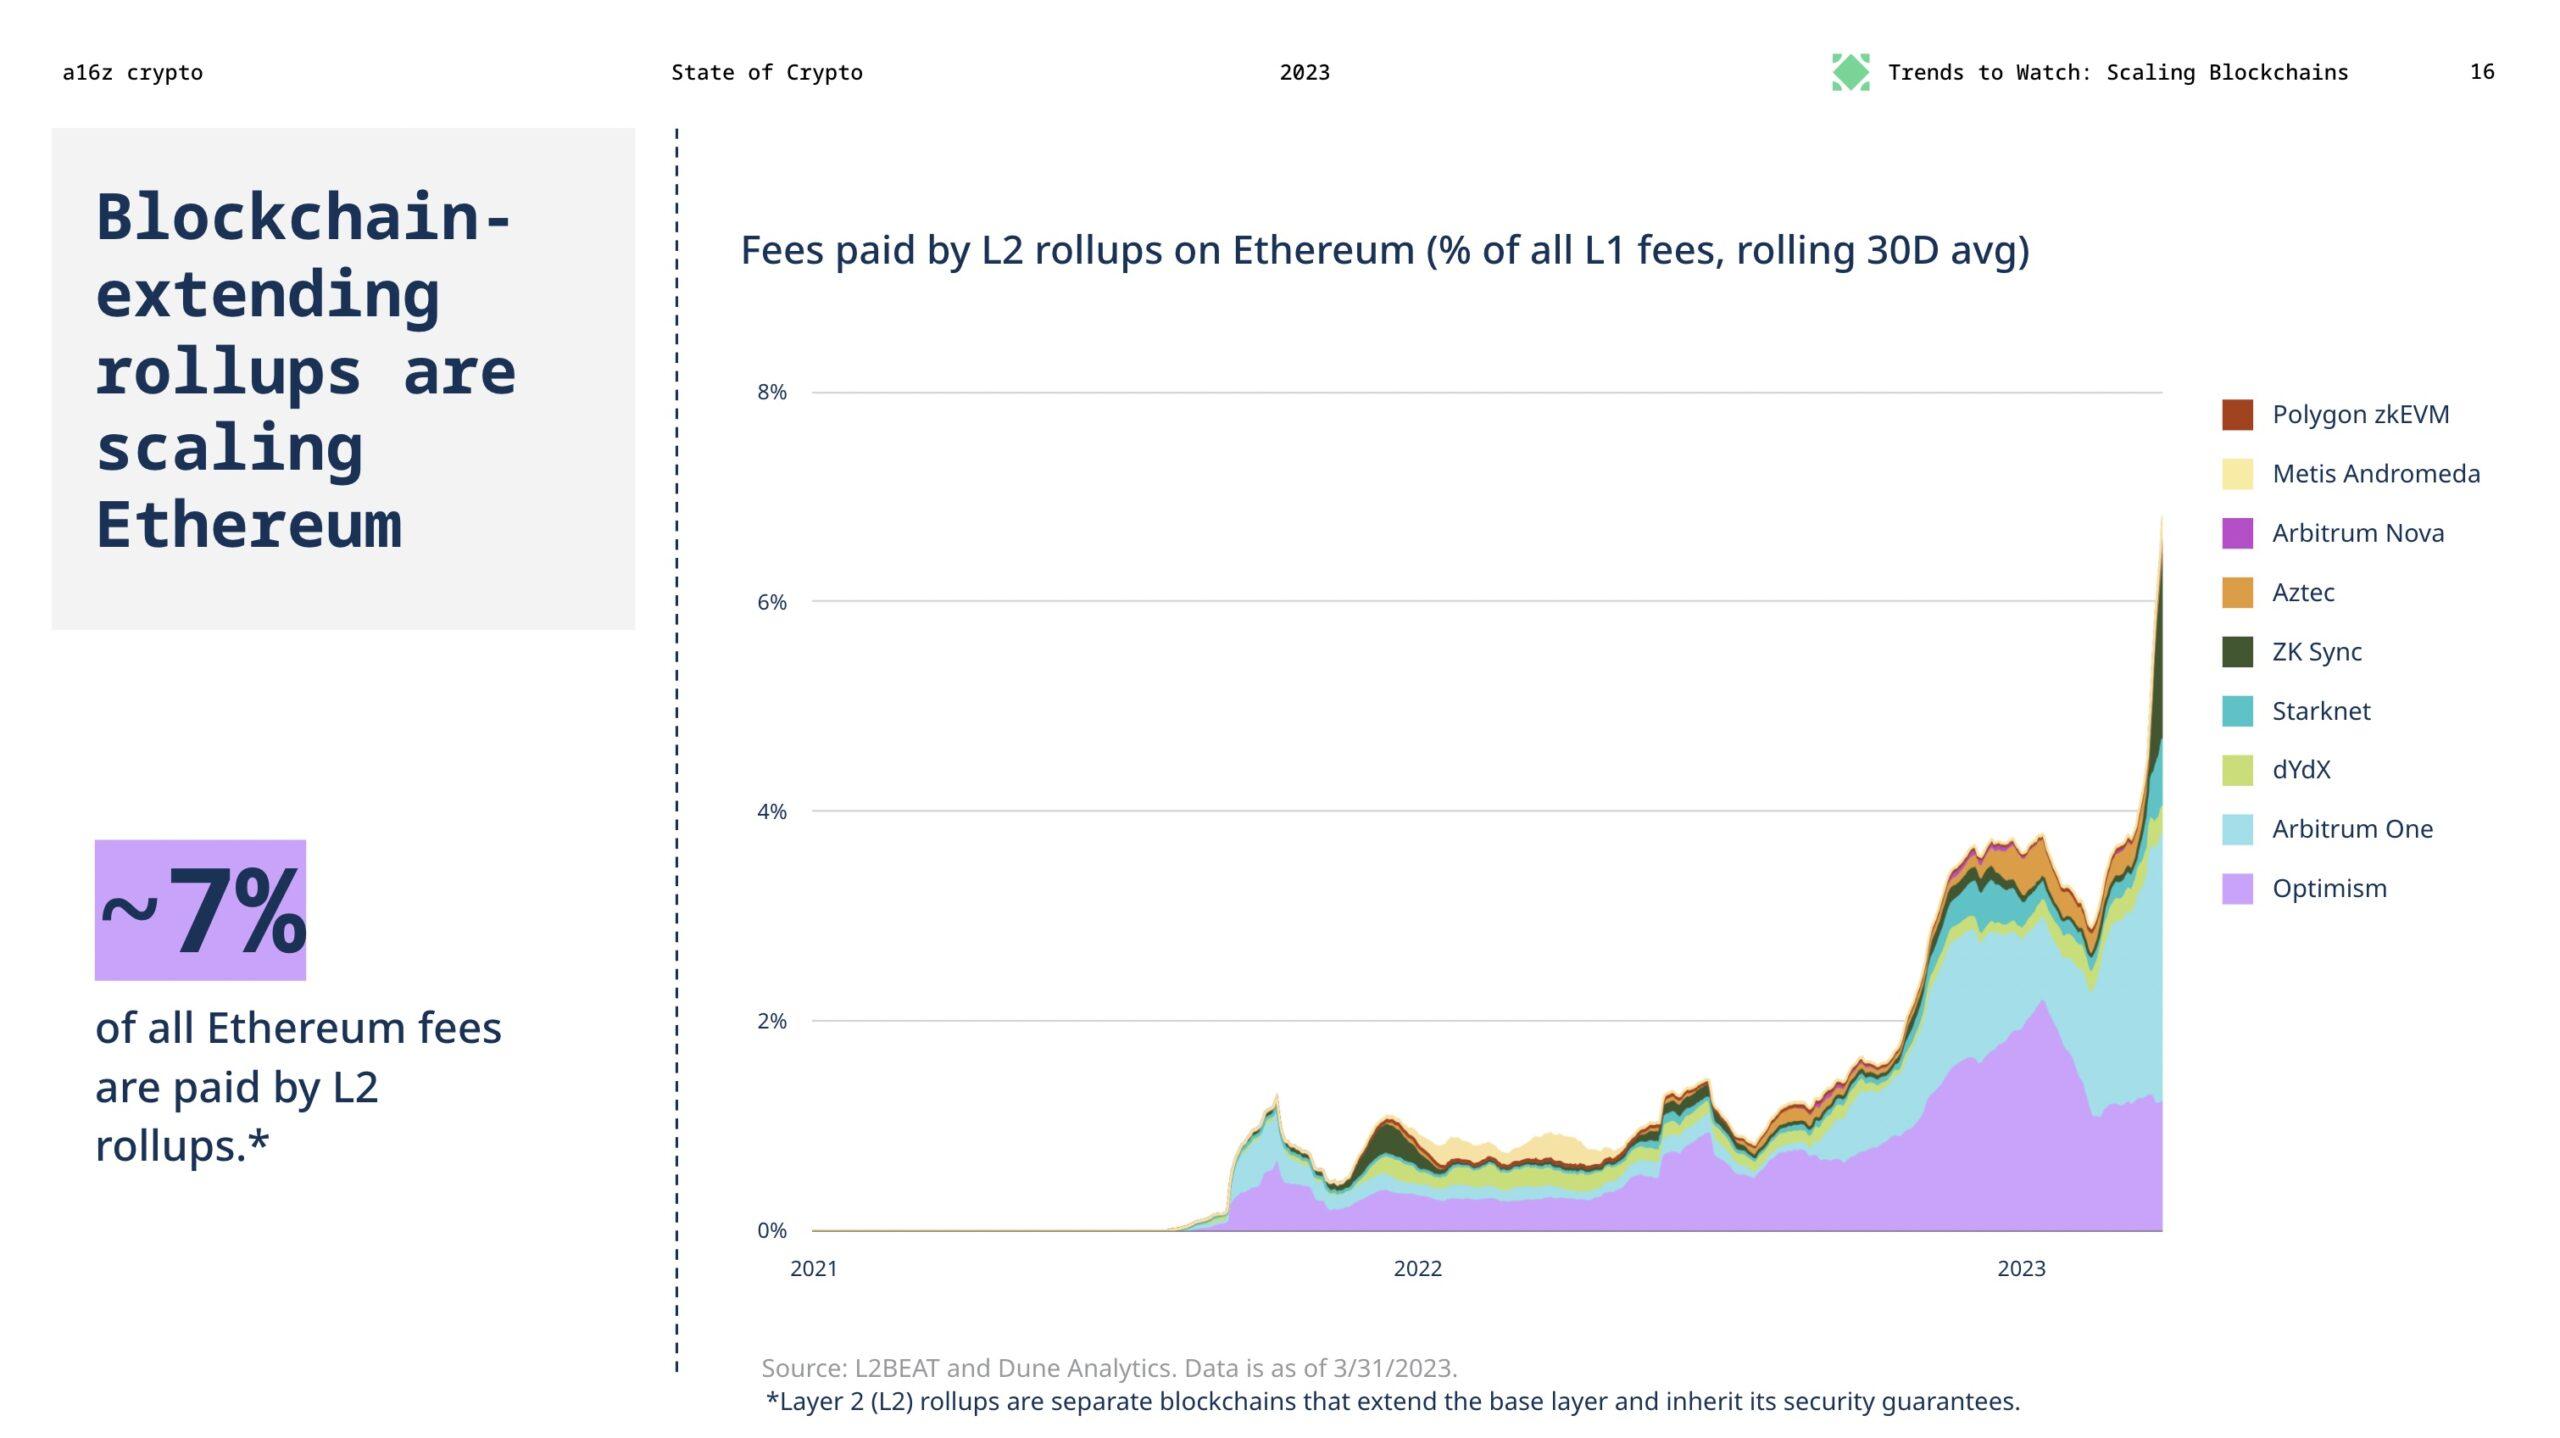
4) The blockchain is expanding through new avenues. Numerous crypto projects are working to scale blockchains, facilitating more transactions using various methods and technologies. Last year, Layer 2 scaling solutions accounted for 1.5% of total fees on Ethereum payments, and that figure has now reached 7%.
5) The availability of new technologies has increased significantly. Development work on zero-knowledge systems is advancing at an astonishing pace, which will further unlock scalability and privacy applications for blockchains (including applications in AI). Data indicates positive trends in ZK-related research, developer activity, and usage.
6) The U.S. is losing its leading position in the Web3.0 space. From 2018 to 2022, the proportion of cryptocurrency developers in the U.S. decreased by 26% compared to the rest of the world. Regulation should encourage crypto developers to safely drive technological innovation and development in the U.S.
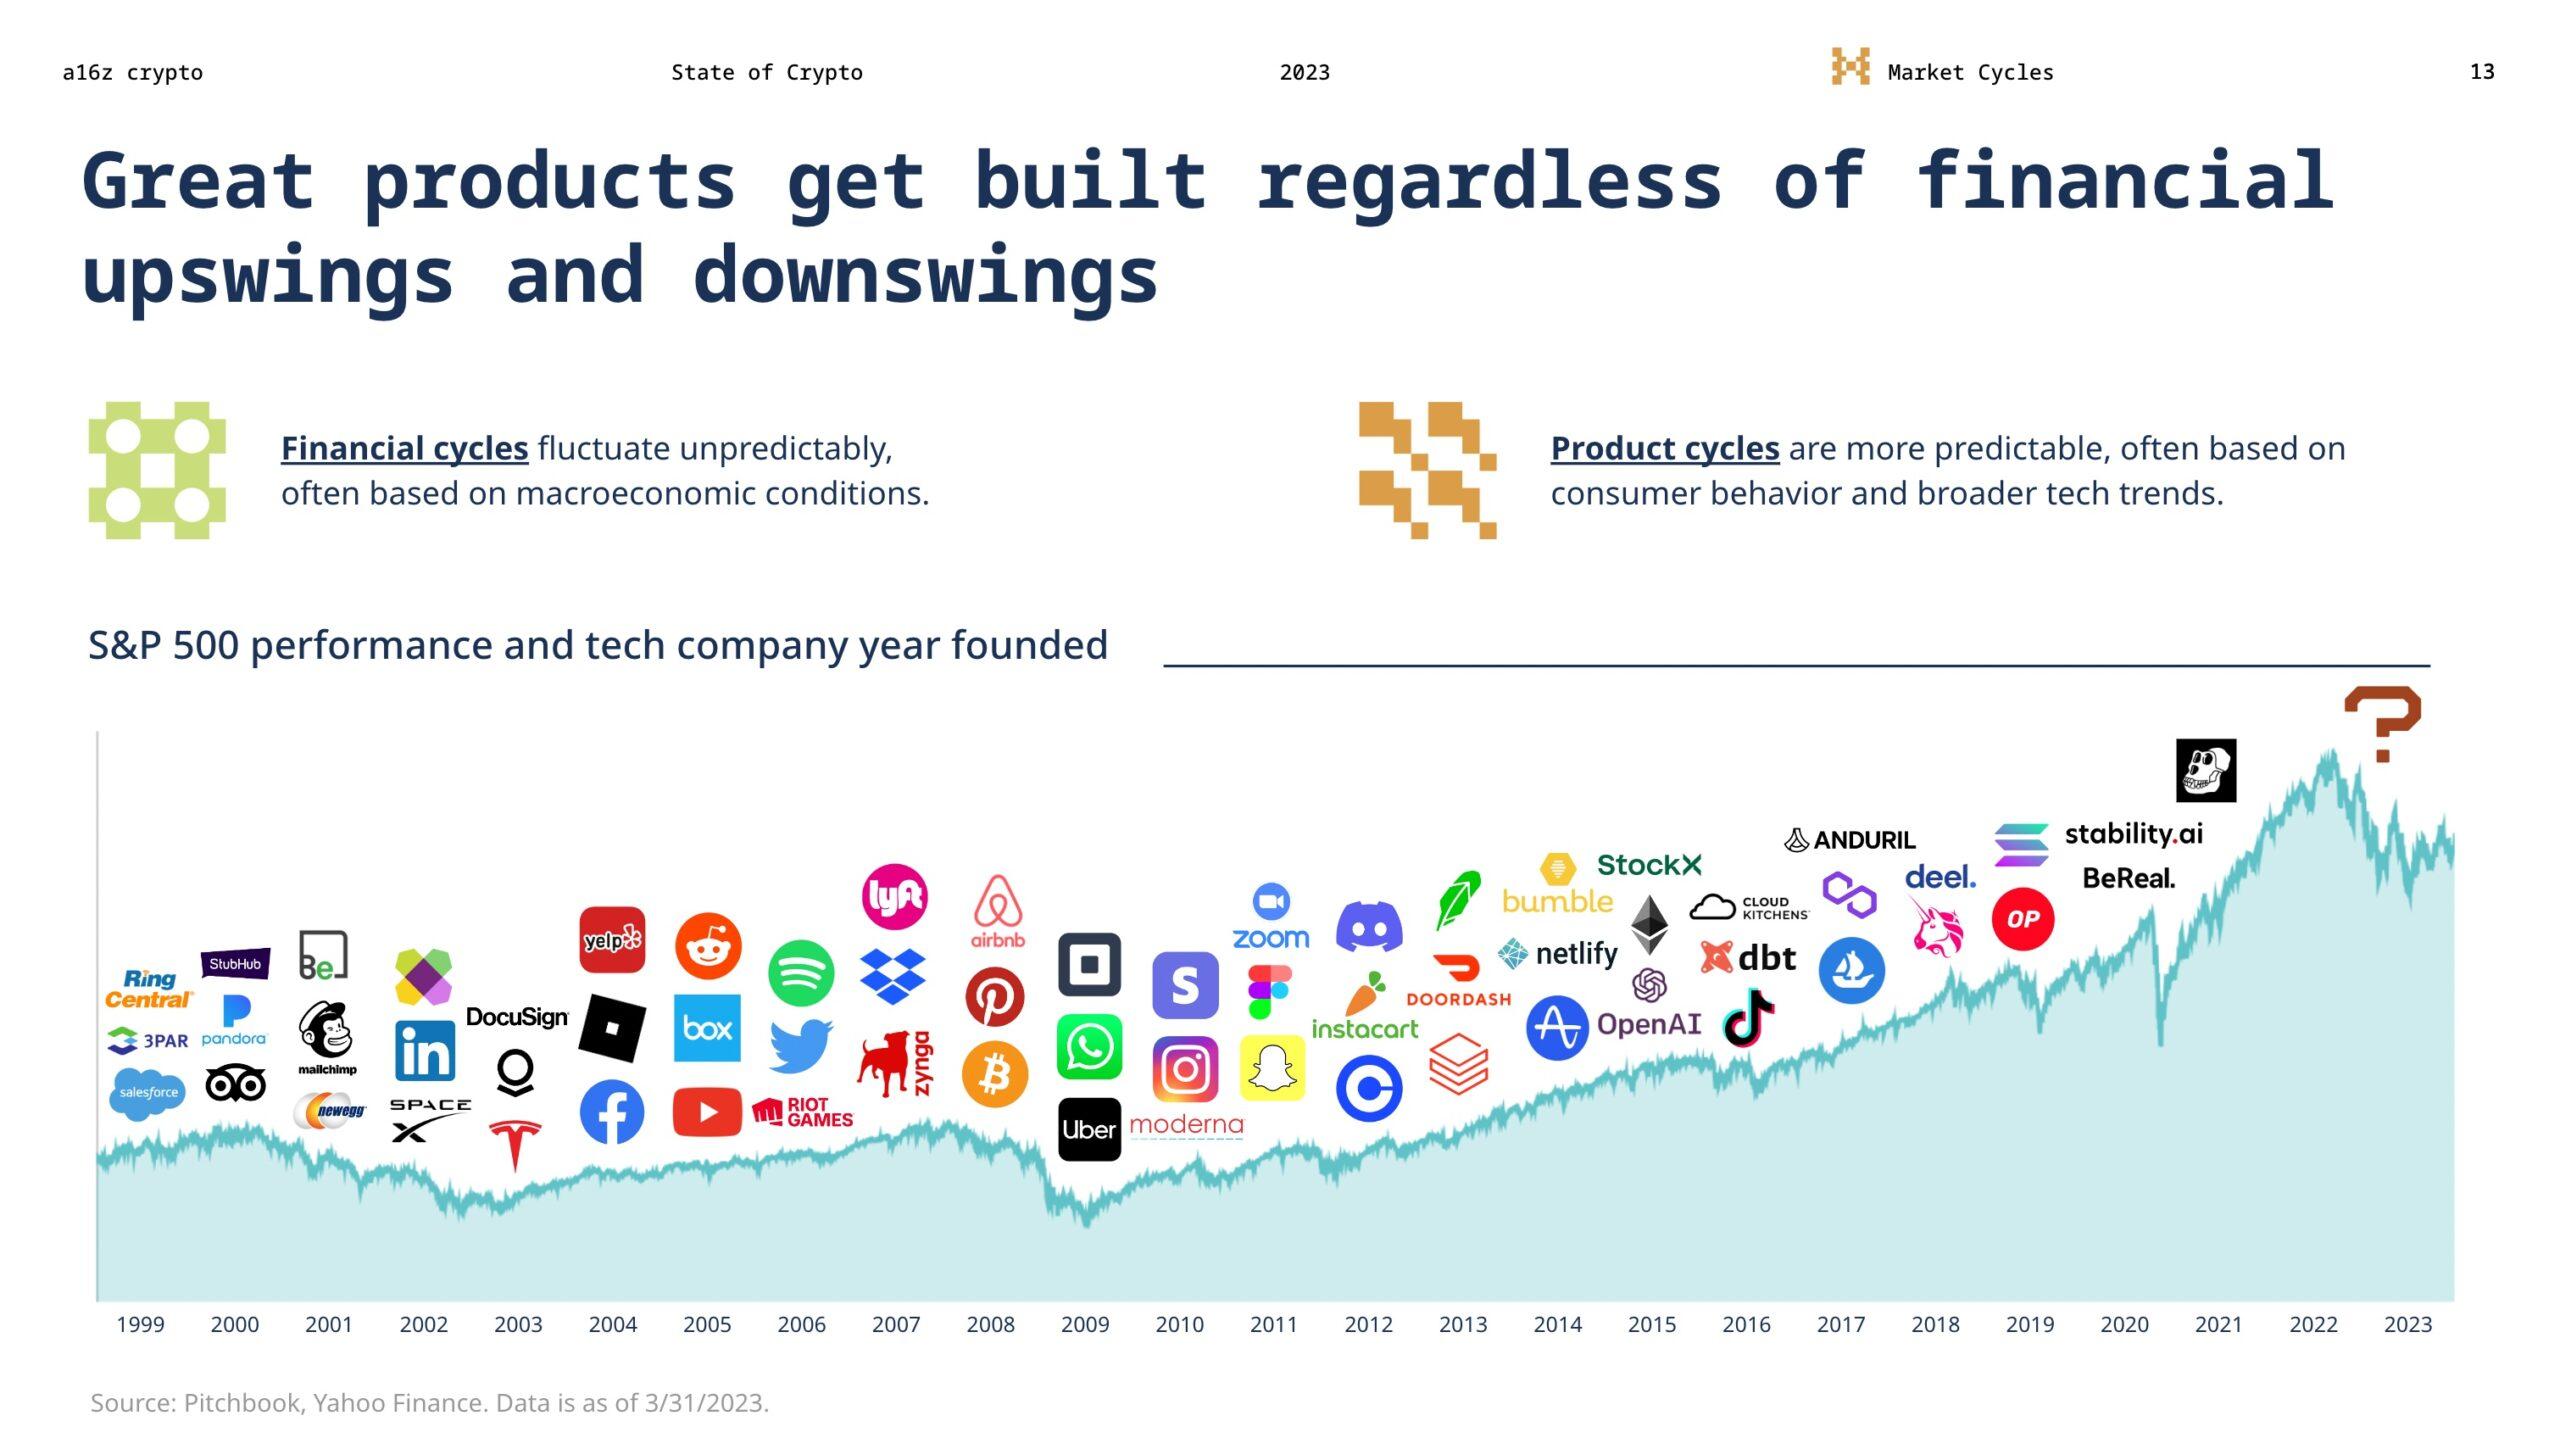
7) Progress in exploring key indicators over short cycles. Over the past decade, market capitalization, developer activity, and funding activities have steadily increased. A more predictable pattern has emerged from short-term fluctuations: a price innovation cycle driven by price volatility that advances new ideas.
1. The blockchain has more active users and more ways to participate
After the high prices of 2021, the industry seems to be stabilizing this year: speculation has cooled, and the story of how people continuously use and interact with Web3 is beginning to unfold.
We are seeing more monthly active addresses than ever, which are unique addresses that transact on-chain each month. Last month, we saw 15 million addresses trading on-chain, more than double the number from two years ago. One possible explanation is that there are now more ways to engage with blockchain and Web3 applications. From DeFi to Web3 games (over 700 games launched last year), various new applications create interactive addresses for users without requiring them to download or connect a wallet.
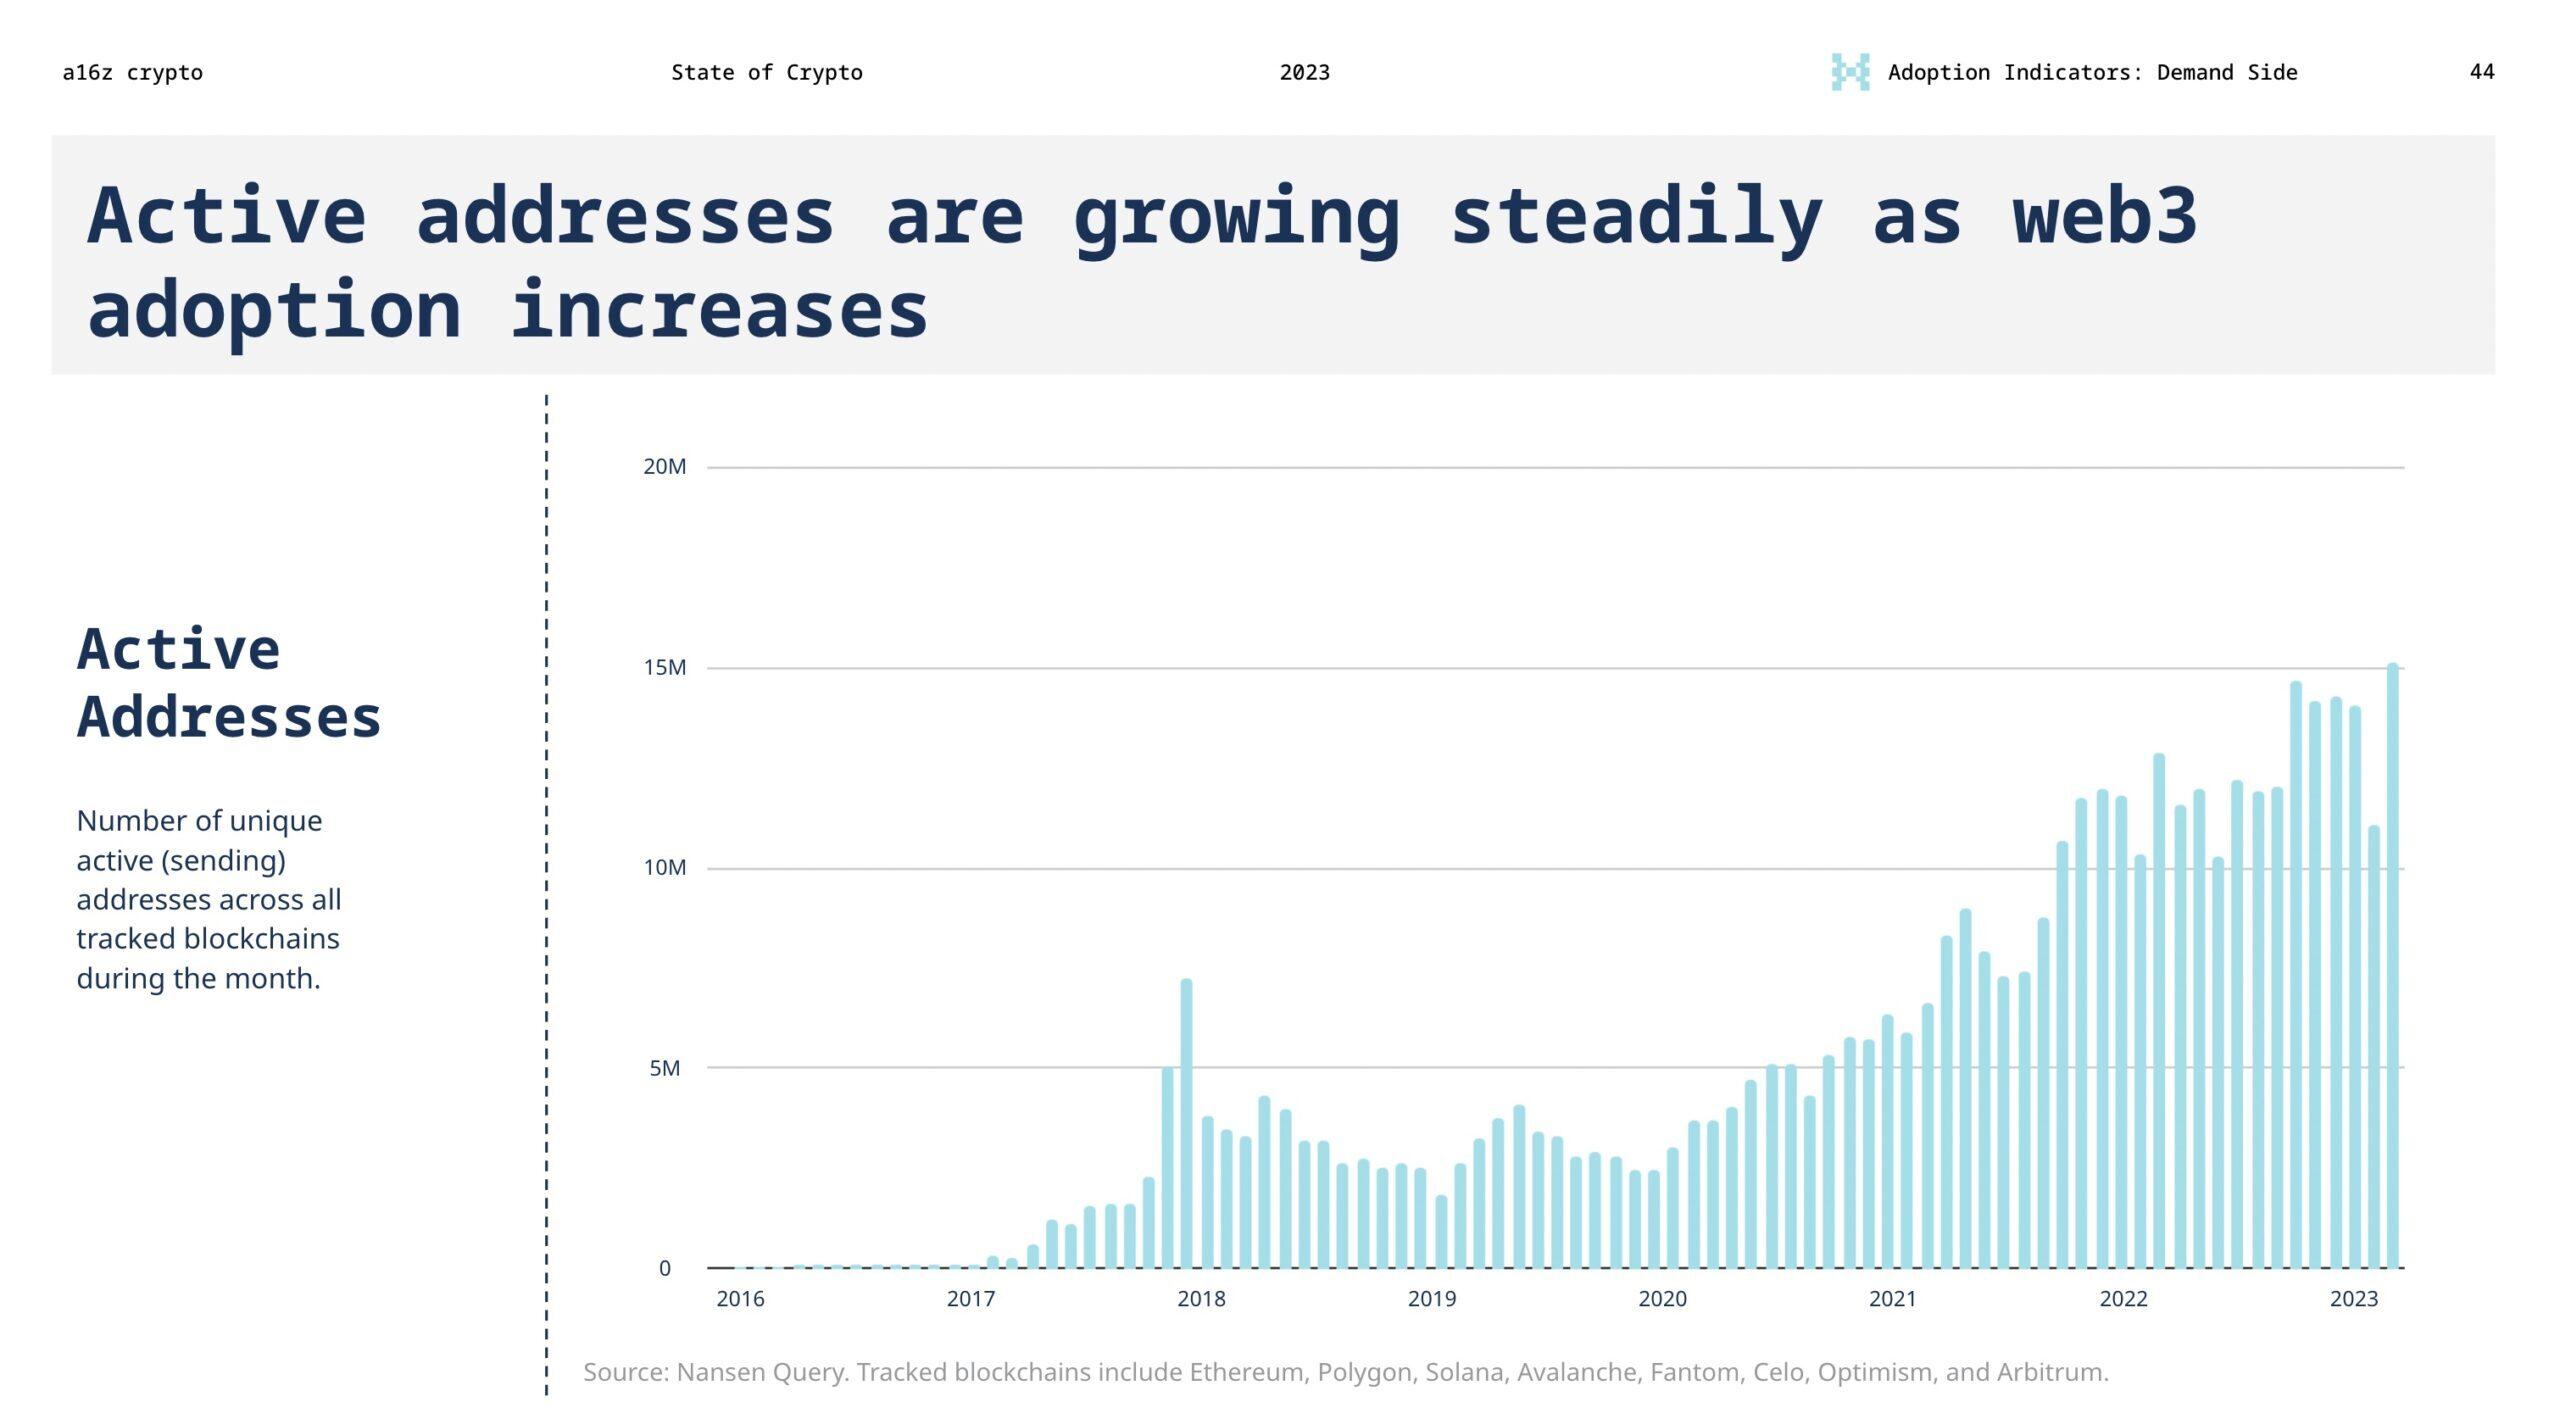
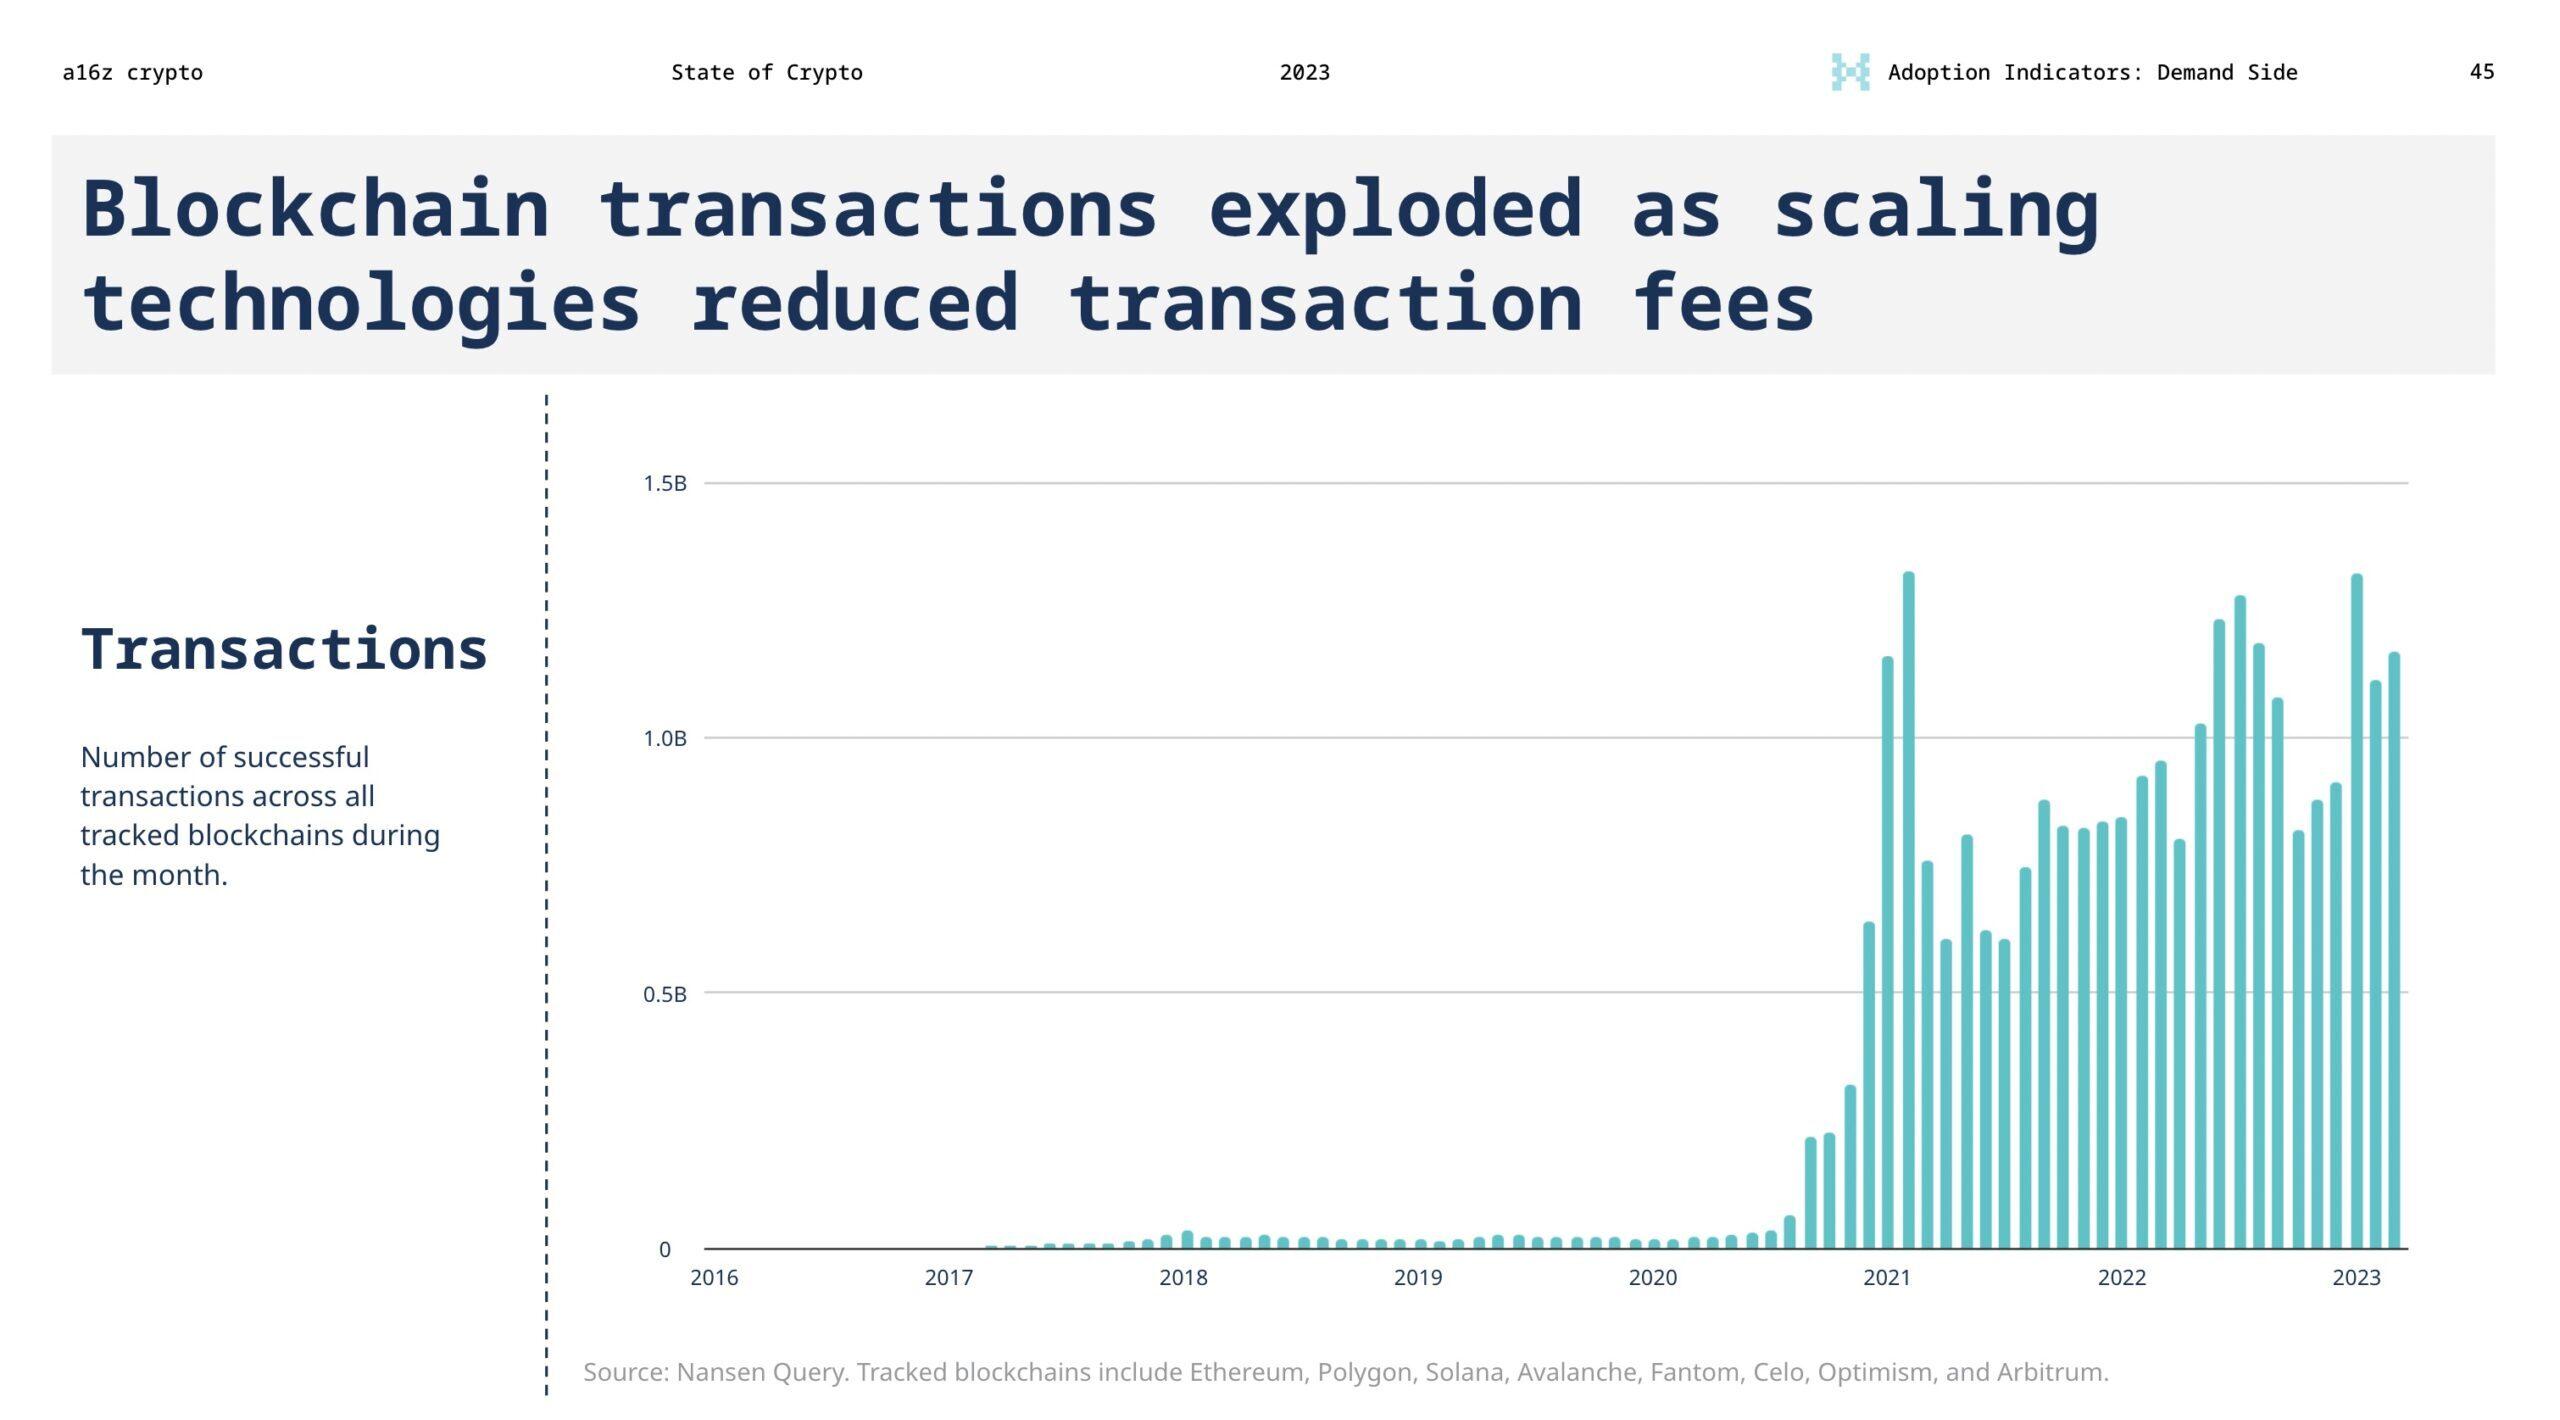
Additionally, better tools and scaling technologies have attracted more transactions with lower gas fees. Notably, the total number of blockchain transactions has grown by over 50% in the past two years.
2. DeFi and NFT activity seems to be heating up again
Meanwhile, DeFi and NFT activity appears to be rising again after a decline from the highs of 2021. With speculation cooling, these areas seem to be seeing more substantive use cases, including lending, remittances, art, collectibles, and on-chain gaming.
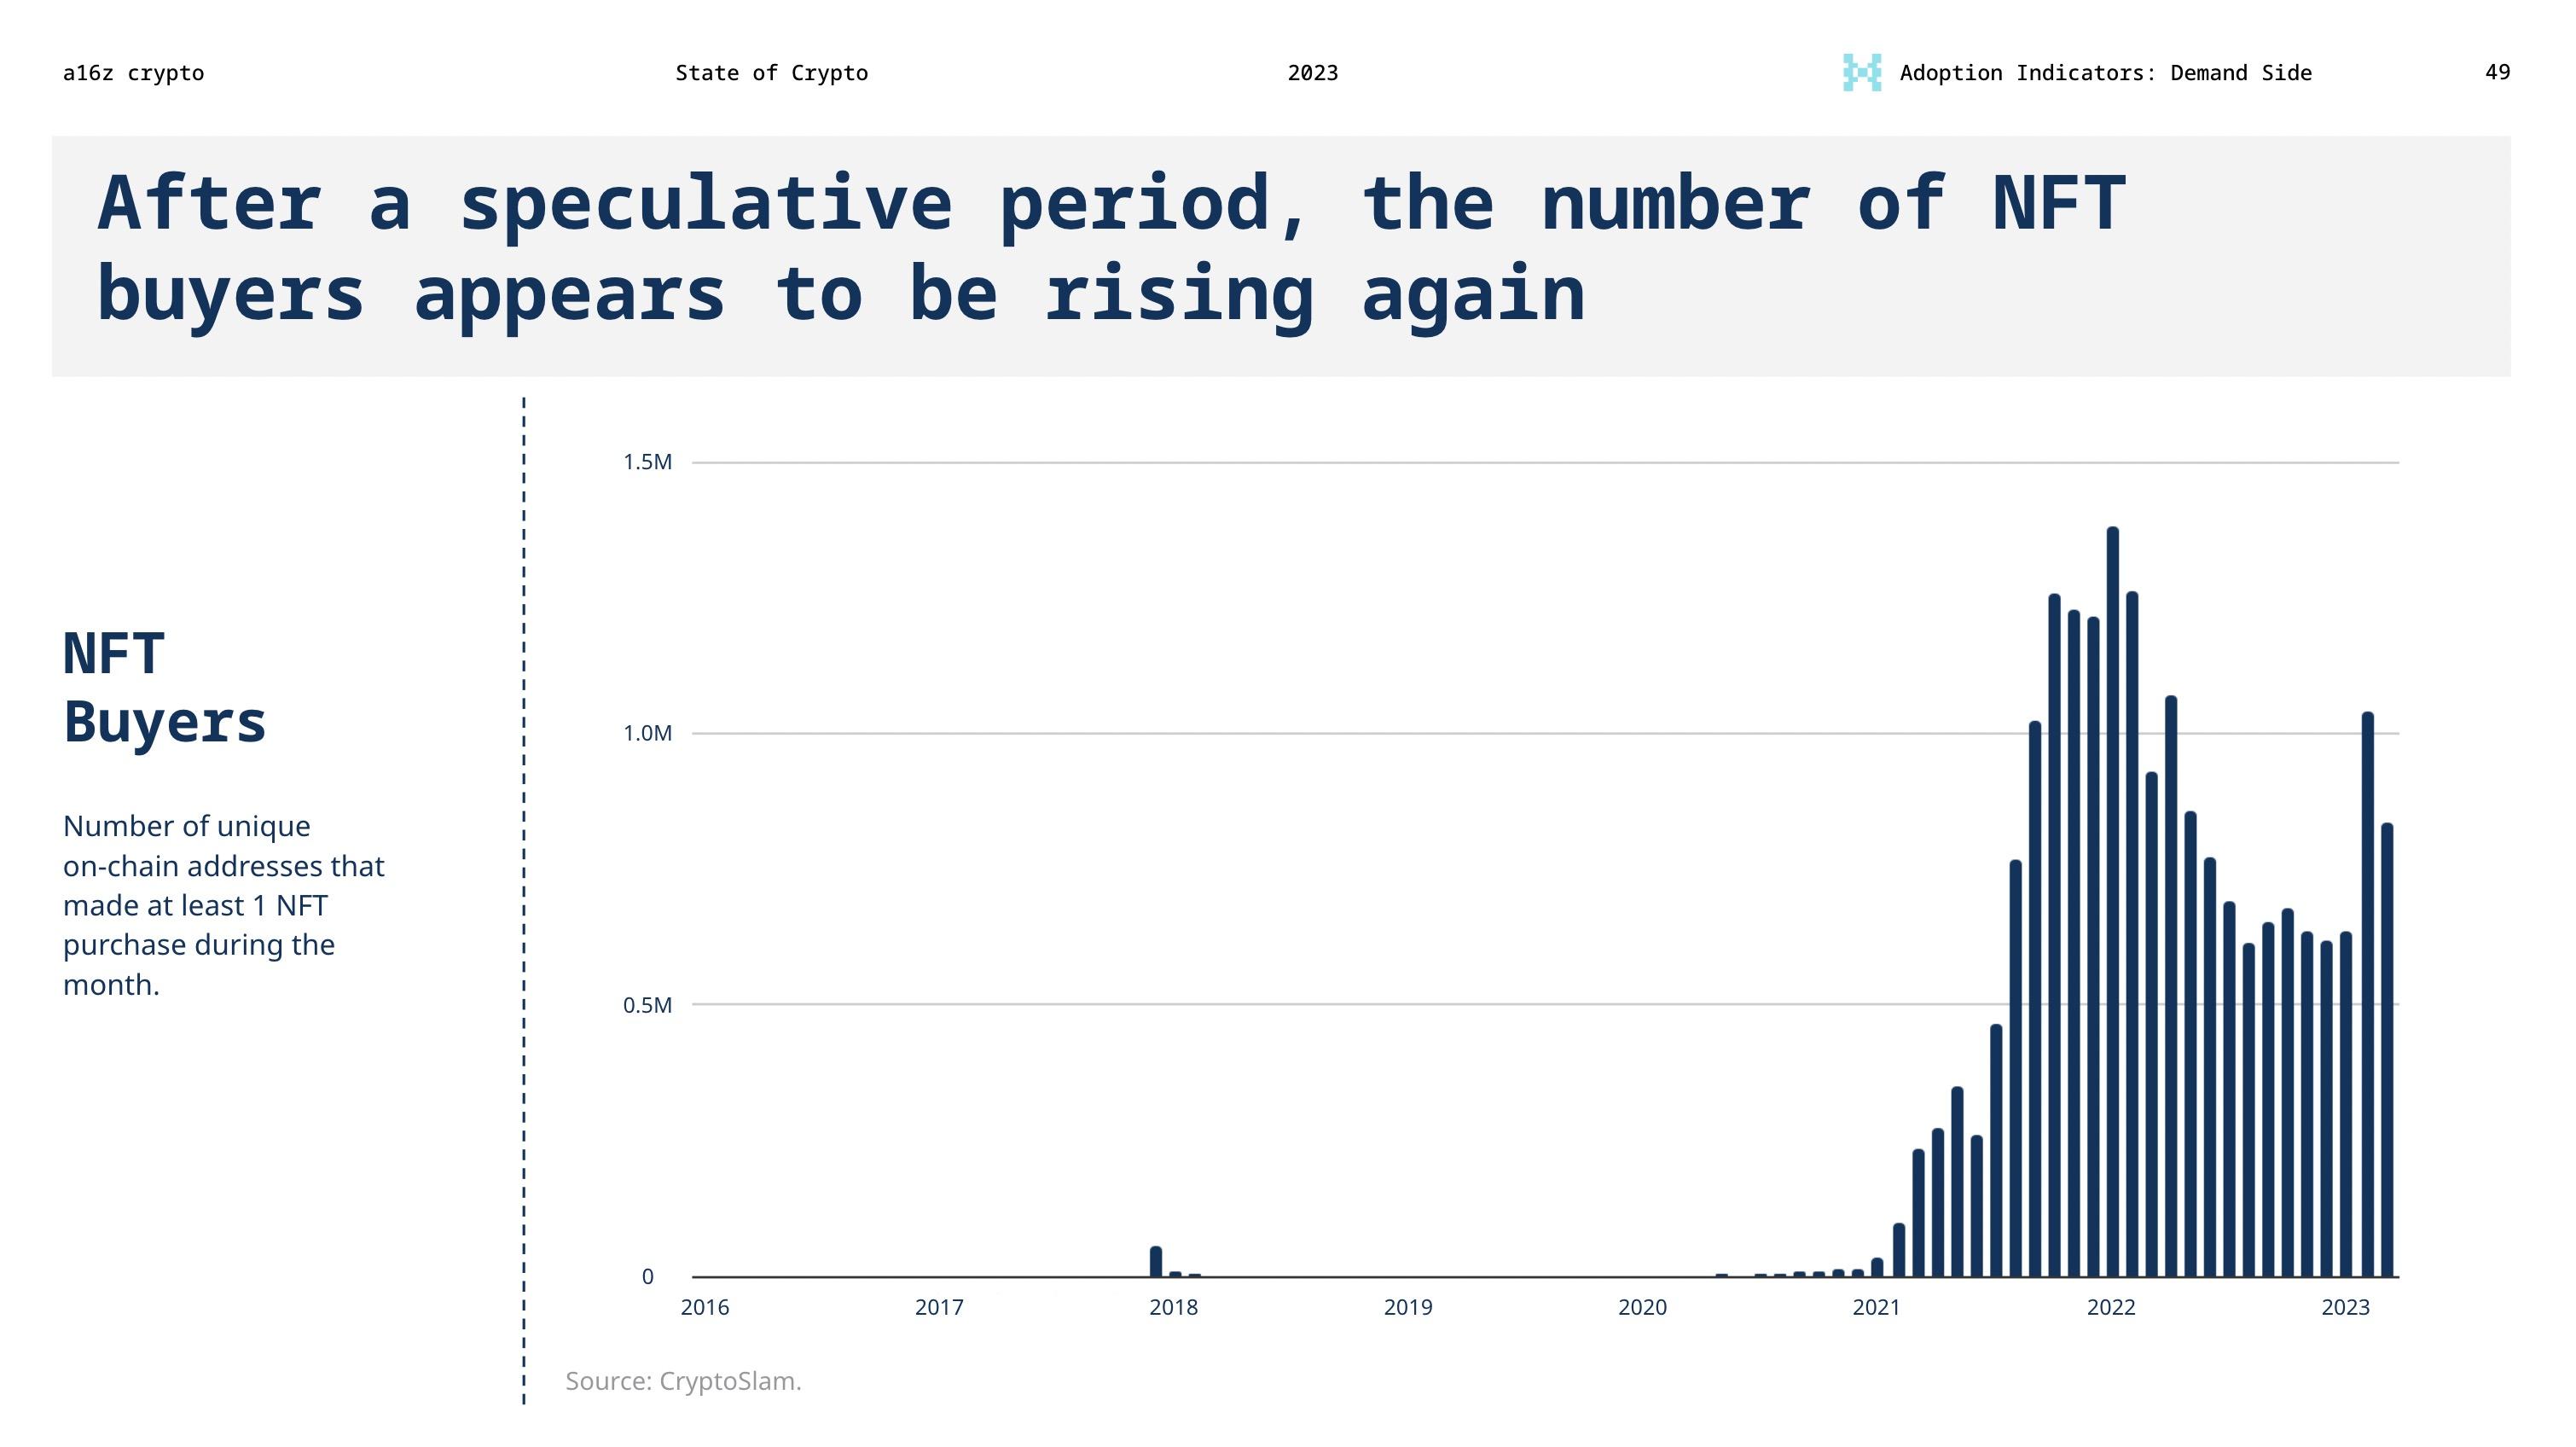
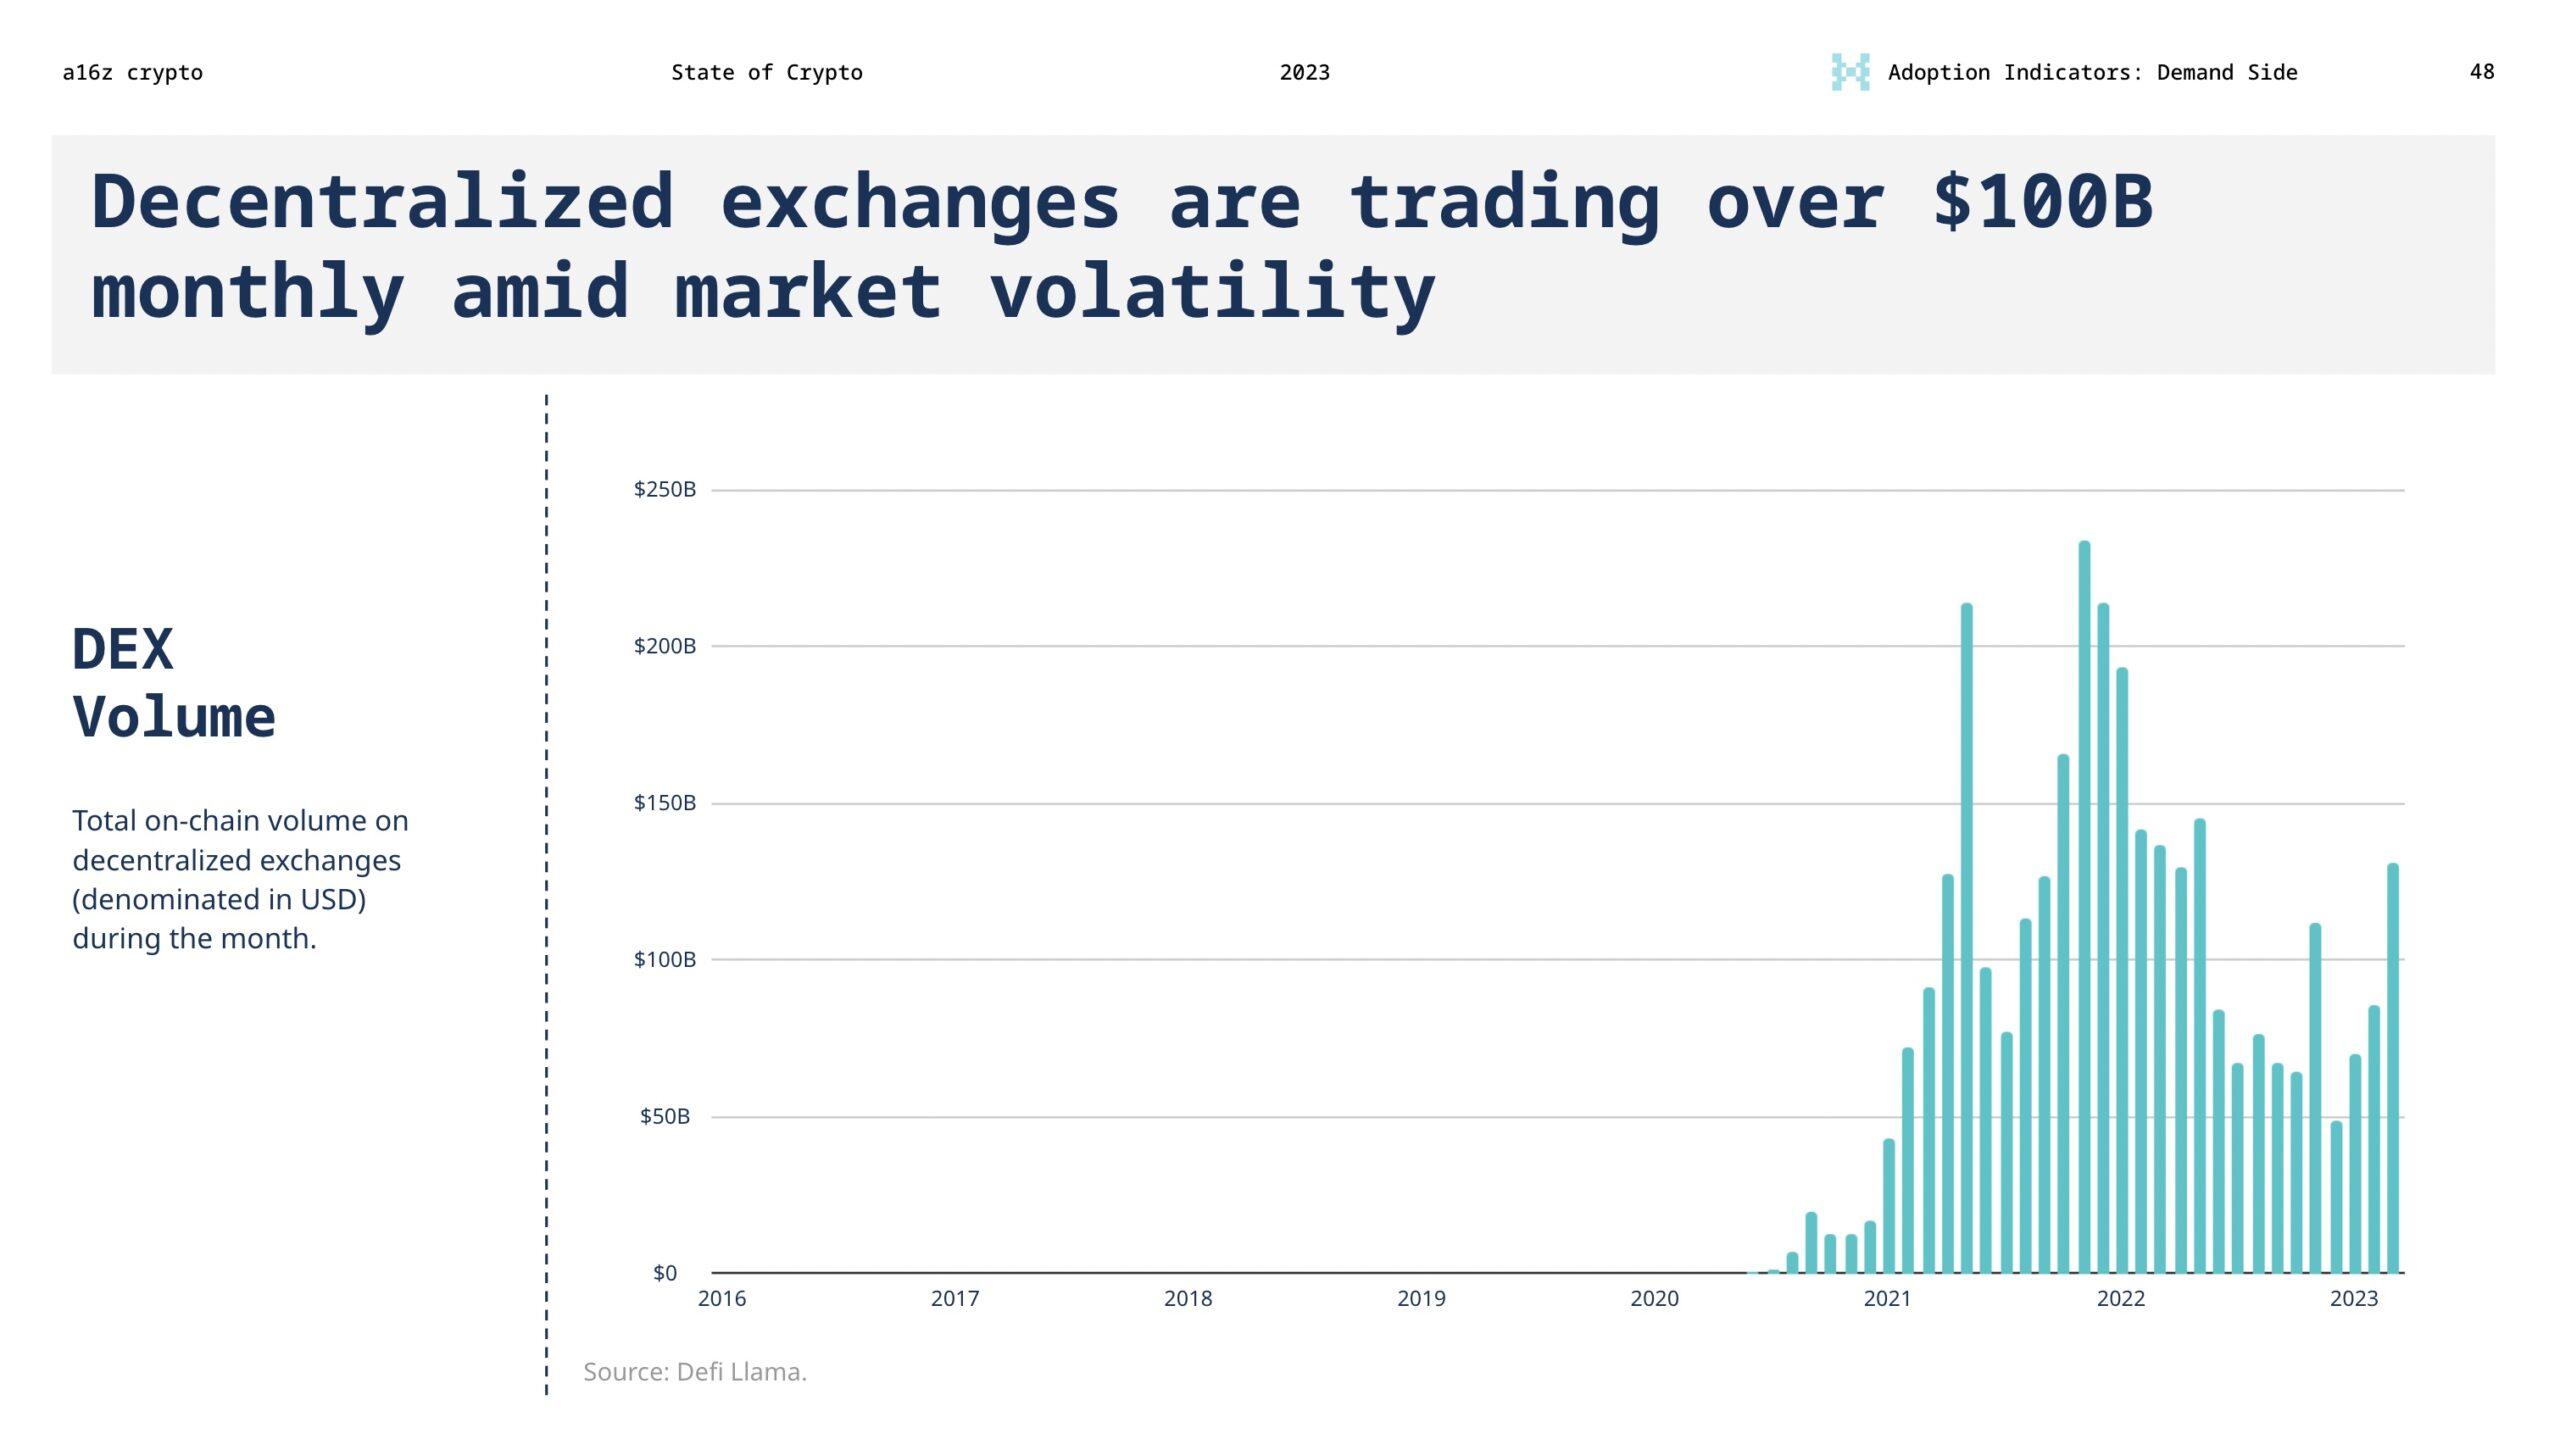
Nevertheless, the initial vision of NFTs and DeFi changing the internet economy still exists. For example, in recent months, we have seen an increase in NFT buyers and DEX trading volume. In fact, the trading volume on the decentralized exchange Uniswap has exceeded that of the largest centralized exchange in the U.S., Coinbase, for two consecutive months.
Users and creators benefit from Web3's structurally lower "take rate" (i.e., the fees charged by platform owners from users). In cryptocurrency, users truly own their digital goods, and importantly, they can take those goods to any platform.
The easier it is for people to switch platforms, the more competitive the environment becomes, and the less profit platforms extract from users (or suddenly change the rules). Low platform pricing power typically leads to lower adoption rates.
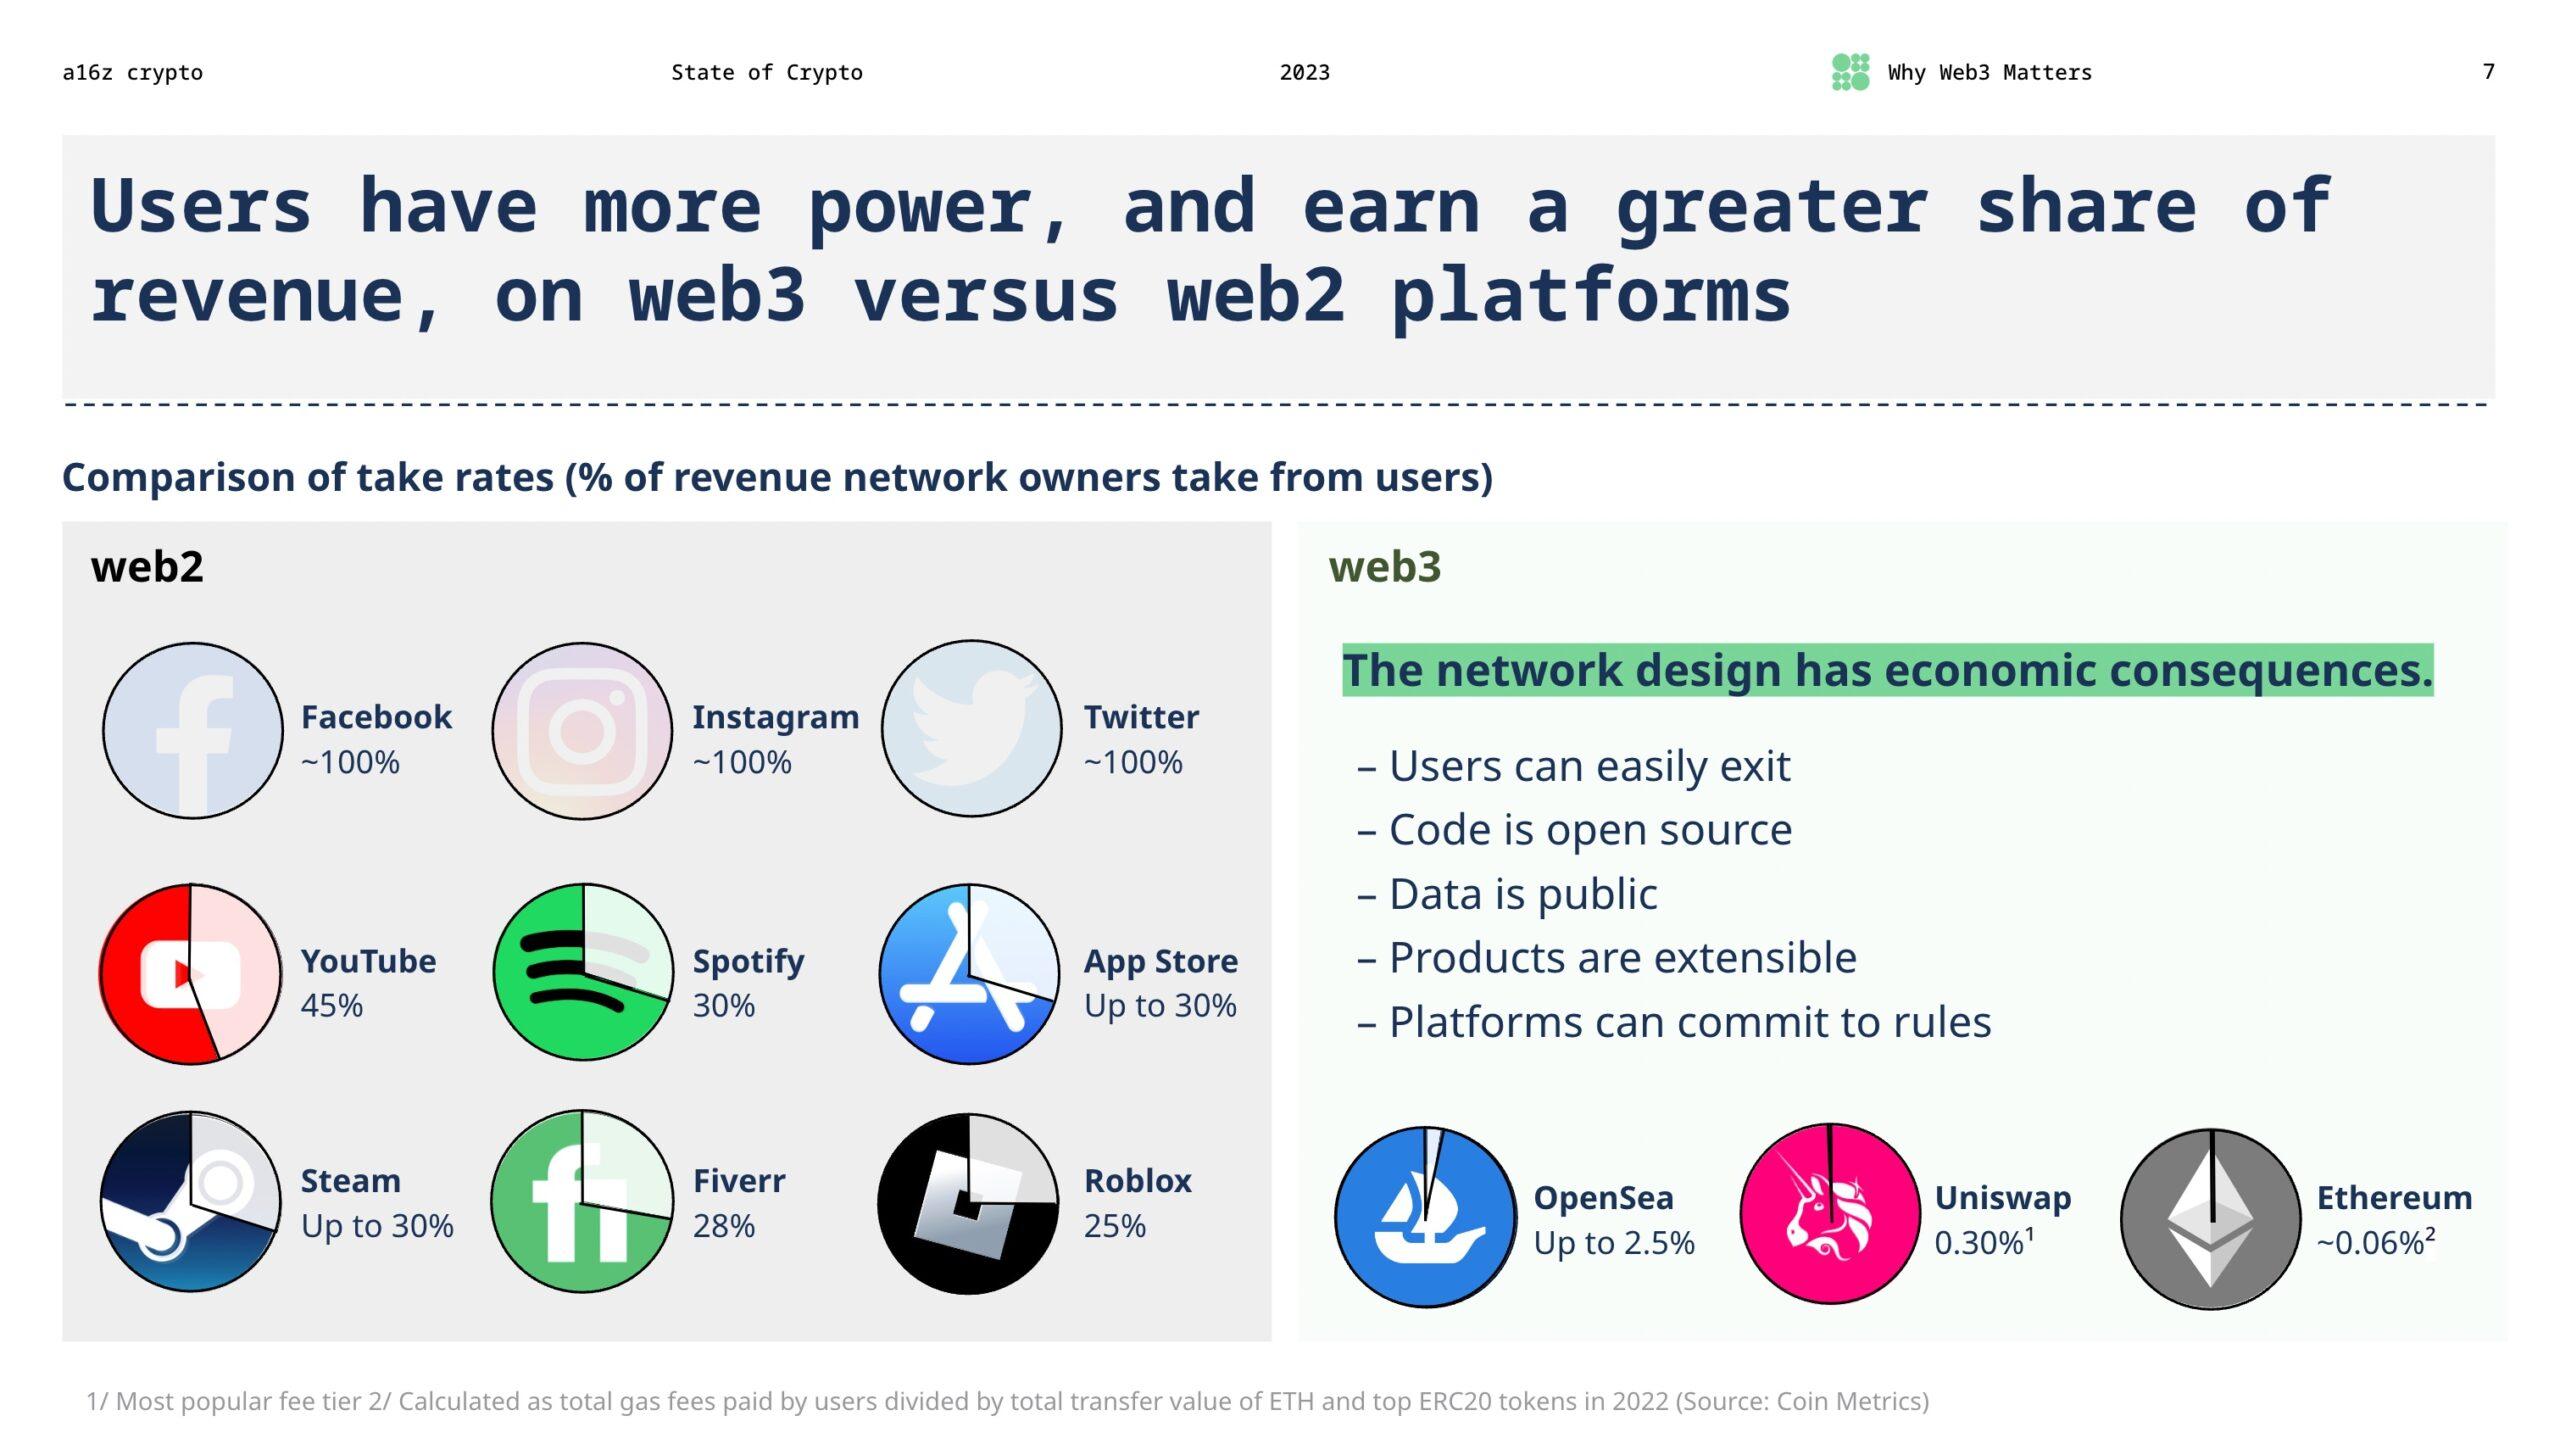
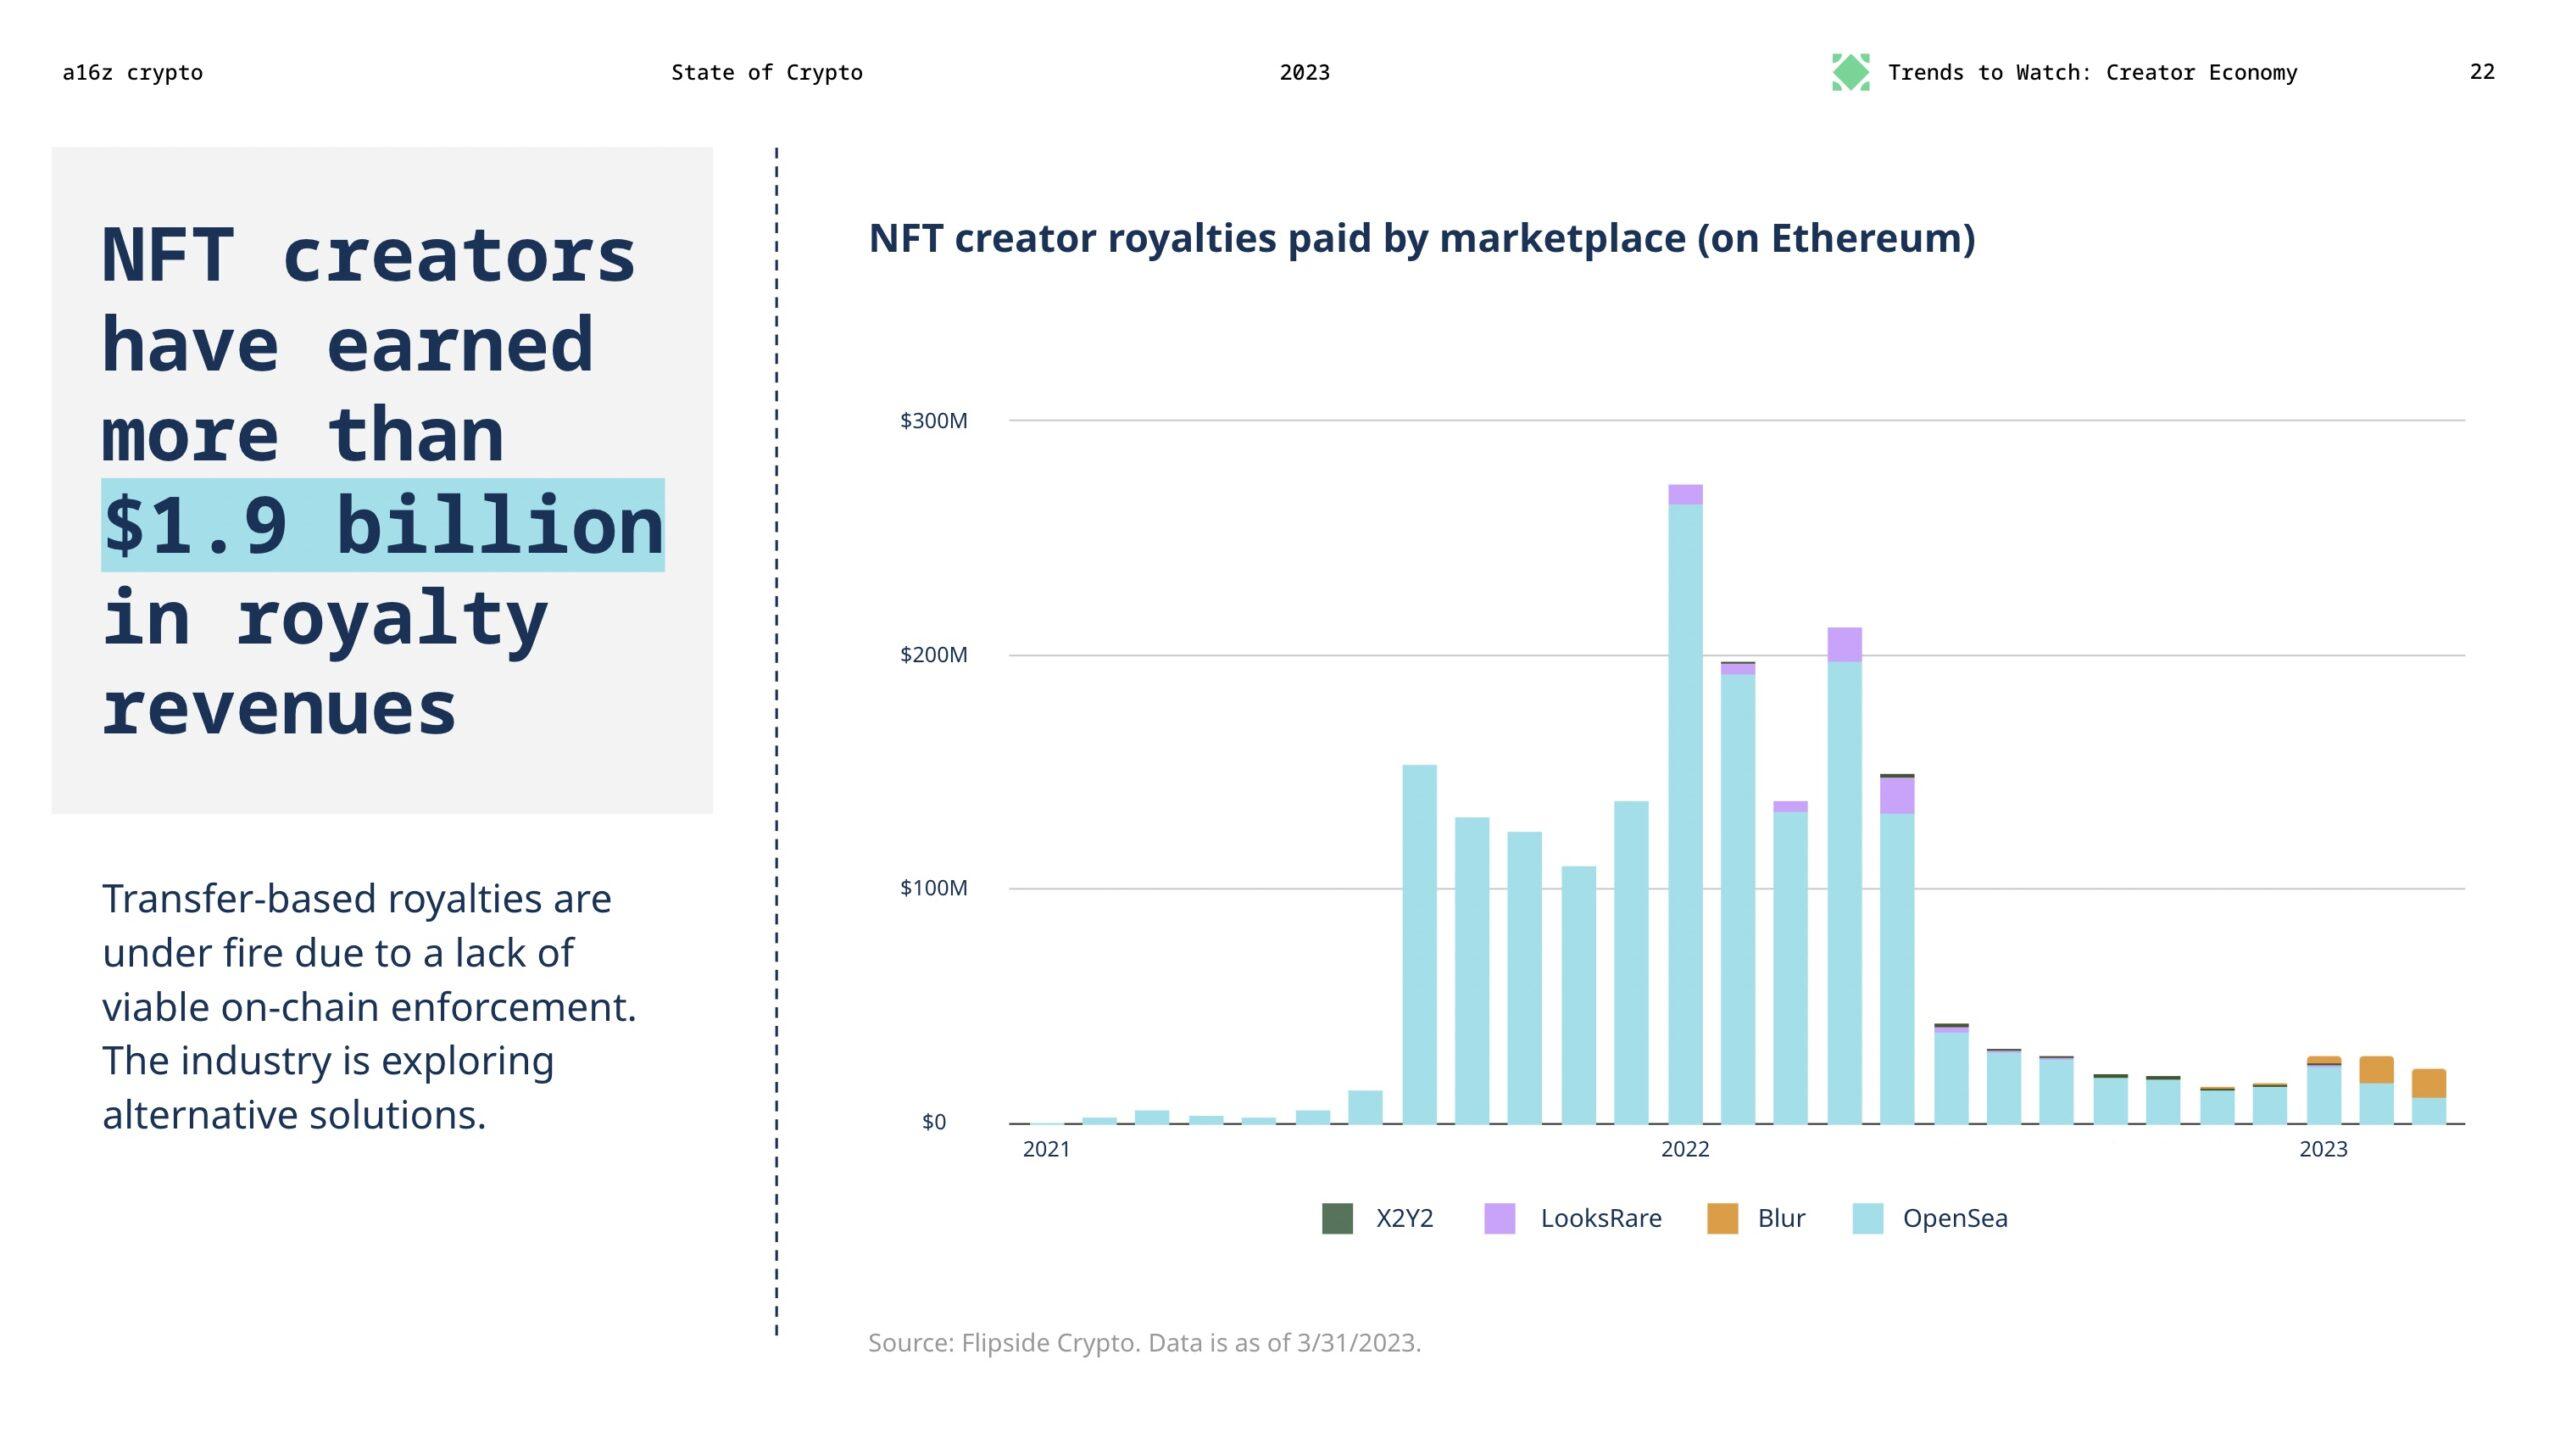
In the past two years, the NFT market has paid creators nearly $2 billion in secondary sales royalties. In comparison, Meta reserved $1 billion for creators in 2022. Considering that Meta's platforms (Facebook, Instagram, WhatsApp, etc.) have approximately 3.74 billion monthly users, while current Web3 users number only in the tens of millions.
It is worth noting that the adoption rate of Web3 may trend downward over time. As practices and technologies evolve in this space, the royalties for Web3 creators are changing, and we look forward to more innovation and experimentation here.
3. The number of active developers in the crypto industry remains stable
Prices can be misleading, especially without a deep understanding of the dynamics of Web3 technology and the developer ecosystem.
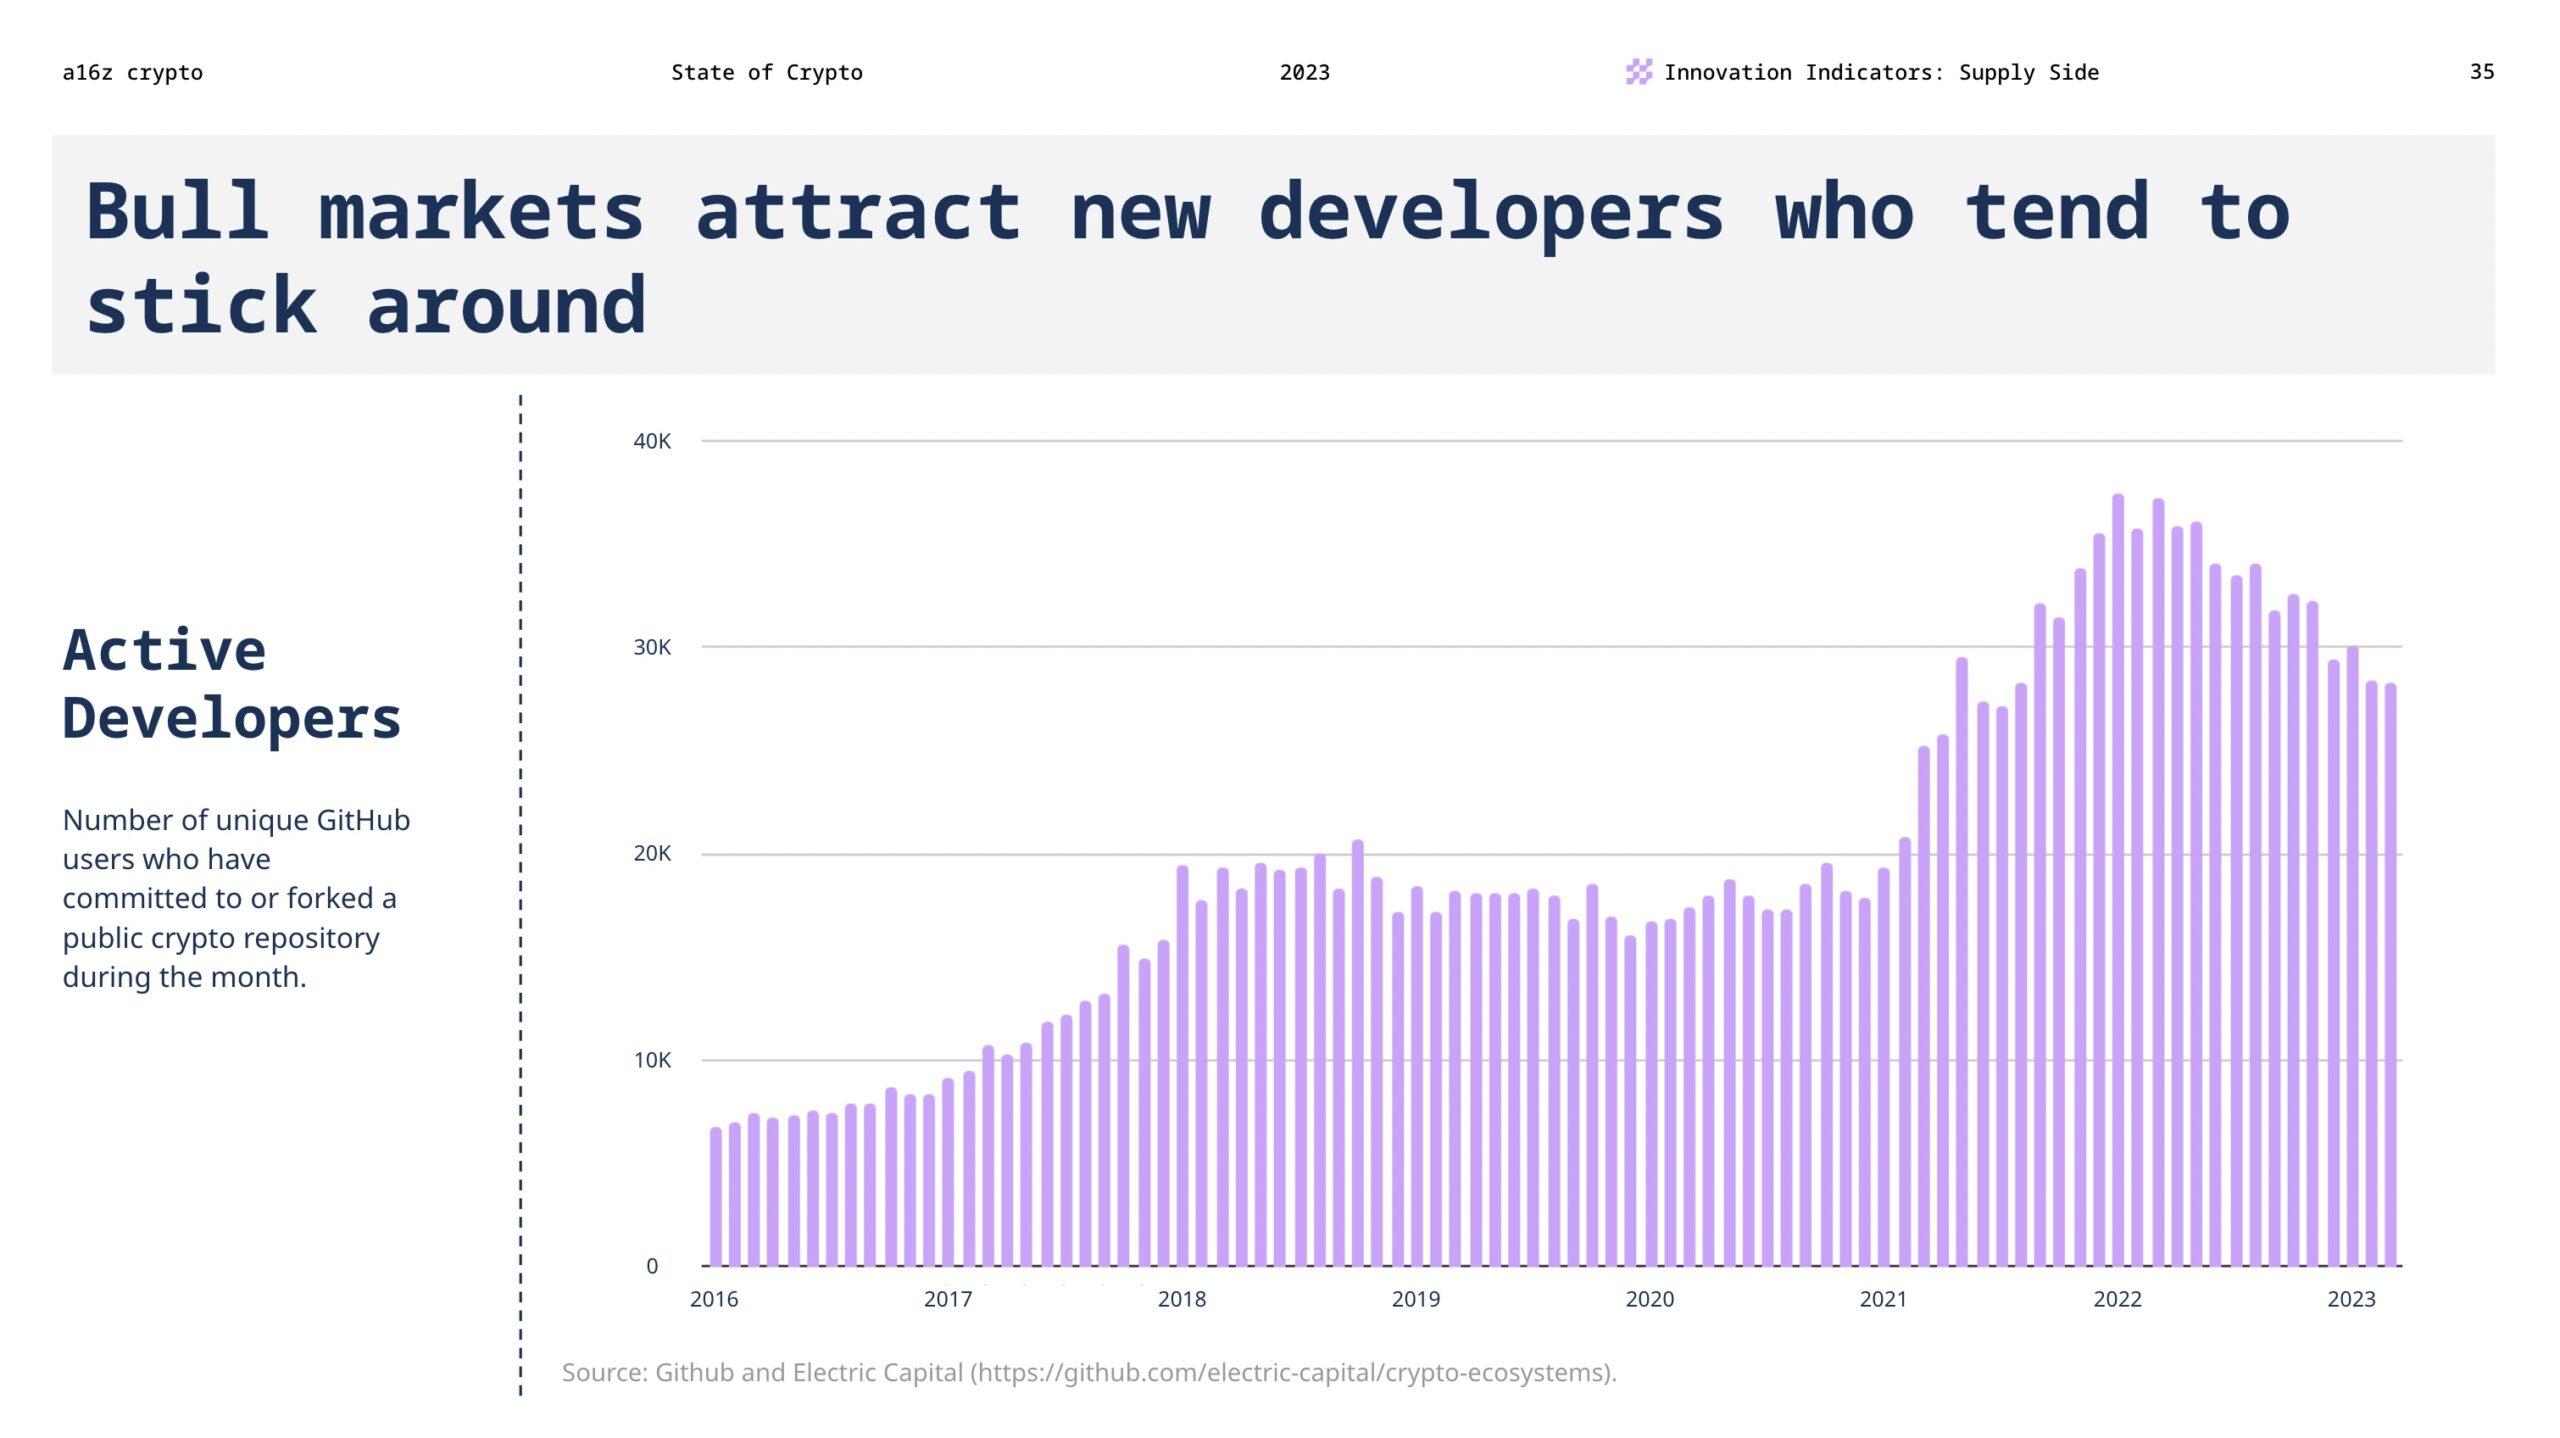
It is noteworthy that crypto technology has been continuously evolving. Today, there are nearly 30,000 active developers in the crypto industry each month. This steady growth of 60% since the 2020 bull market may indicate that developers attracted by rising prices are still persevering.
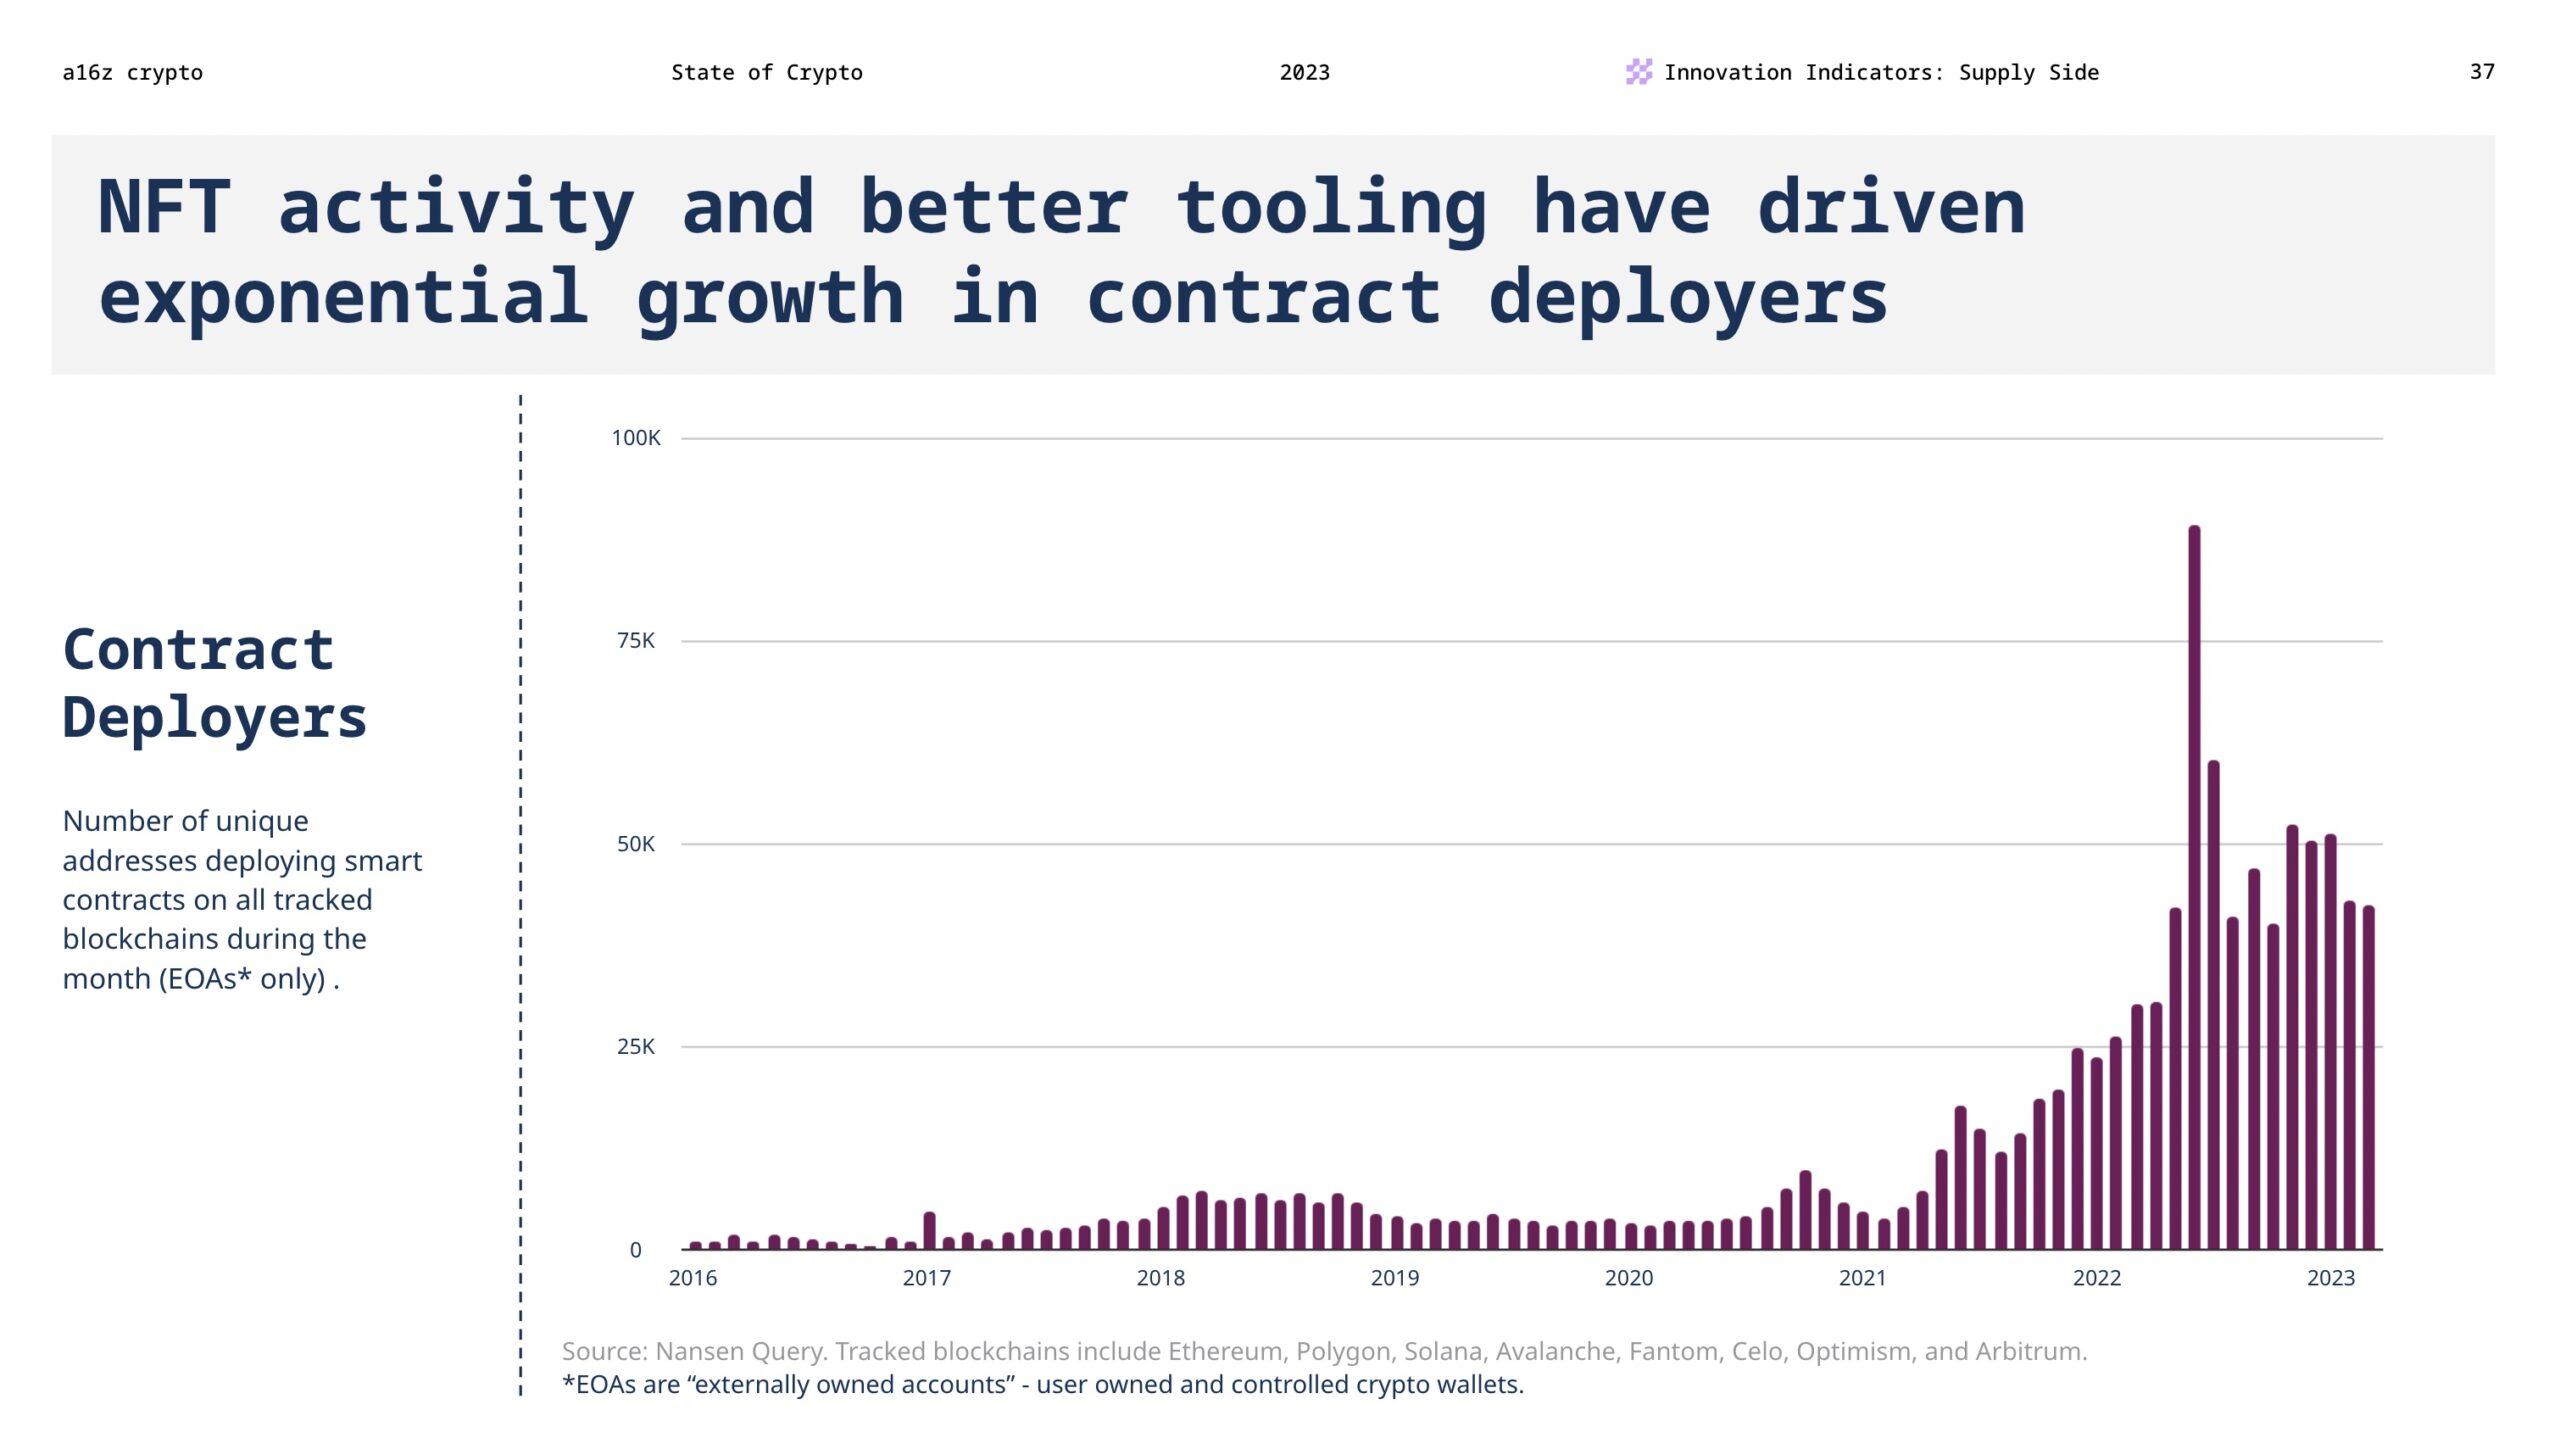
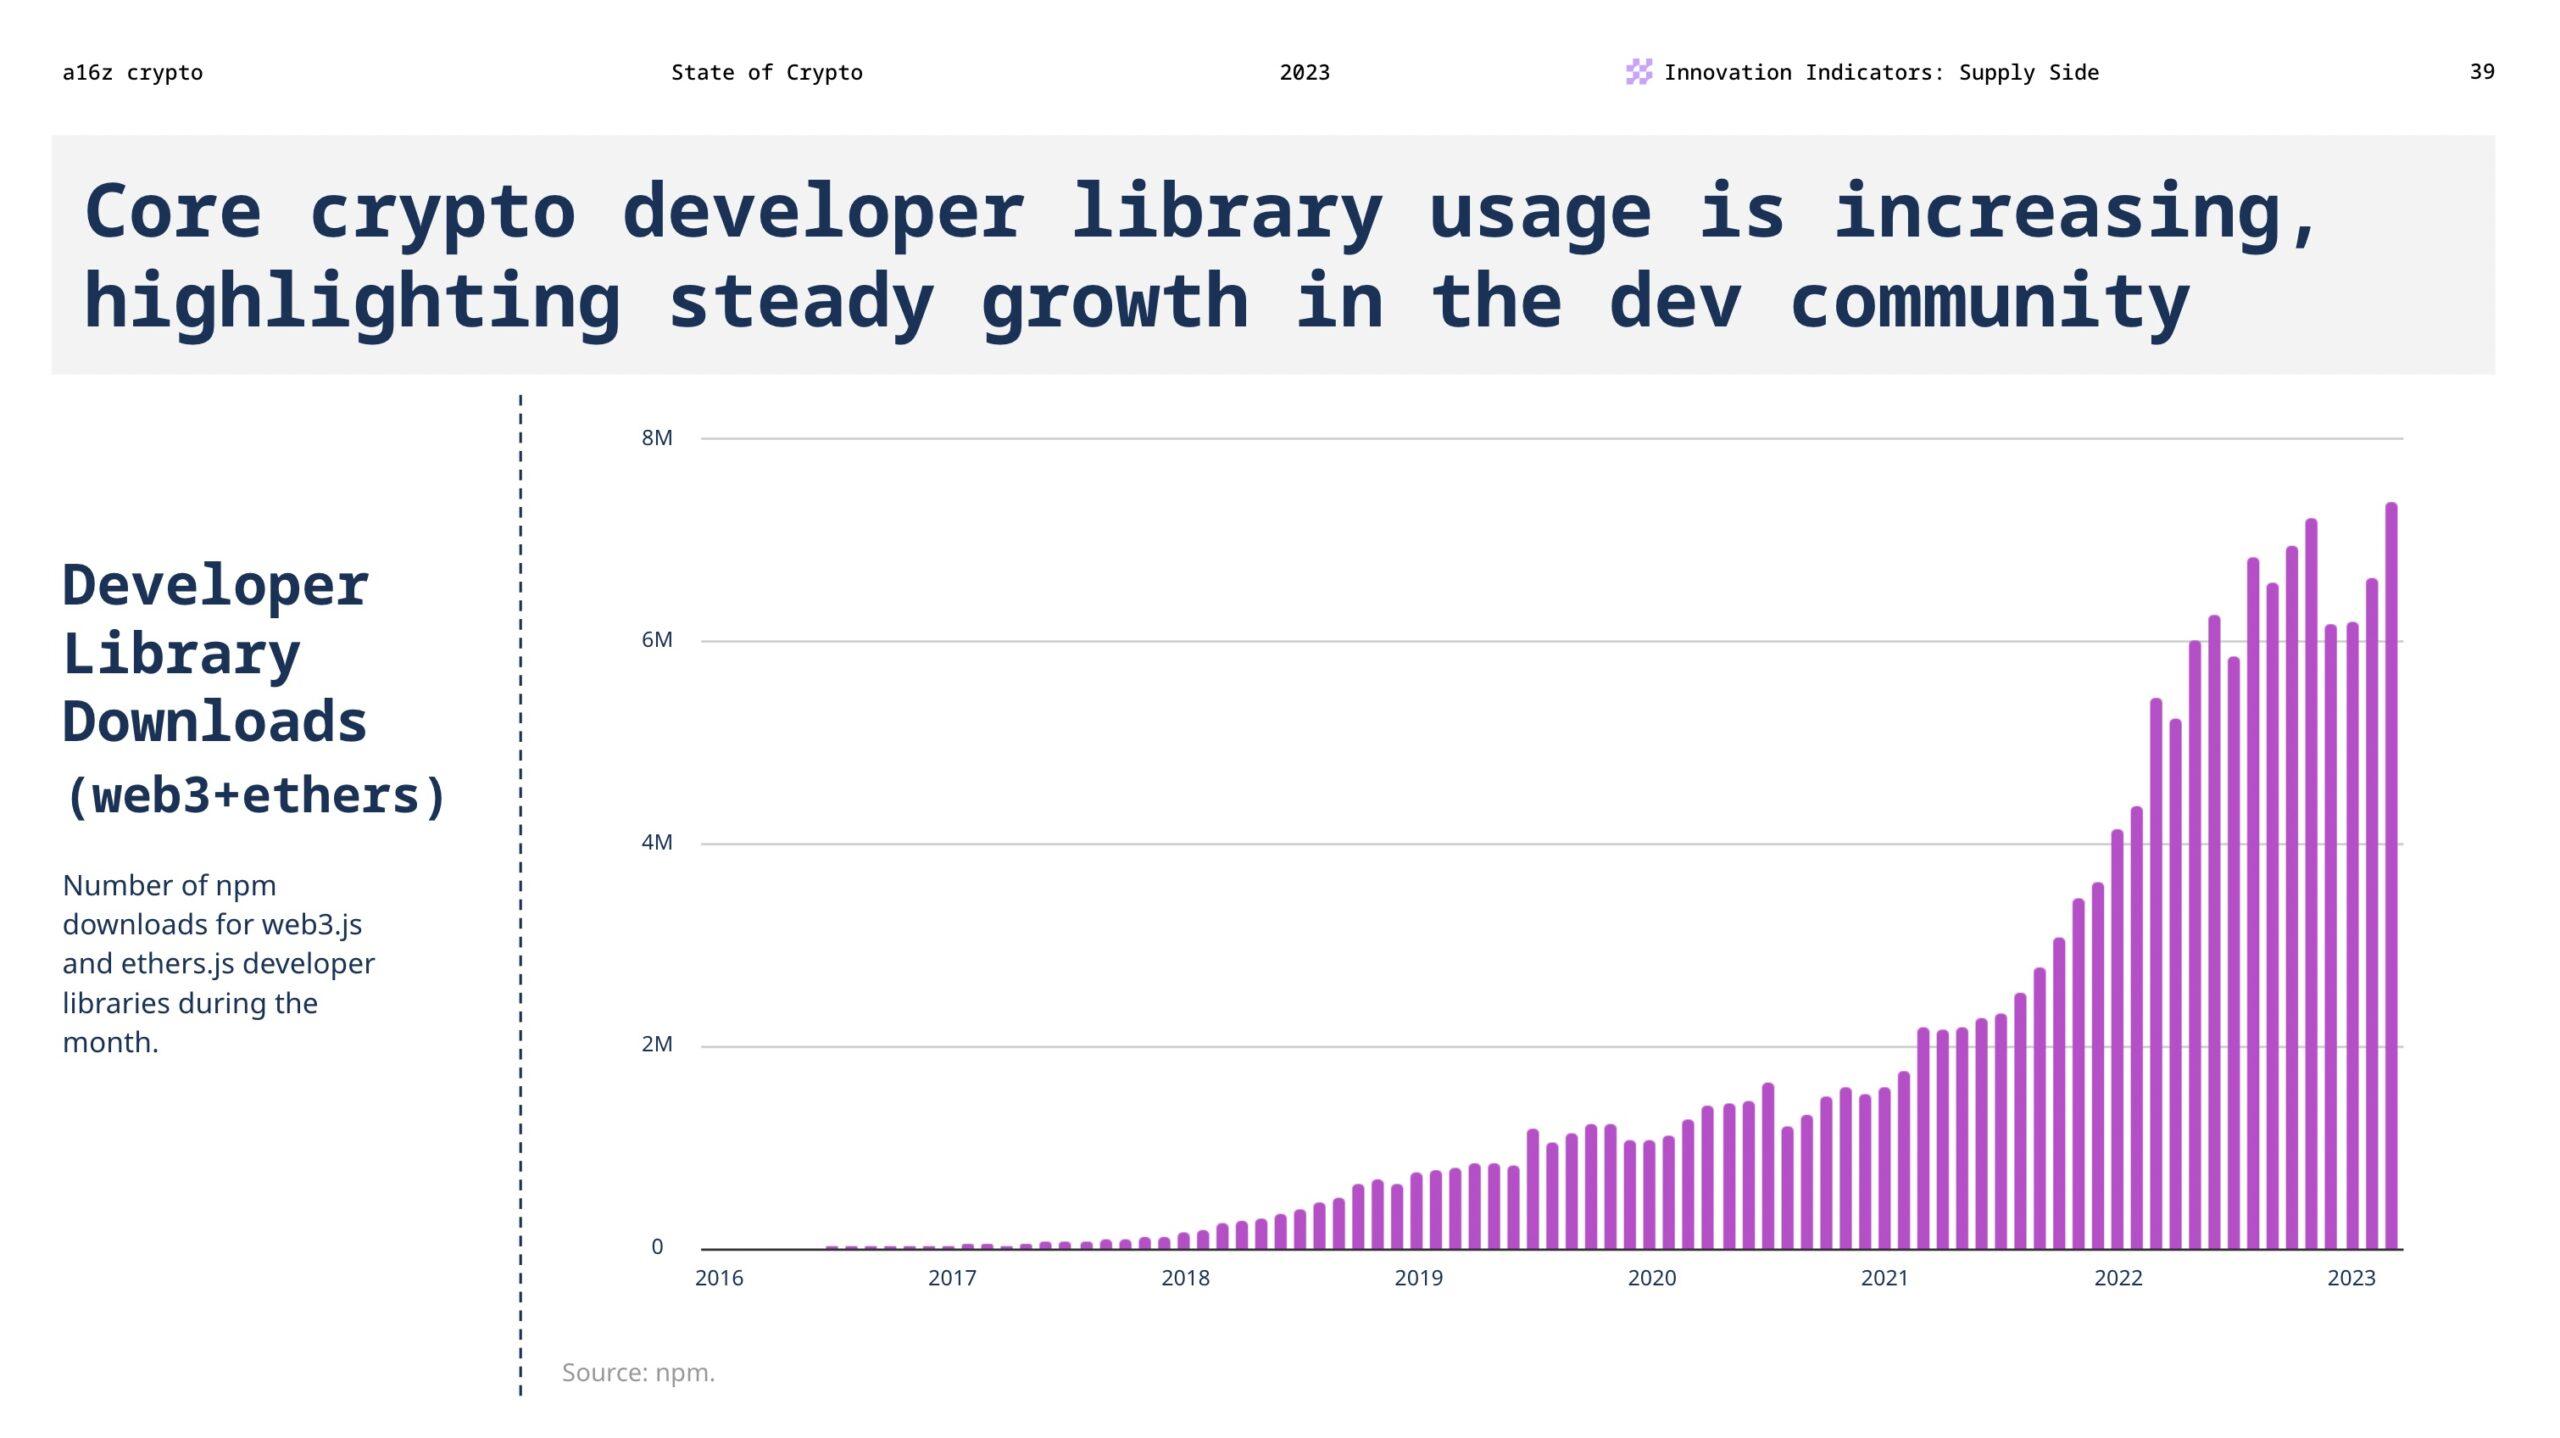
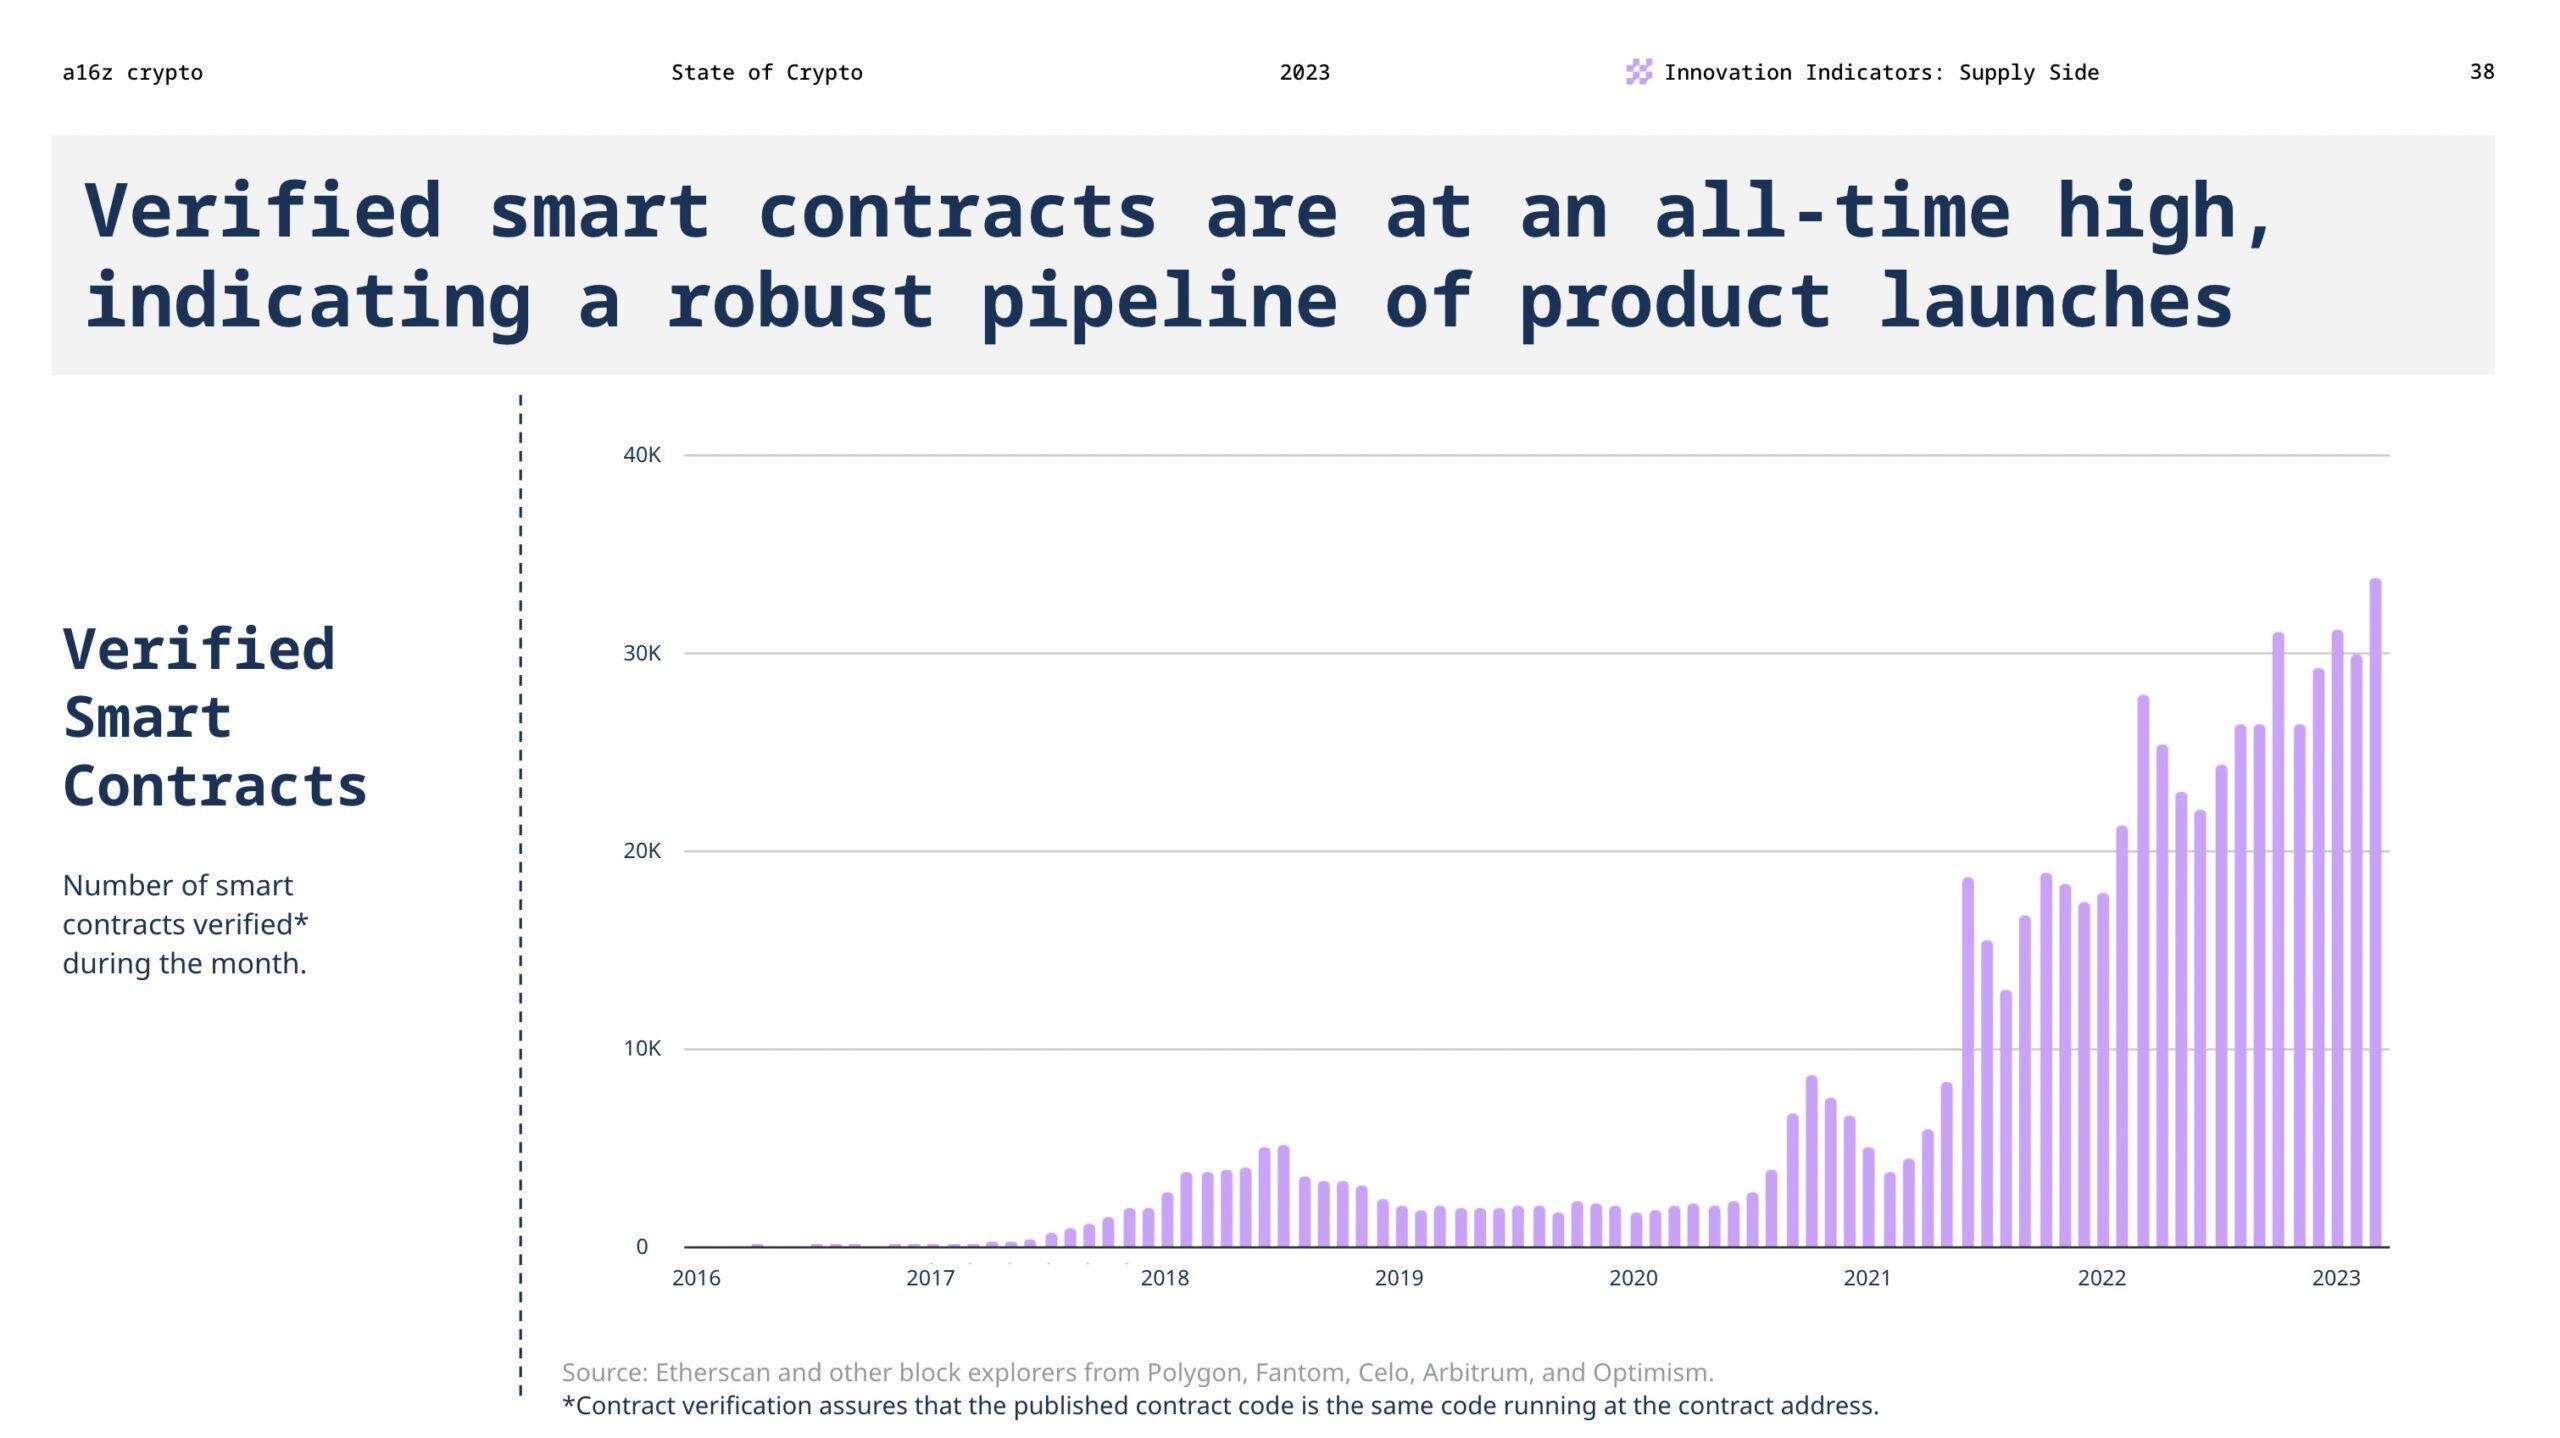
In terms of the content they are building: last month, nearly 50,000 unique addresses deployed smart contracts, a figure that has grown by 40% just this year. In places we have not tracked, more smart contracts are being verified, and more core developers' codebases are being used to interact with them.
A key feature of cryptocurrency is that when a project's composable modules are reused, repurposed, and adapted by others, the project can act as a multiplier. Composability in software (as a16z crypto founder and managing partner Chris Dixon puts it) is like compound interest in finance: it is an exponential force.
"There are various exponential forces in the world worth paying attention to, as they can serve as indicators of future rapid growth. In hardware, the most powerful exponential force is Moore's Law. In finance, it is compound interest. In software, it is composability."
Take Uniswap as an example: it started as a protocol for swapping tokens and has now evolved into a key infrastructure supporting a new ecosystem of DeFi applications.
4. The blockchain is expanding through new avenues
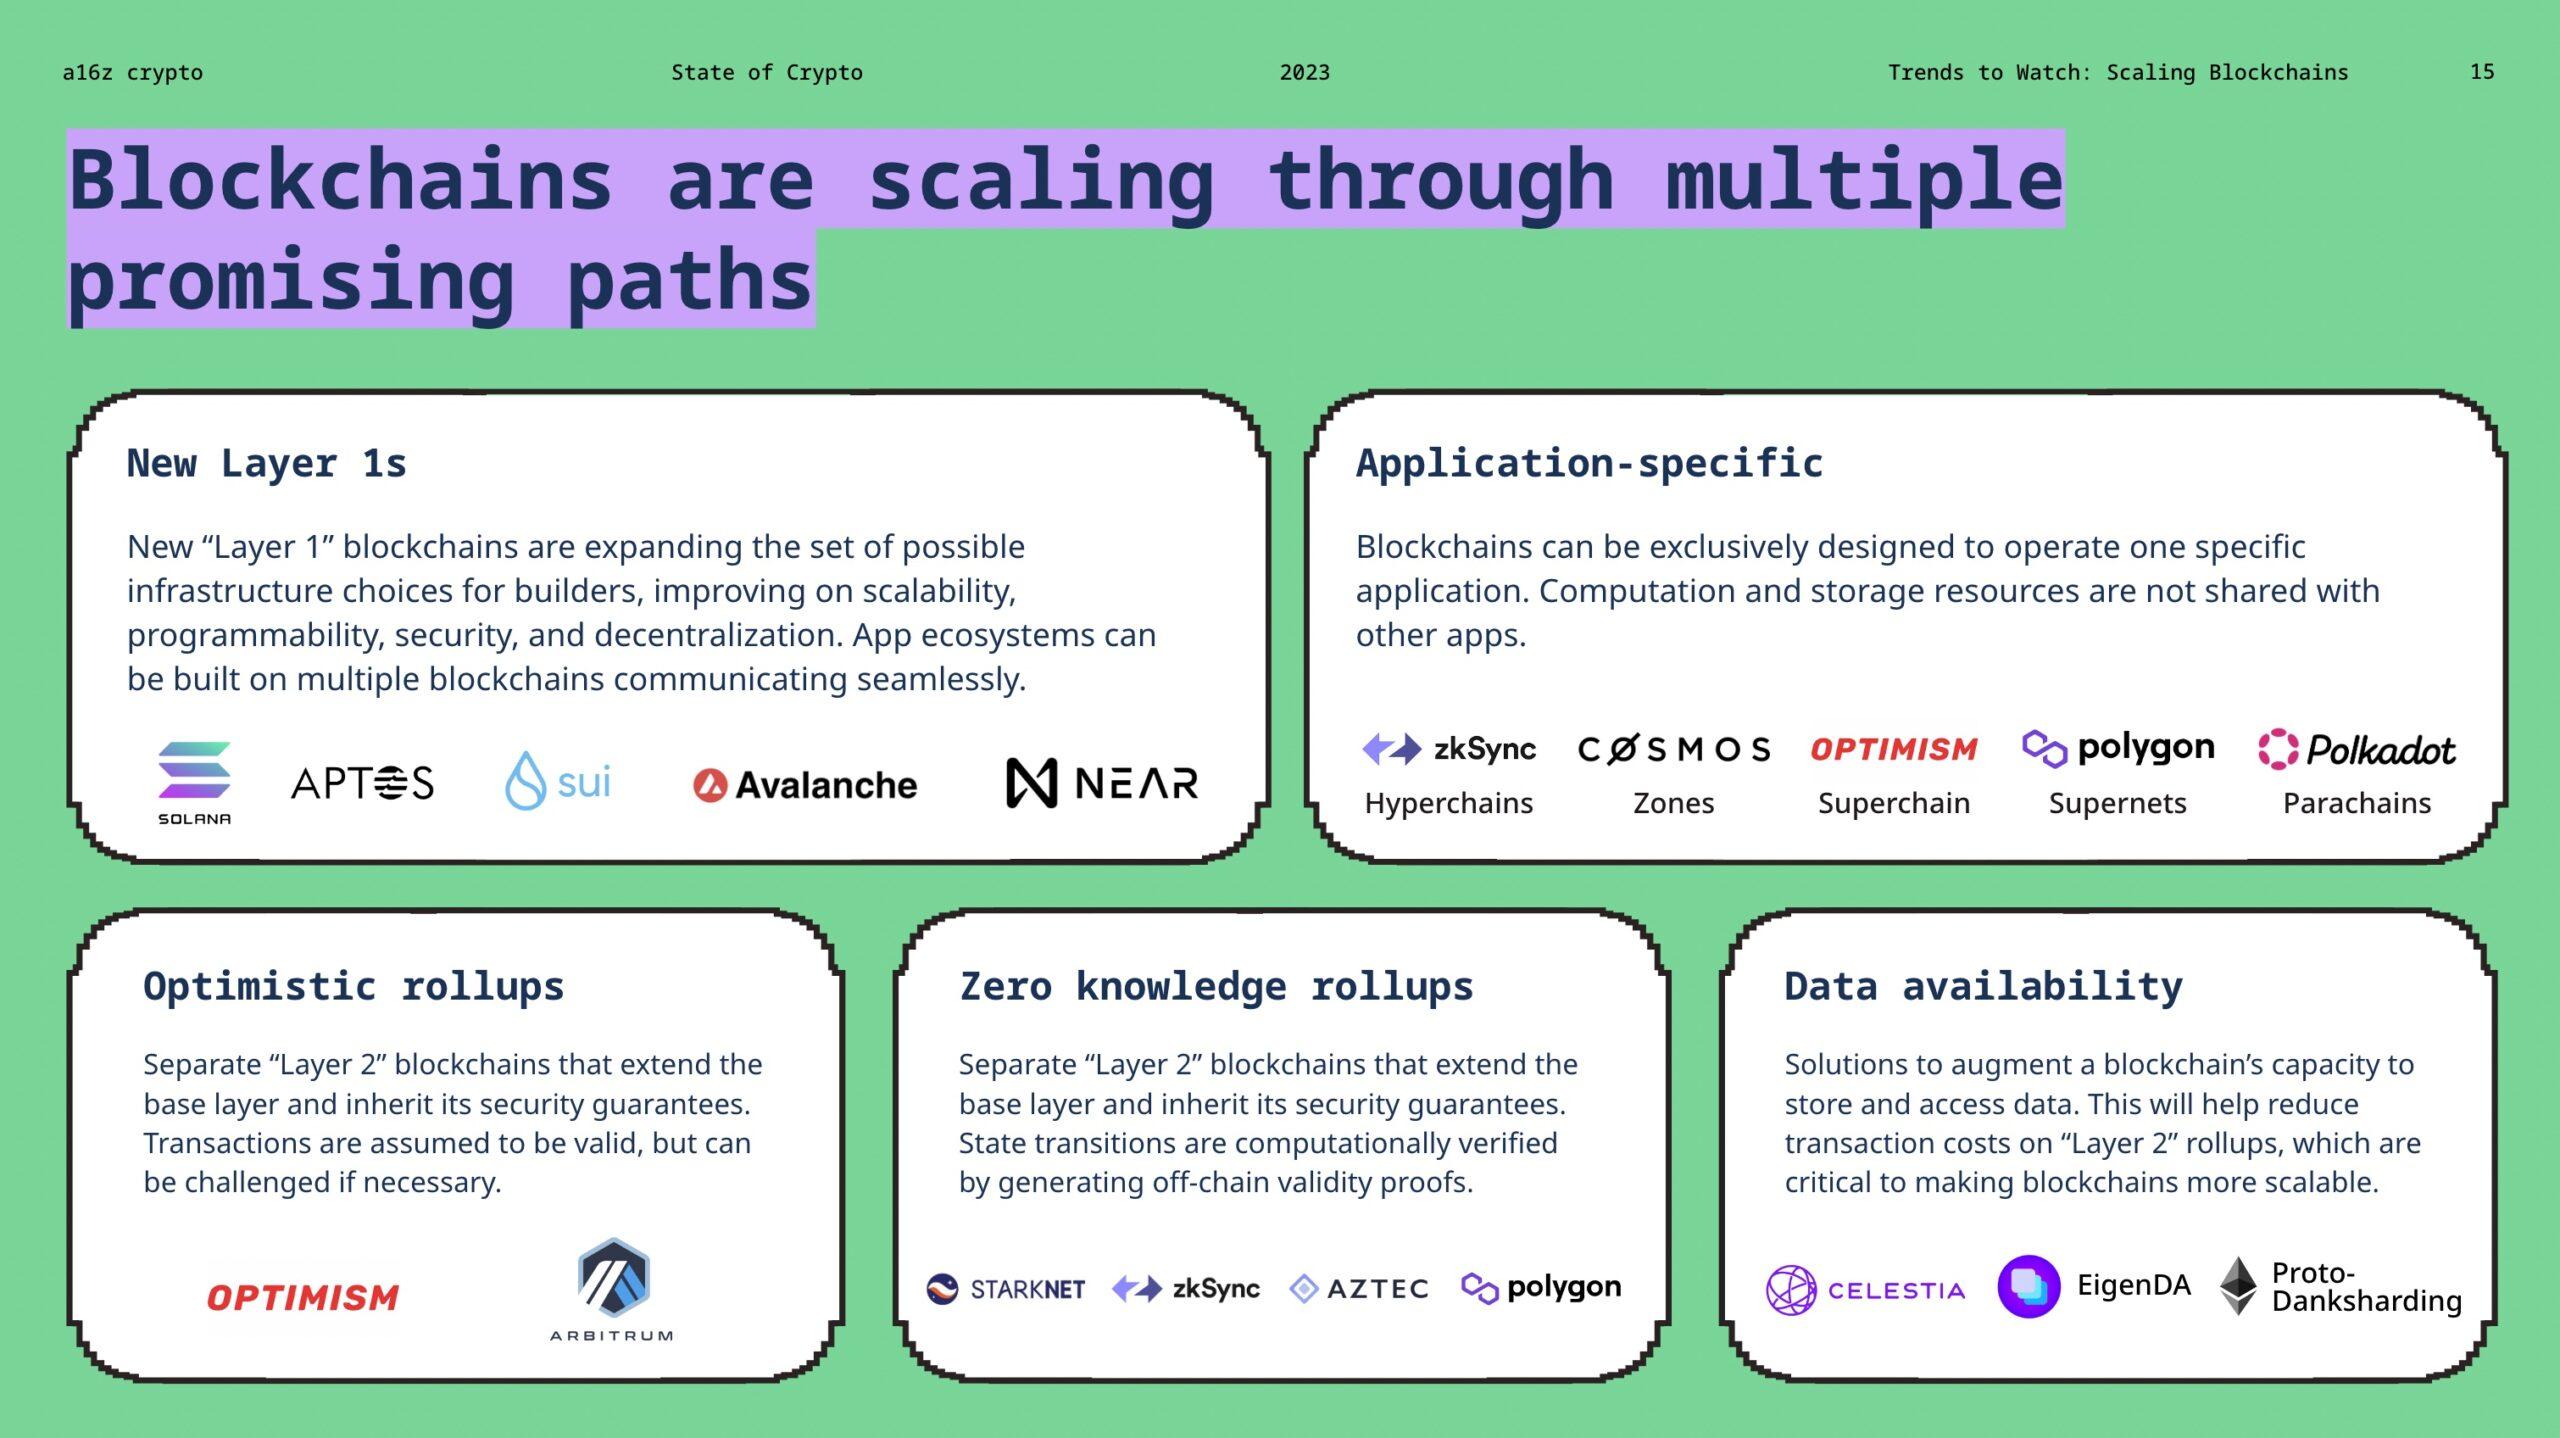
Blockchain scaling welcomes more people, more transactions, and more complex applications to join. We are now seeing many new avenues; for Web3 developers trying to solve foundational challenges, it is a dynamic design space.
Let’s start with Layer 2 blockchains: these are technologies designed to scale the underlying Layer 1 blockchains (like Ethereum) by providing more block space, increasing transaction throughput, and lowering fees. Last year, Layer 2 accounted for 1.5% of total fees on Ethereum payments. Since then, that share has quadrupled to 7% of total fees on Ethereum payments—indicating that more applications are choosing to build on Layer 2. We expect this trend to continue and benefit end users.
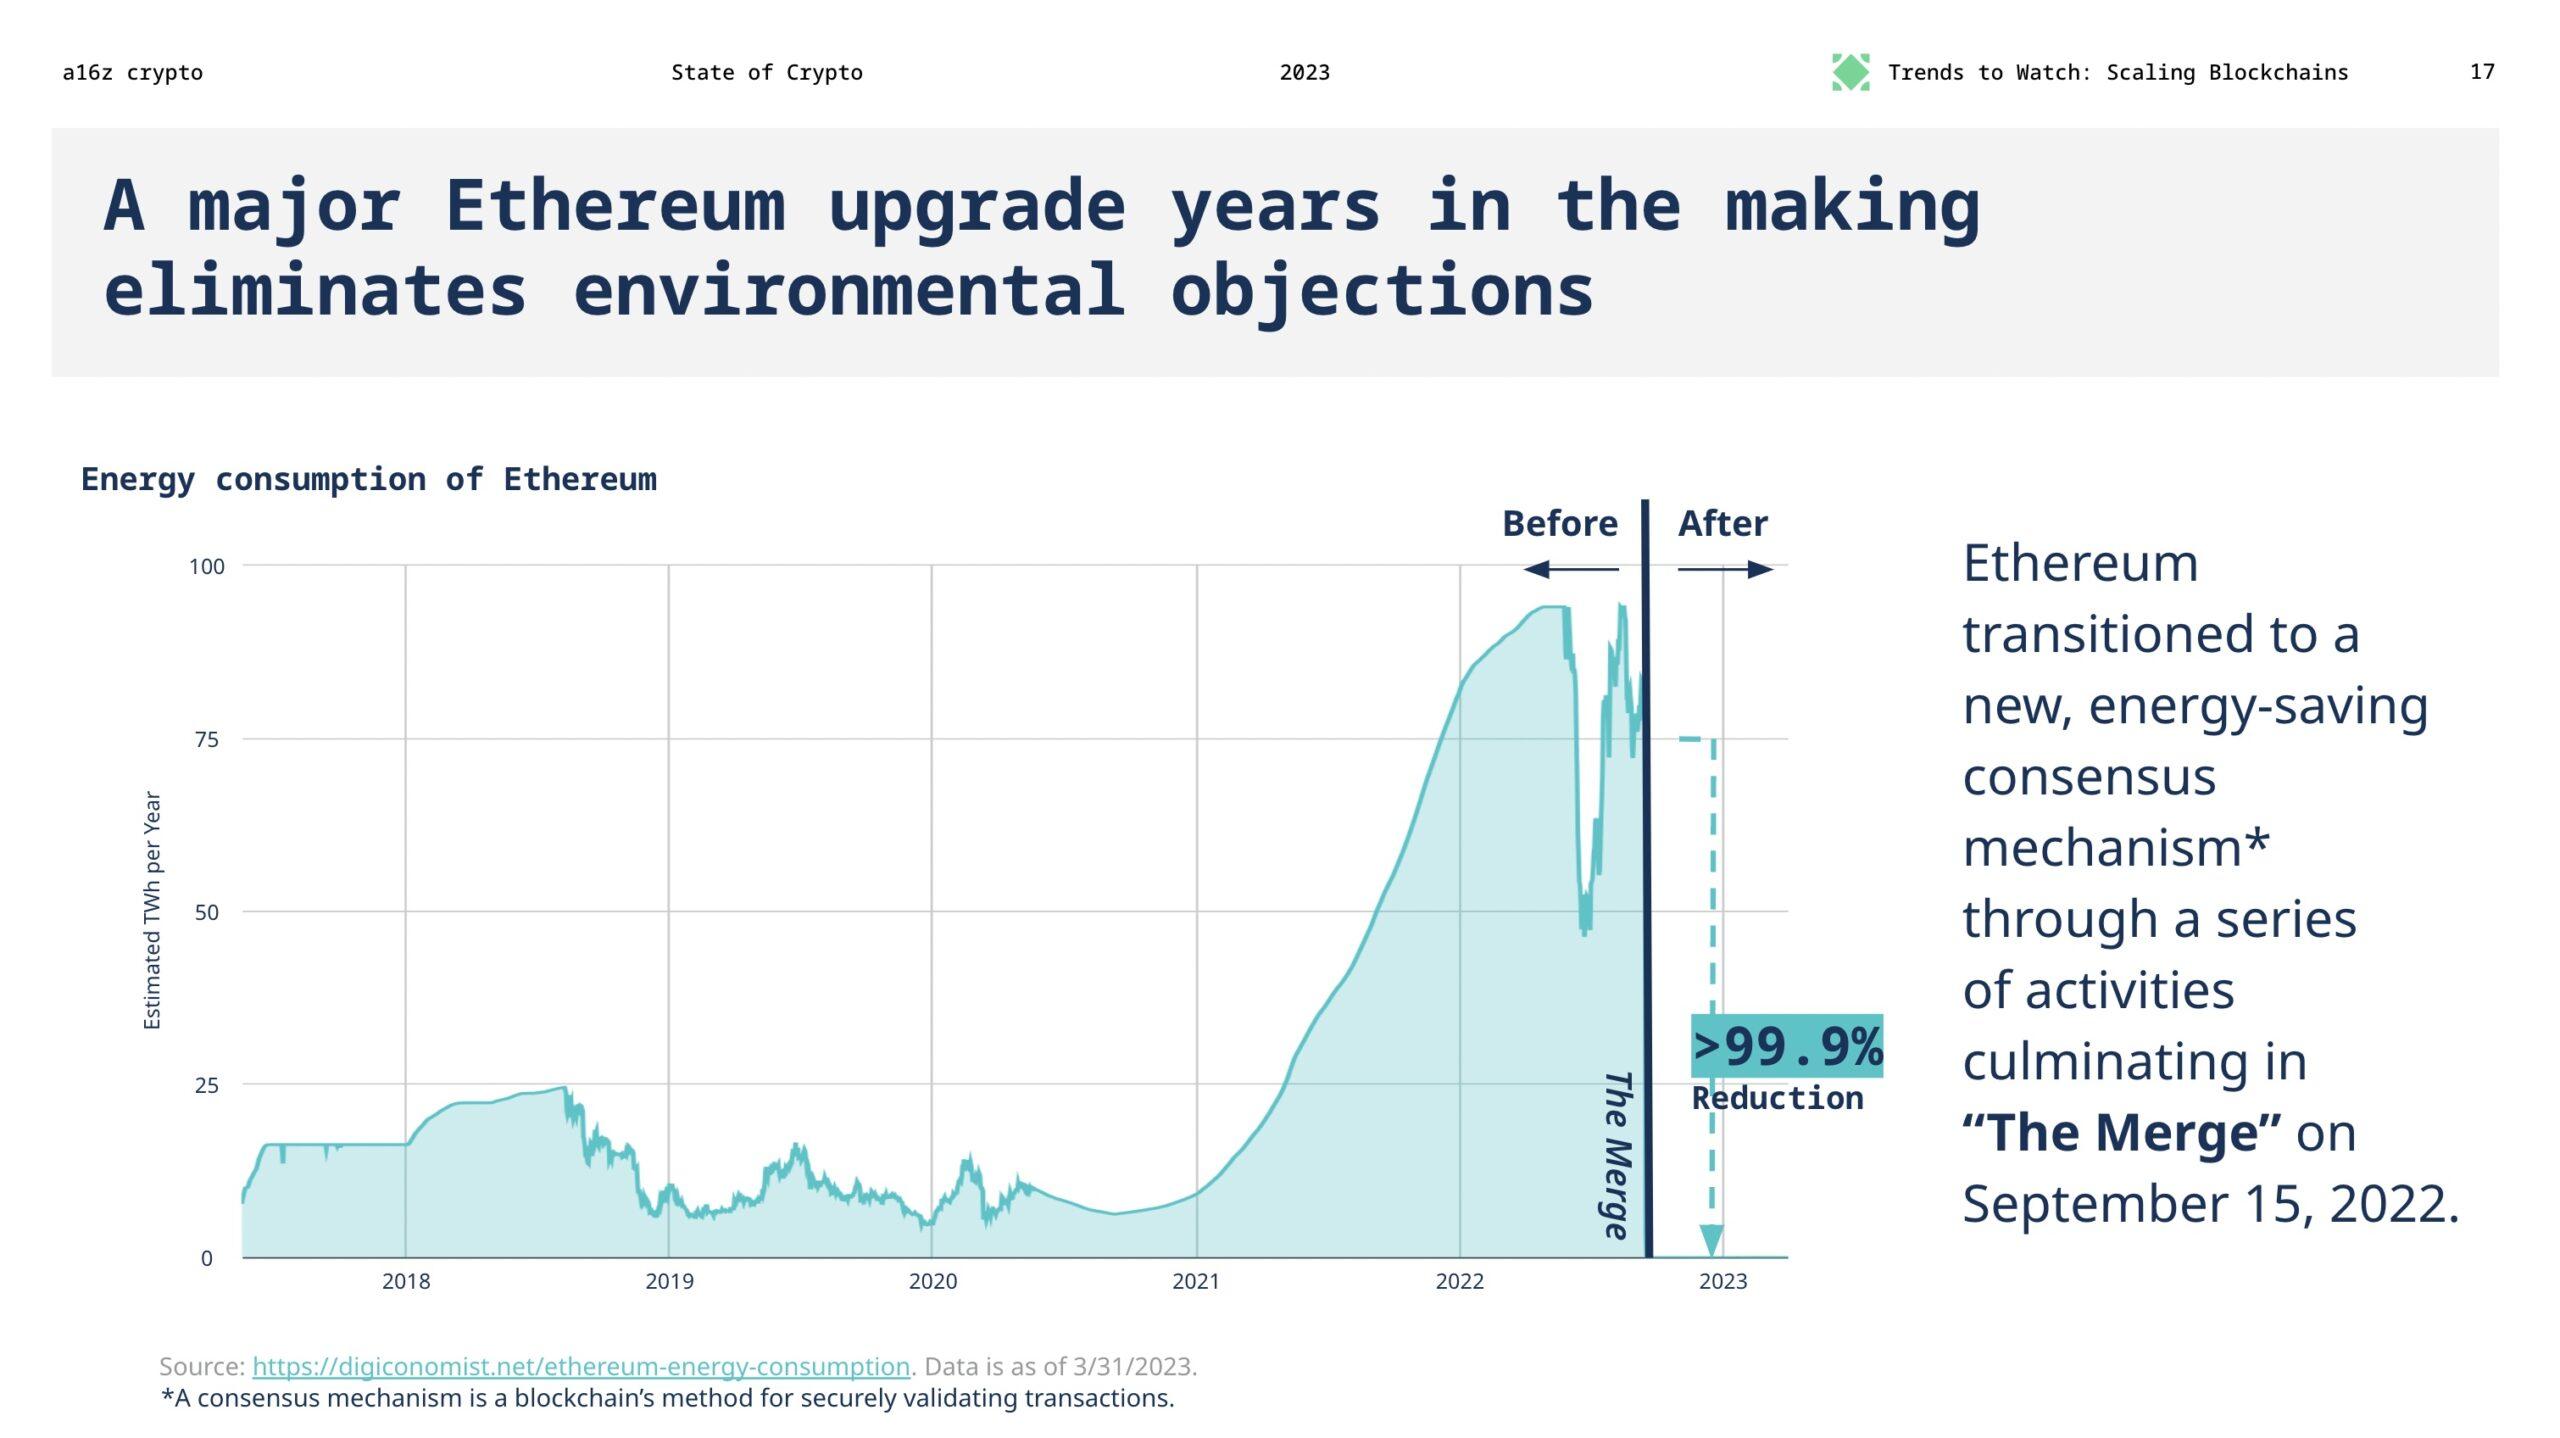
Finally, considering the scope of challenges, the nature of distributed coordination, and more, one of the most significant events in the history of open-source cryptocurrency development occurred last fall. When the network's consensus mechanism transitioned from "proof of work" to "proof of stake," Ethereum underwent a major upgrade. The "Merge" marked an architectural shift that significantly reduced Ethereum's energy consumption:
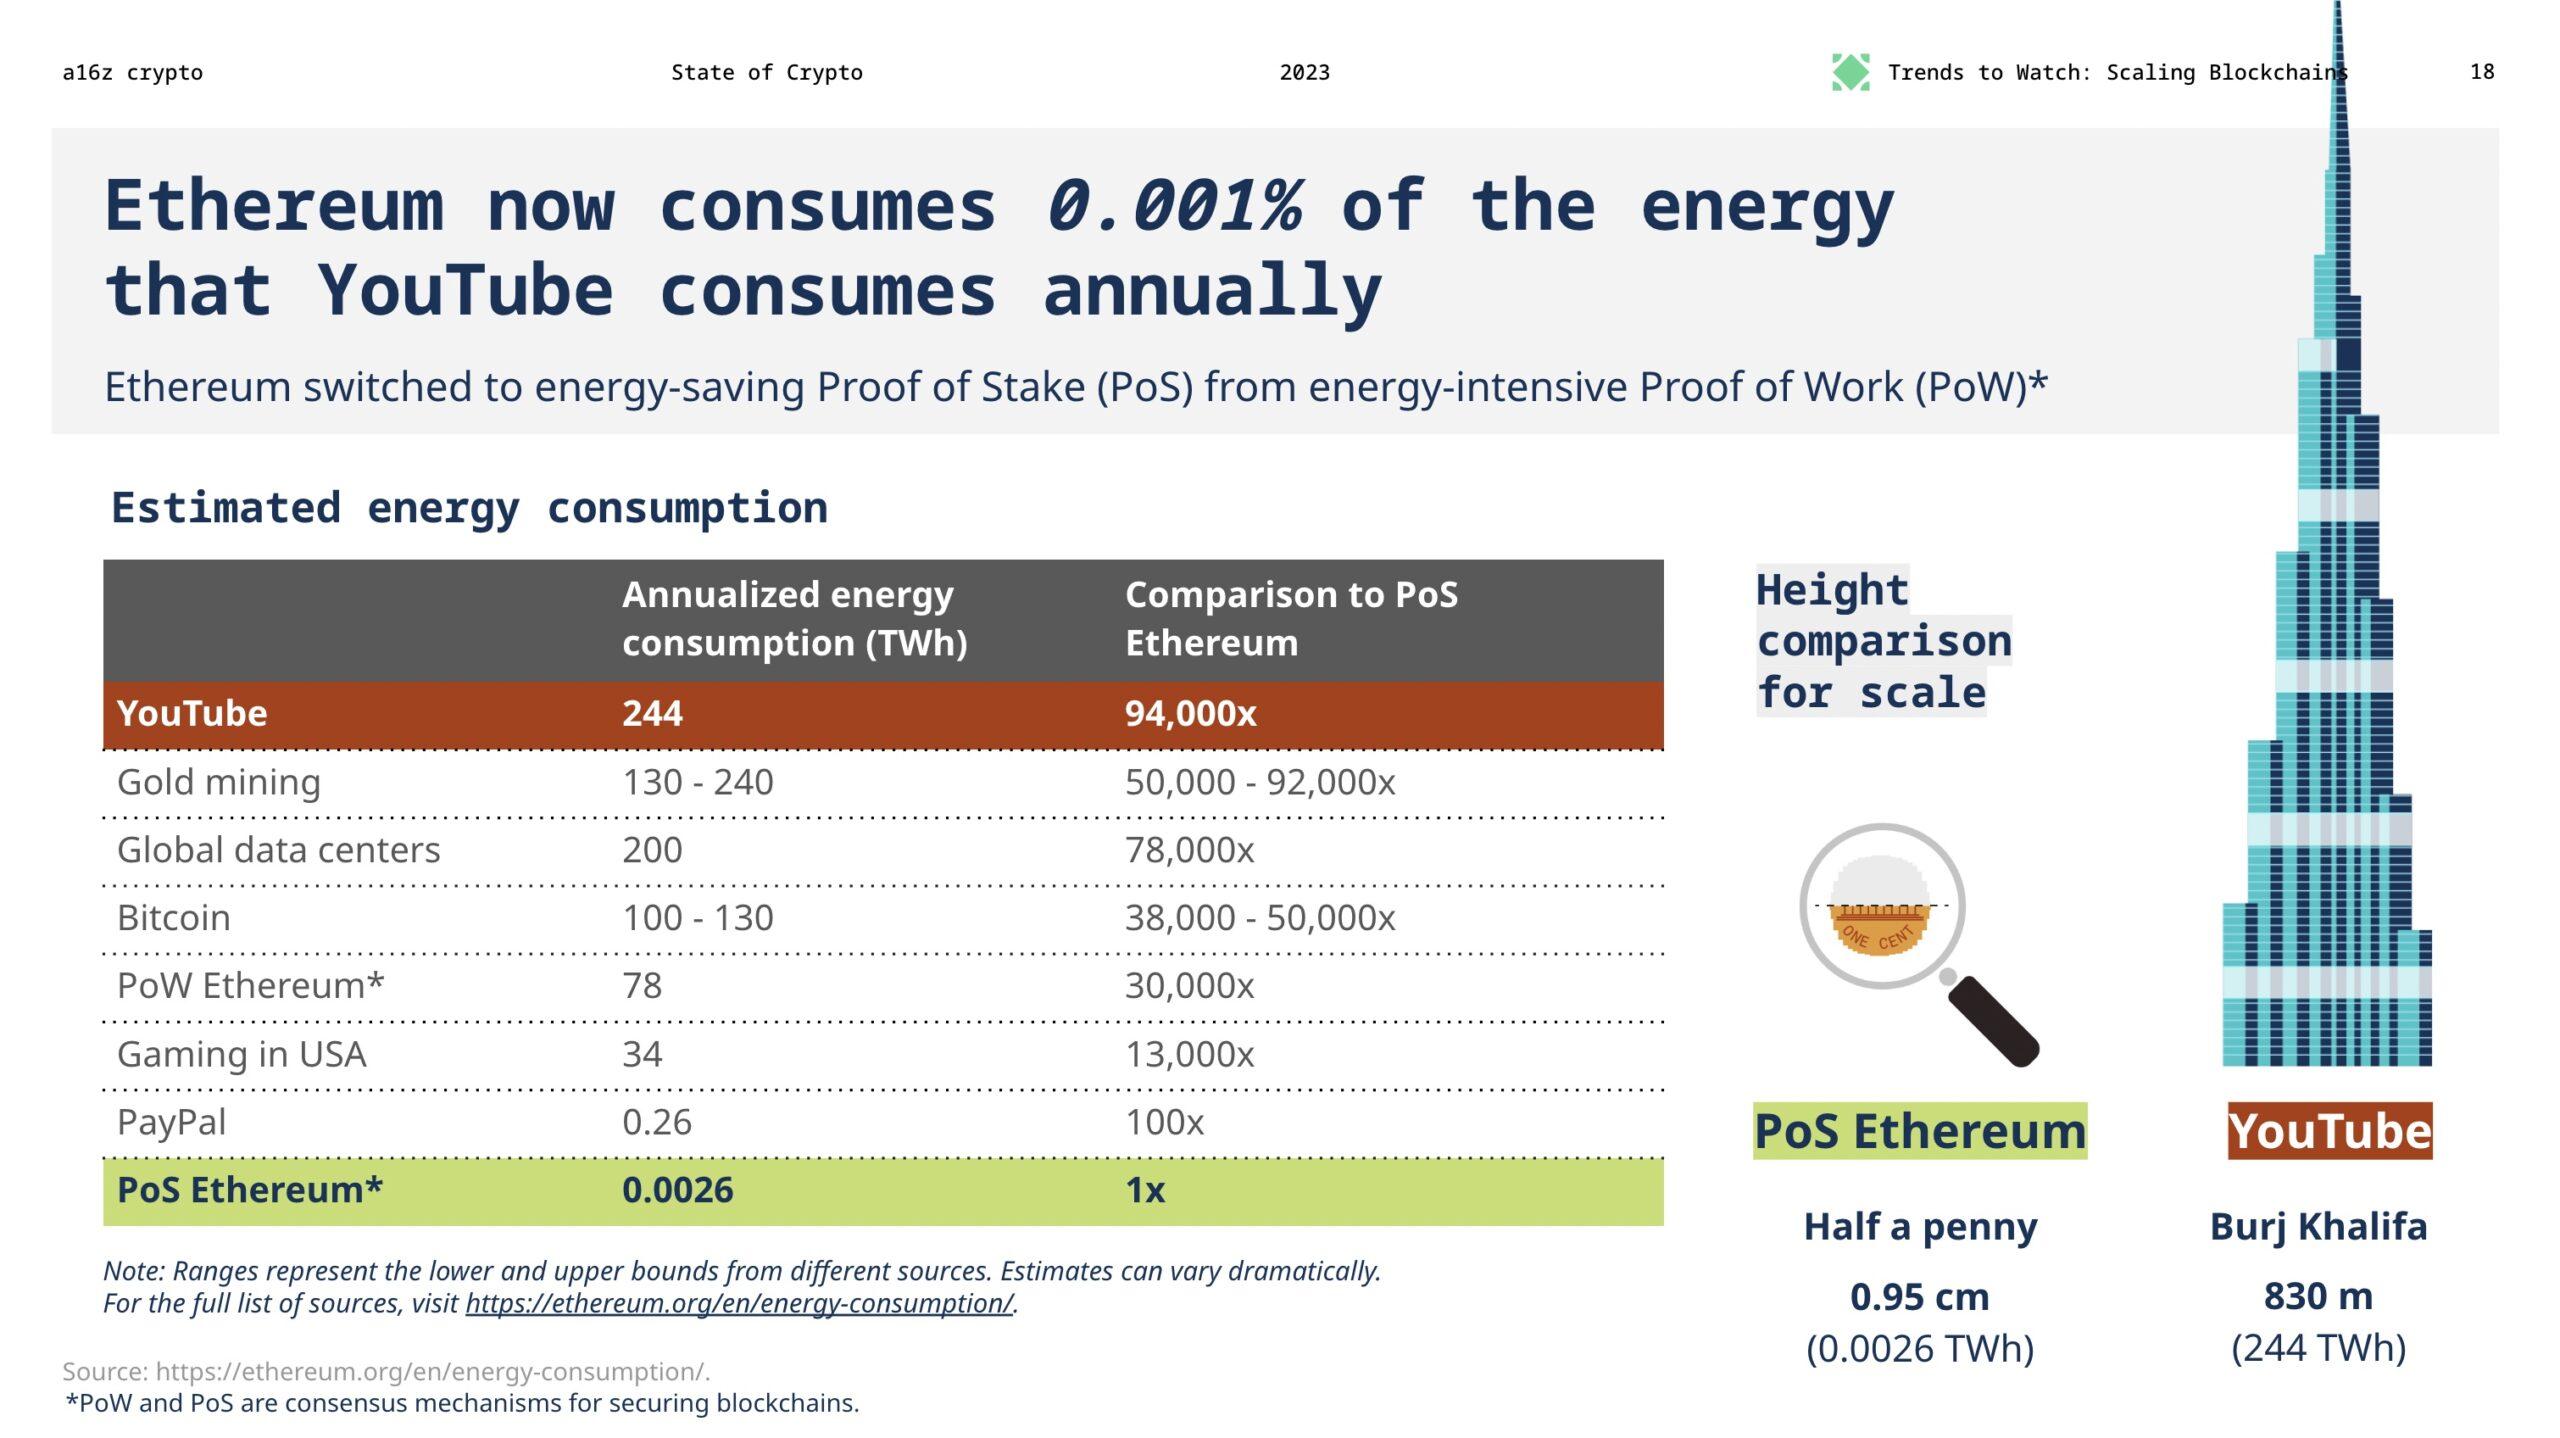
Comparing it to Web2 giants: YouTube's estimated annual energy consumption is 244 terawatt-hours, equivalent to 94,000 times that of Ethereum.
5. New technologies are moving into practice
In the past year, we have seen rapid developments in the field of "zero-knowledge" systems. This is a powerful foundational technology that can unlock blockchain scalability, while new use cases for zero-knowledge are surging, including privacy-preserving applications and verifiable computation/AI that can enable decentralized machine learning. These systems (including zero-knowledge proofs) involve cryptographic methods used to prove or verify that a set of facts is true without revealing any information about those facts.
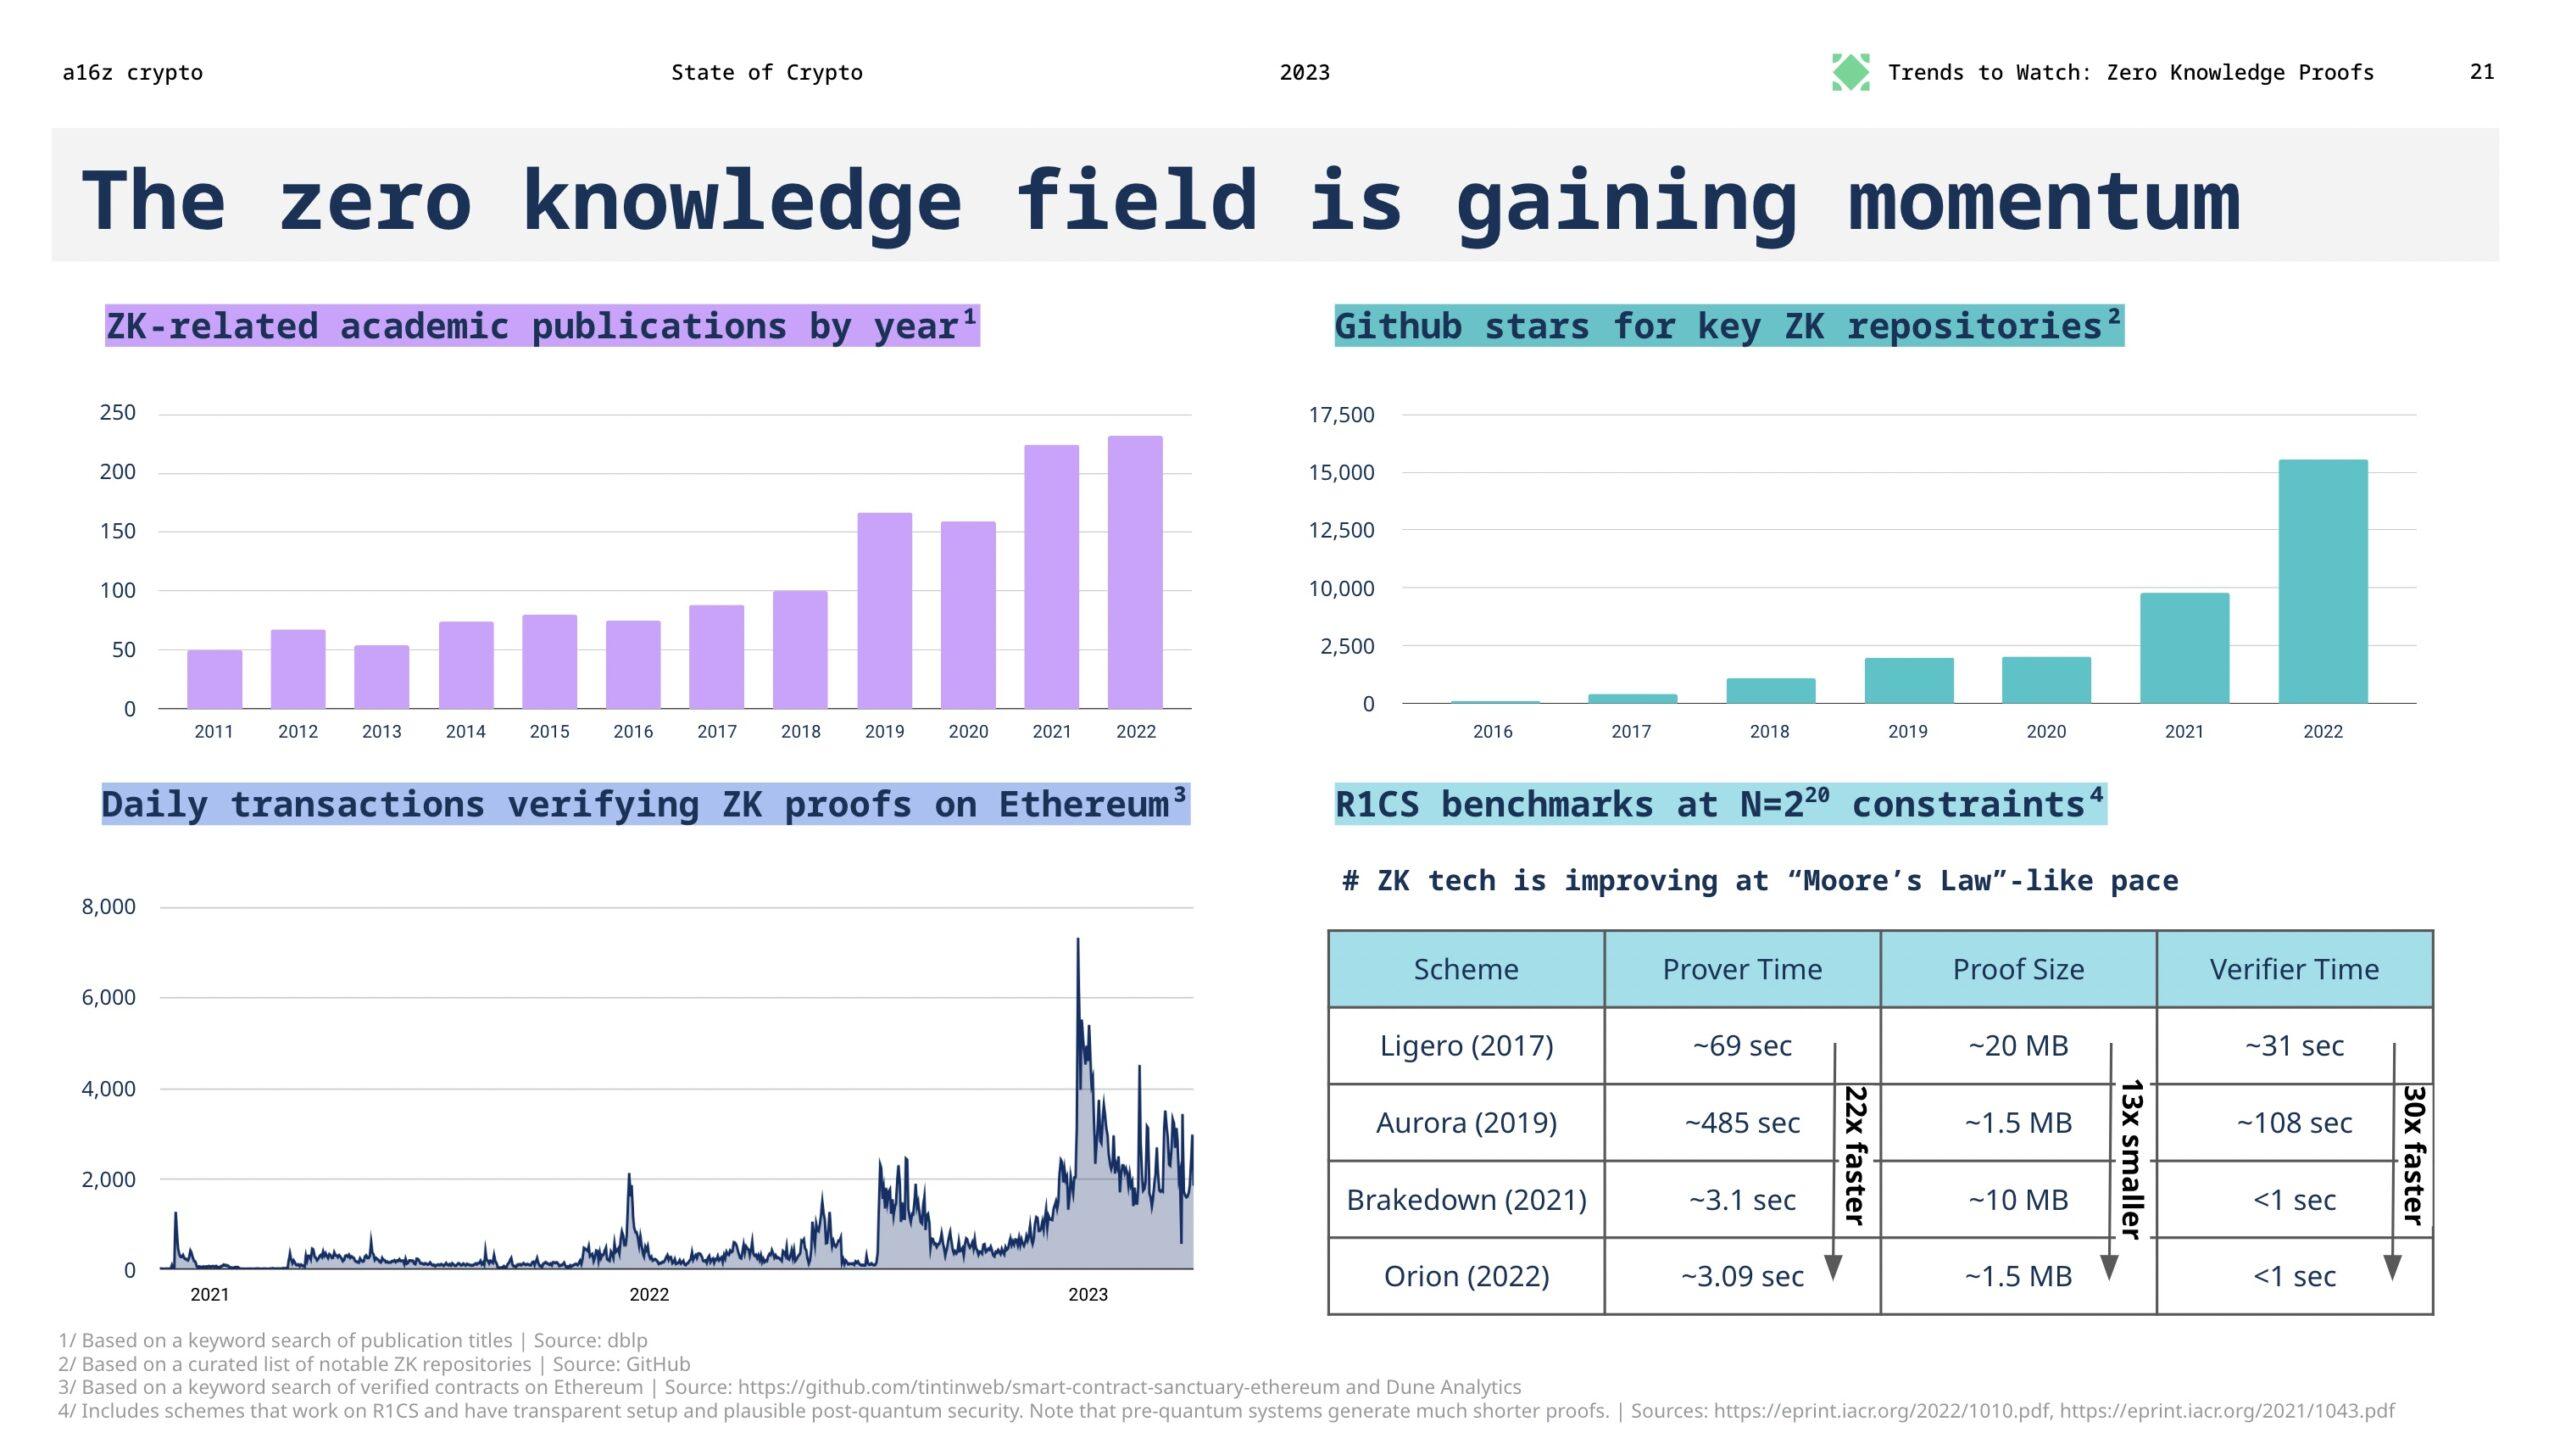
This work has been brewing for decades and has transitioned from theory to practice in recent years. Here, we seem to see technology following a pace akin to "Moore's Law." While assessing benchmarks requires many nuances, the acceleration of advancements from provers and verifiers to circuits and hardware is very evident.
6. The U.S. is losing its leading position in the Web3 space
As a set of emerging technologies, cryptocurrencies require thoughtful policy and regulatory frameworks to develop safely and realize their economic potential for the U.S. economy.
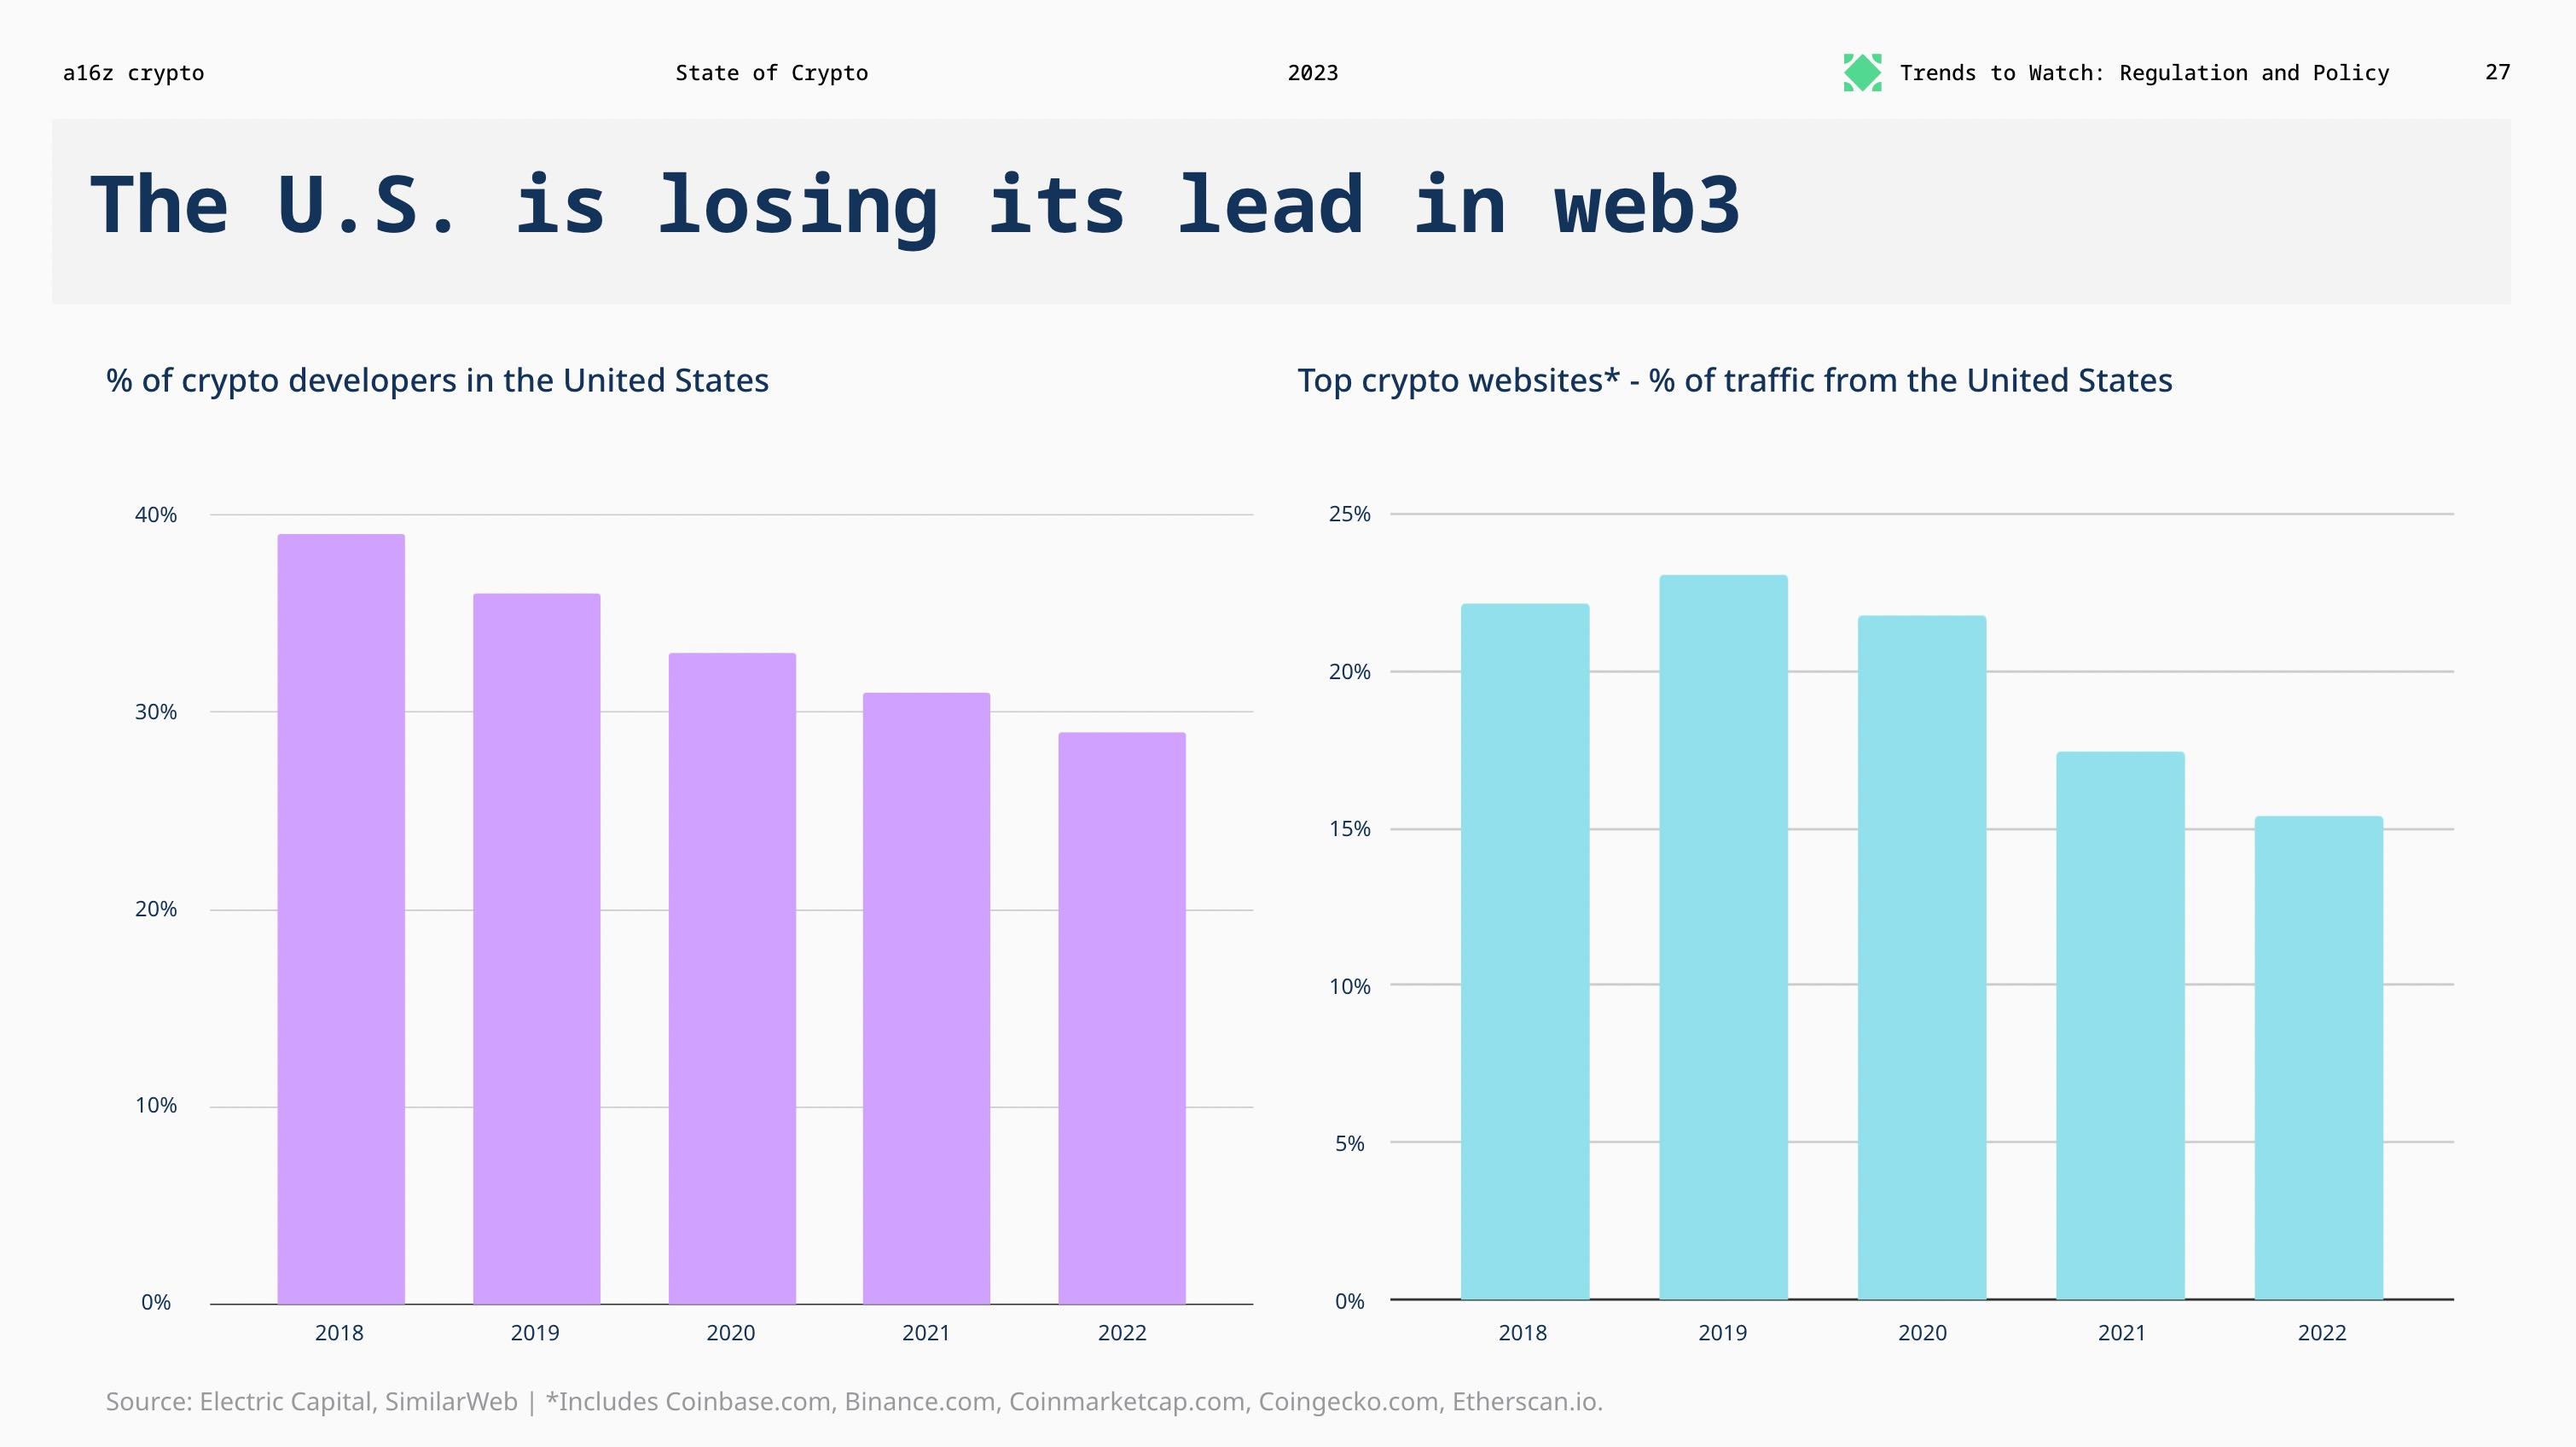
While there is much debate, the development of Web3 is hindered by regulatory ambiguity. As a result, the U.S. advantage may be declining. From 2018 to 2022, the proportion of cryptocurrency developers in the U.S. decreased by 26% compared to other parts of the world.
However, there are some positive signs—including bipartisan efforts to push for clear legislative proposals. We hope this momentum can continue, and that policymakers will fight for the future and potential of these technologies.
7. Progress in exploring key indicators over short cycles
We are still in the early stages of Web3, but we are no longer at the starting point. Short-term fluctuations reveal a clearer predictable pattern: a stable product cycle, which is distinctly different from the financial cycles that media focuses on.
We have repeatedly emphasized the importance of the "price innovation cycle," which observes that price and developer activity are in a positive feedback loop; it is a practical mental model for navigating market cycles and understanding driving cycles. When cryptocurrency prices rise, more people become interested and join. This attention, in turn, stimulates (and funds) new ideas, startups, and projects, some of which will see broader adoption in the long term.
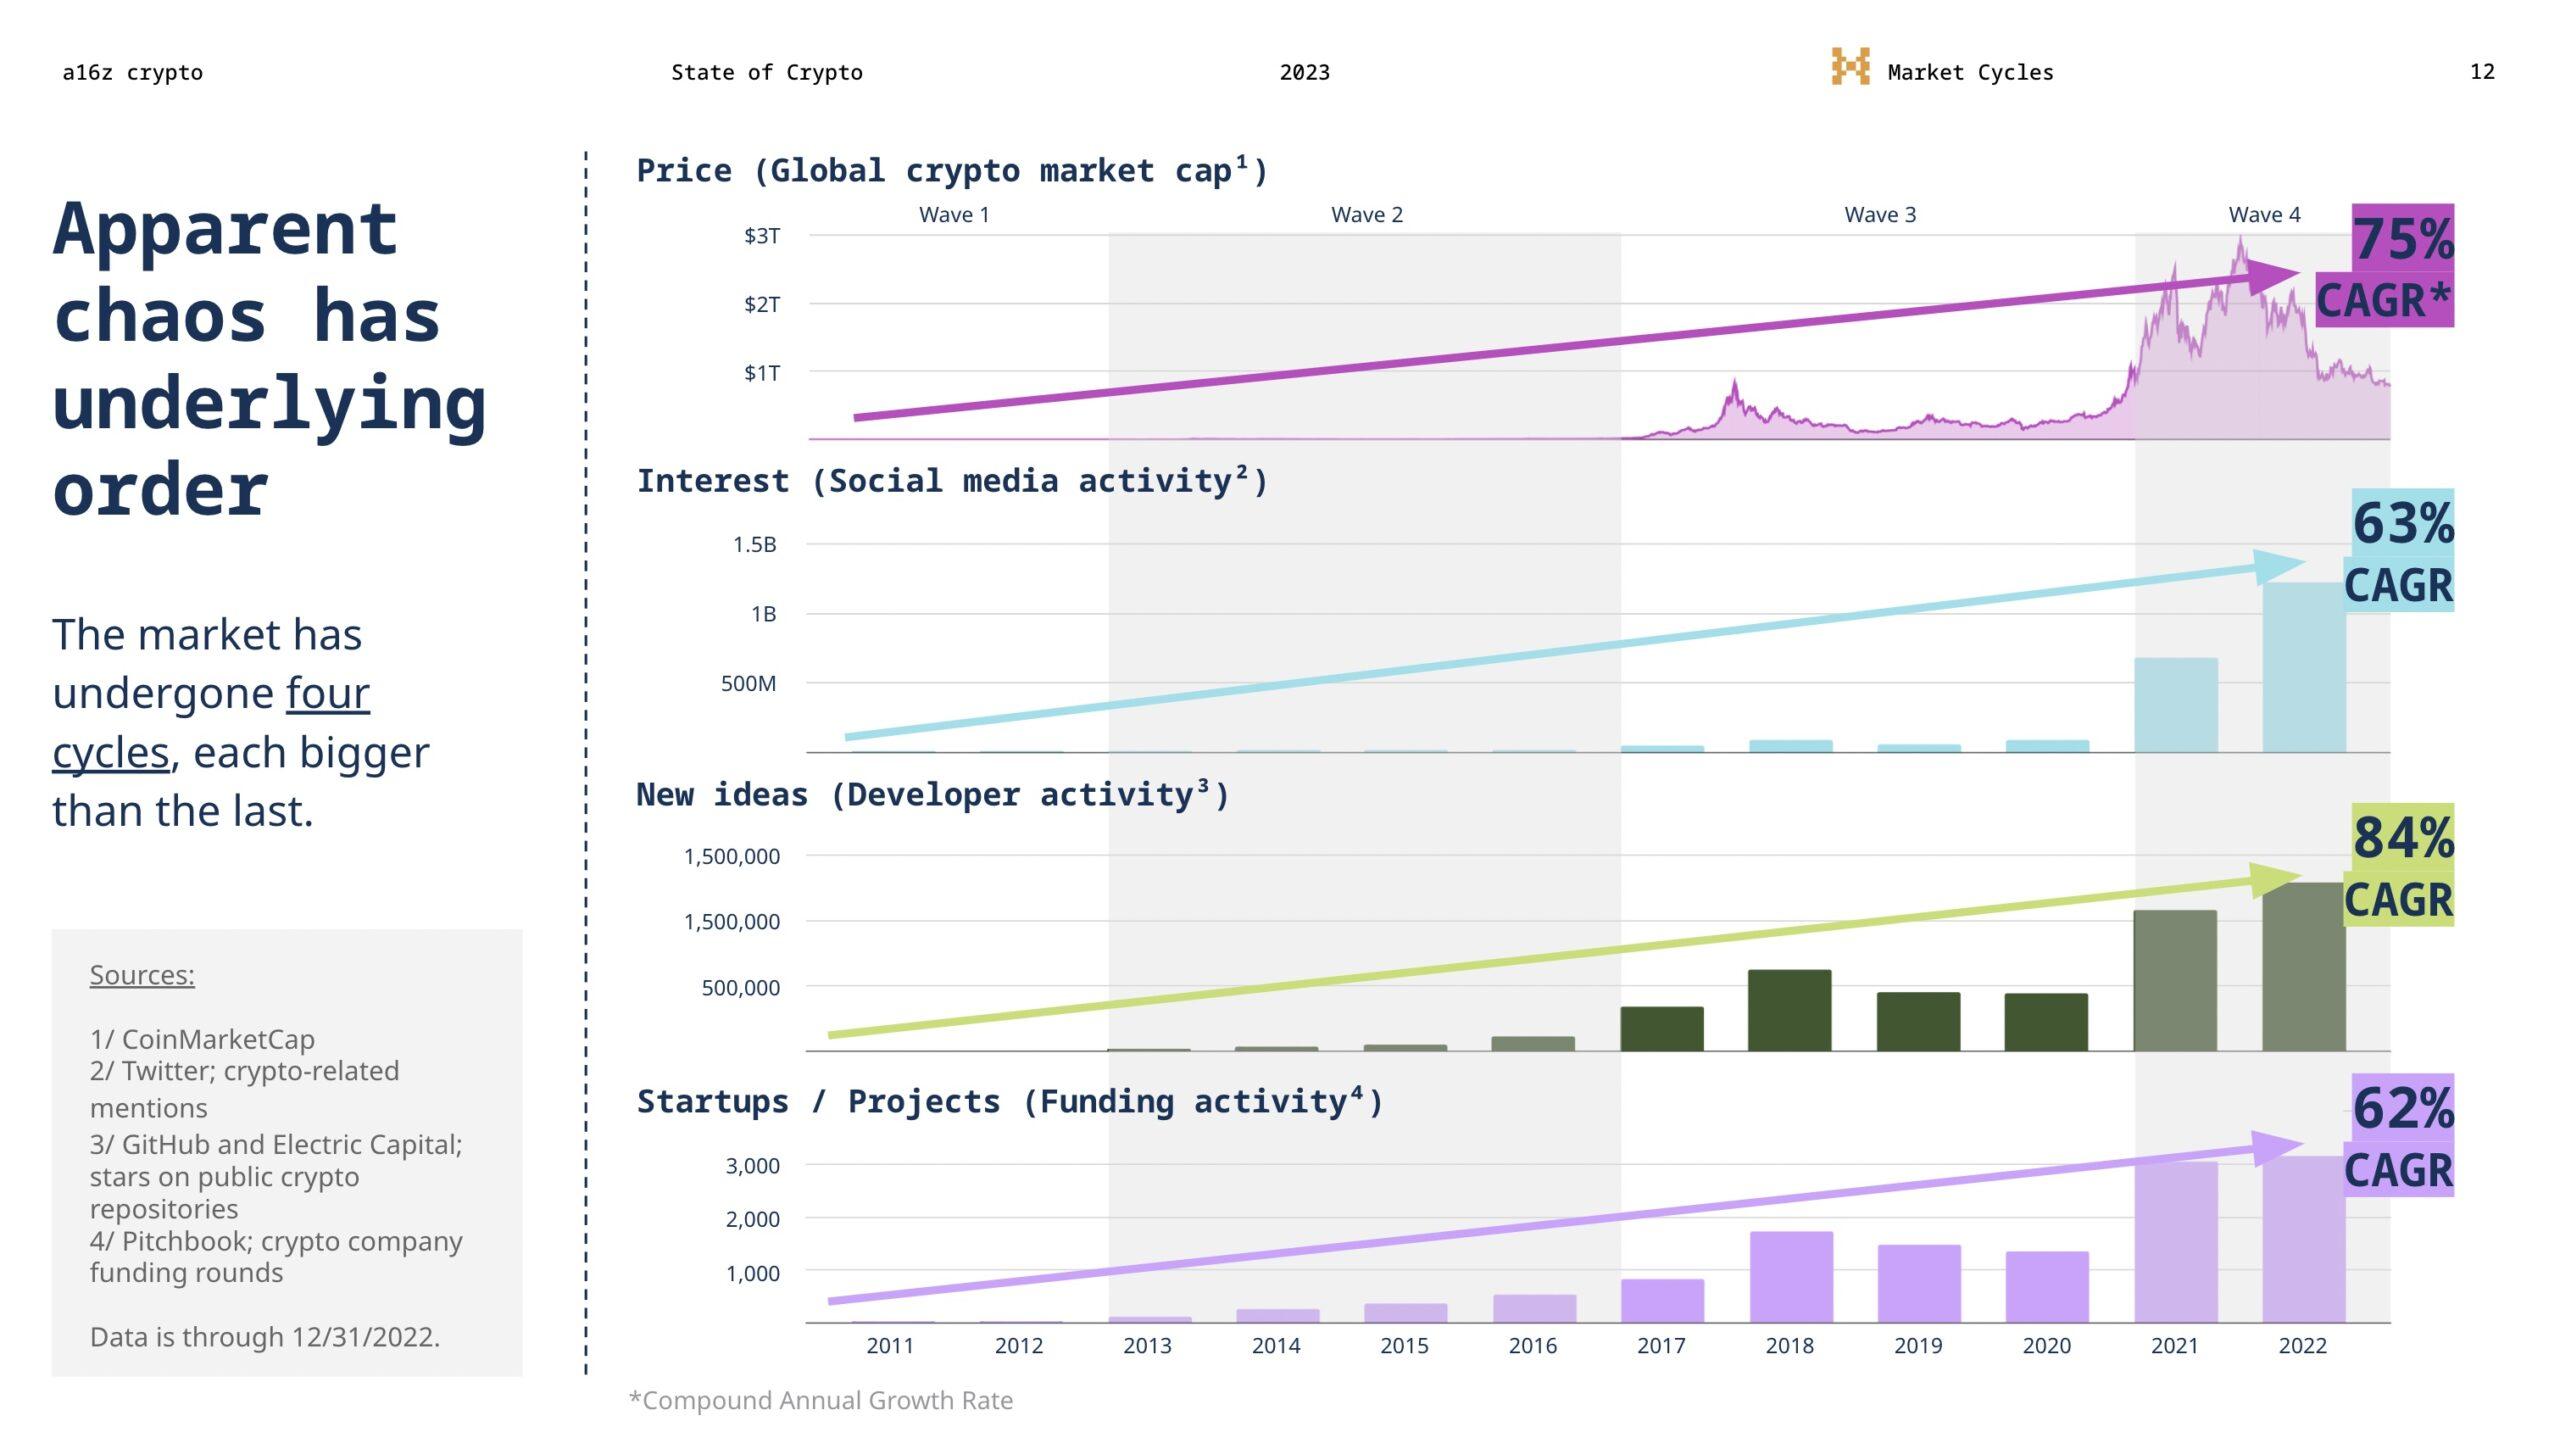
Over time, these cycles propel the industry forward in the technological wave. Since Bitcoin's inception in 2009, we may be in the midst of the fourth such cycle. In the long run, many indicators seem to be on a steady upward trend.
This is why focusing solely on short-term market movements while ignoring potential technological trends can lead to losing sight of the bigger picture. It is also why we ask ourselves: how do we track the persistent progress of the crypto industry beyond the financial dimension?
Thus, we created the State of Crypto Index, an interactive index that is updated regularly to track the growth of the industry.
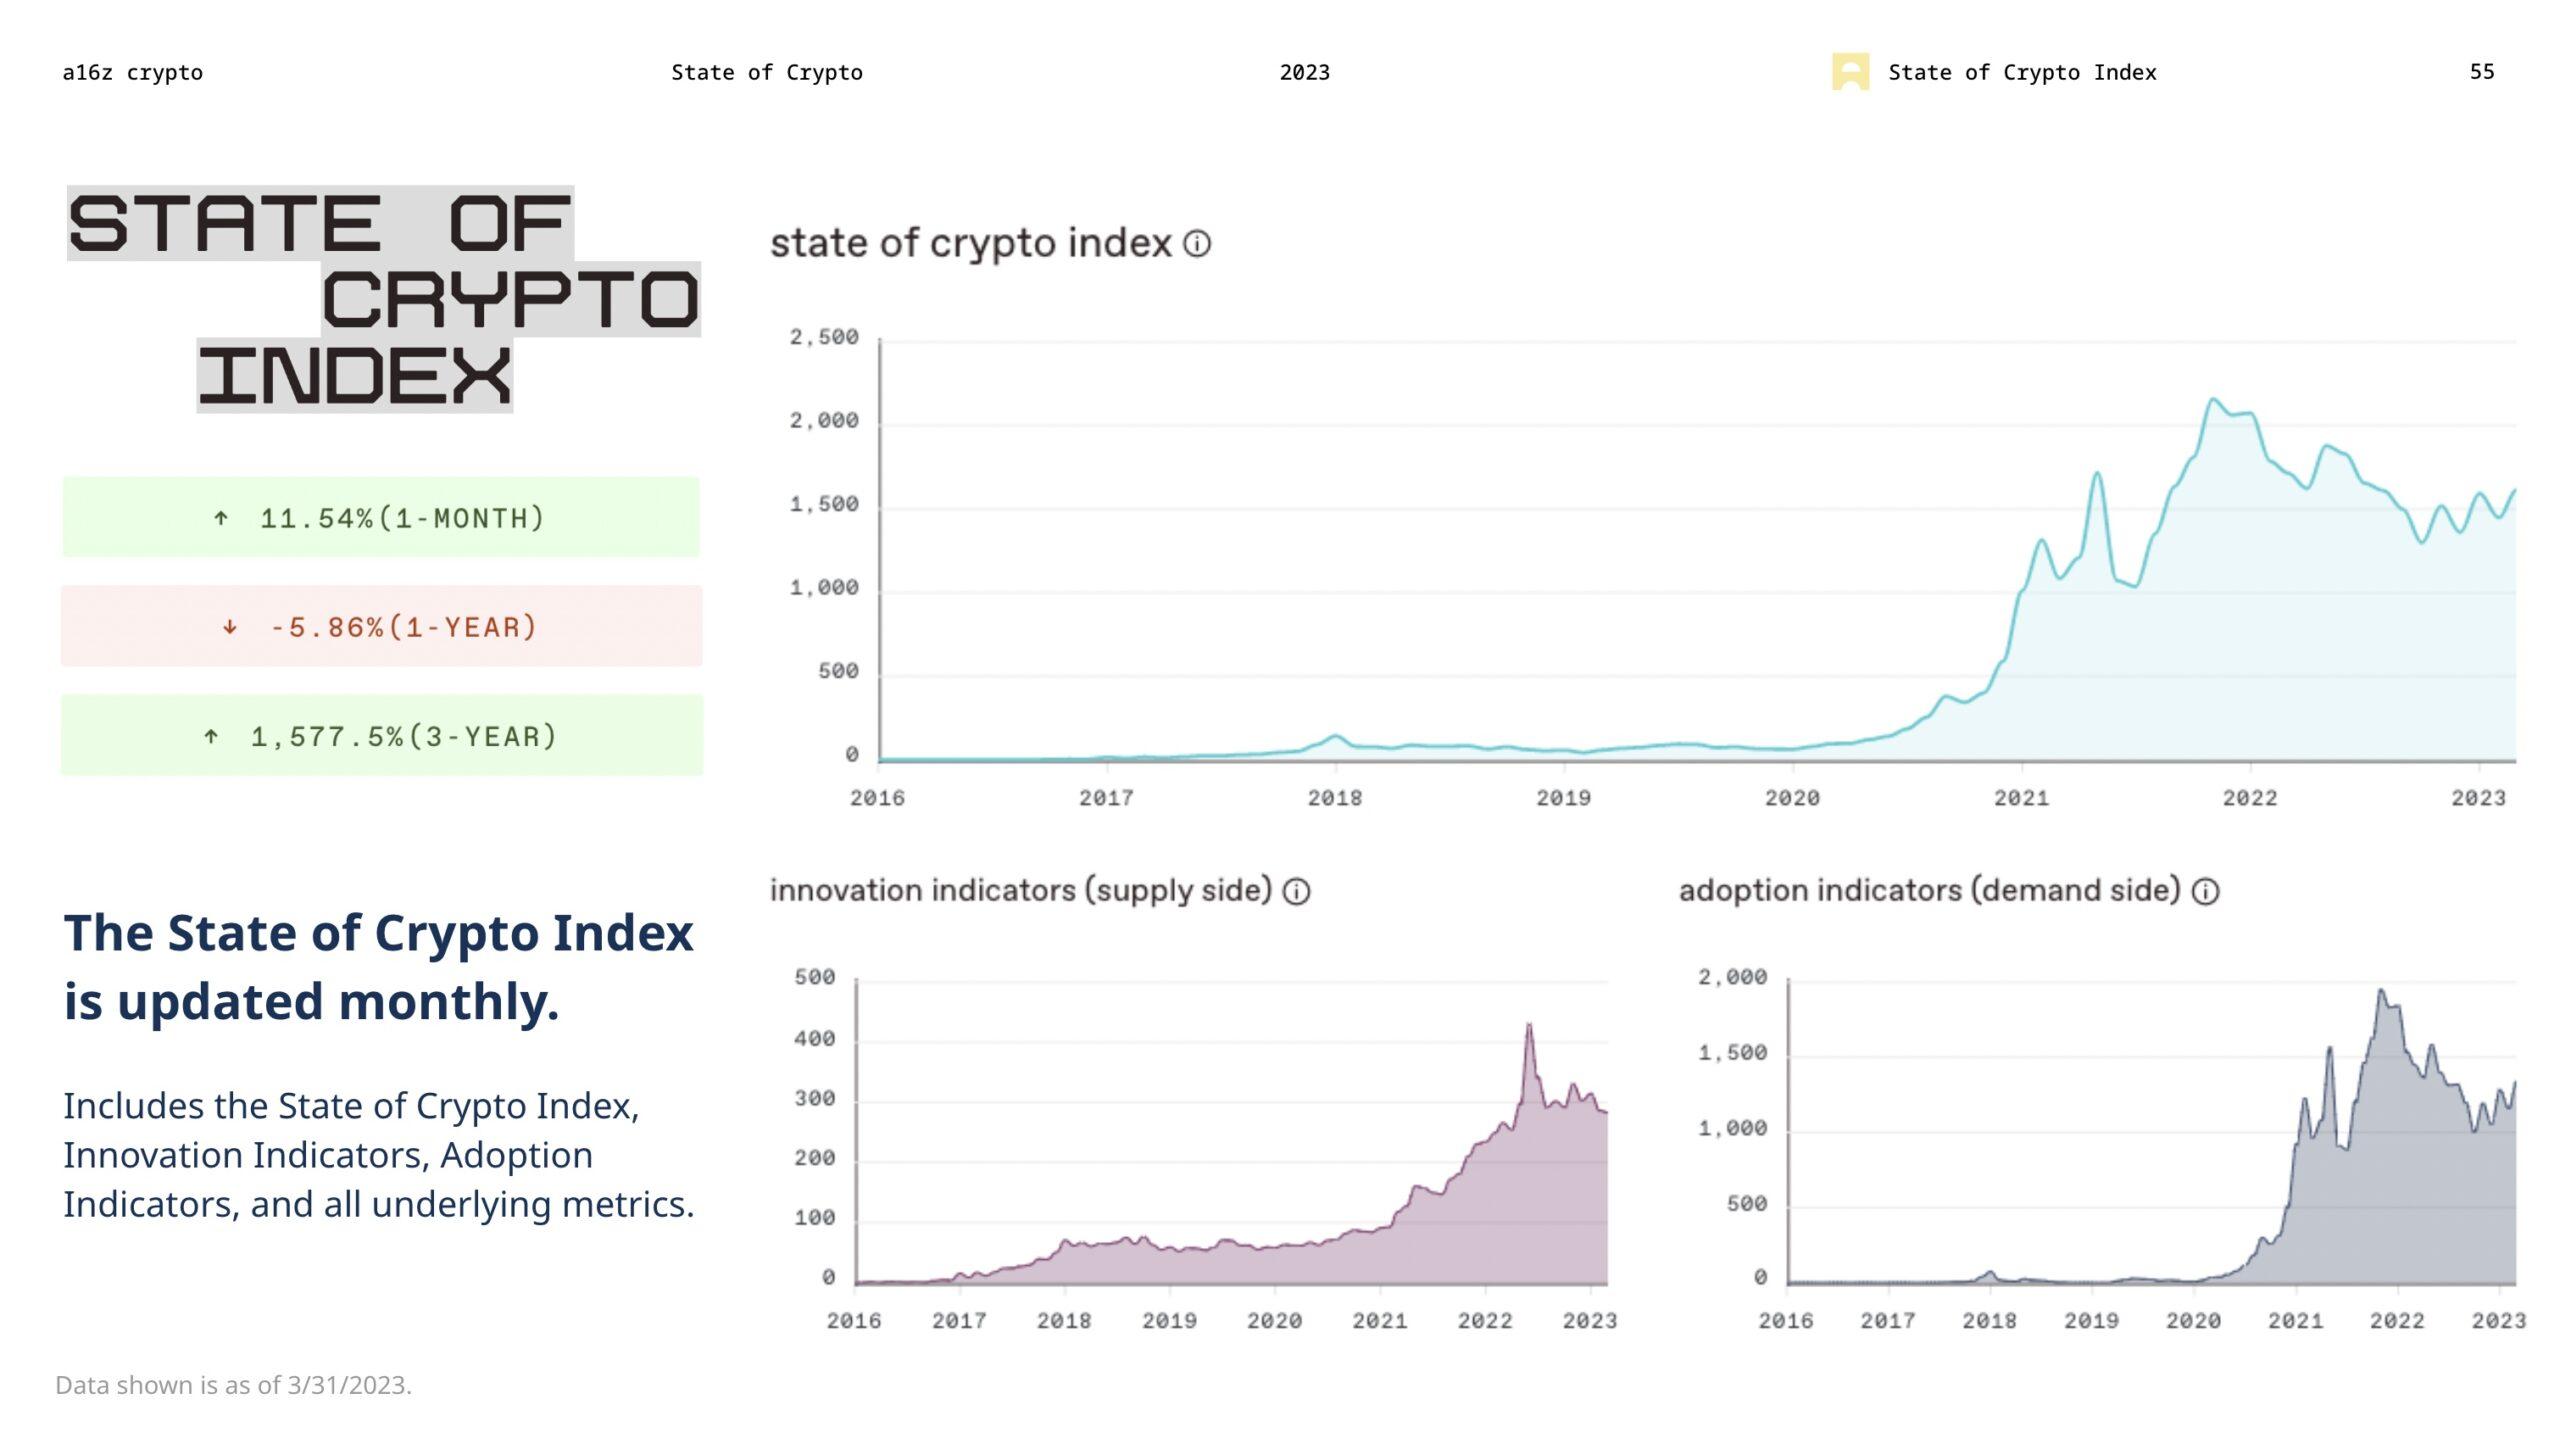
Specifically, the index shows the weighted average monthly growth of a set of key industry indicators. In addition to the index, users can also view all indicators—as a collection measured separately as supply-side and demand-side metrics of Web3 innovation and adoption—and the assumptions that mix them.
The default view shows only one interpretation of the underlying data, weighted according to our preferences. We will continue to improve this tool. However, users can now explore and adjust parameters themselves.
 Risk warning
 Risk warning


Popular articles