12 Period Data Decoding Binance Launchpool: BNB or FDUSD? How to Choose Long-term and Short-term Strategies?

 Under short-term strategies, FDUSD has higher yields and risk resistance; BNB mining is suitable for users who hold long-term and do not engage in short-term trading.
Author: Nan Zhi, Odaily Planet Daily
Recently, Binance's new coin mining can only be participated in using BNB and FDUSD. What are the differences in their yields? Which holding strategy is better in the short and long term? Odaily Planet Daily will analyze the past 12 periods of data in this article to shed light on the profit and loss situations under different strategies.
Odaily Note: The short-term strategy refers to buying FDUSD/BNB at the start of the new coin mining and selling at the end of the mining, with the net profit and loss being the mining yield minus the price difference before and after mining; readers who only want to see the final conclusion can directly read the last section of this article.
FDUSD Data Analysis
The following chart shows the relevant data for FDUSD over the past twelve periods, including price changes before and after "Binance announces new coin mining," price changes at the start and end of the "new coin mining activity," as well as the corresponding yield and short-term strategy returns.
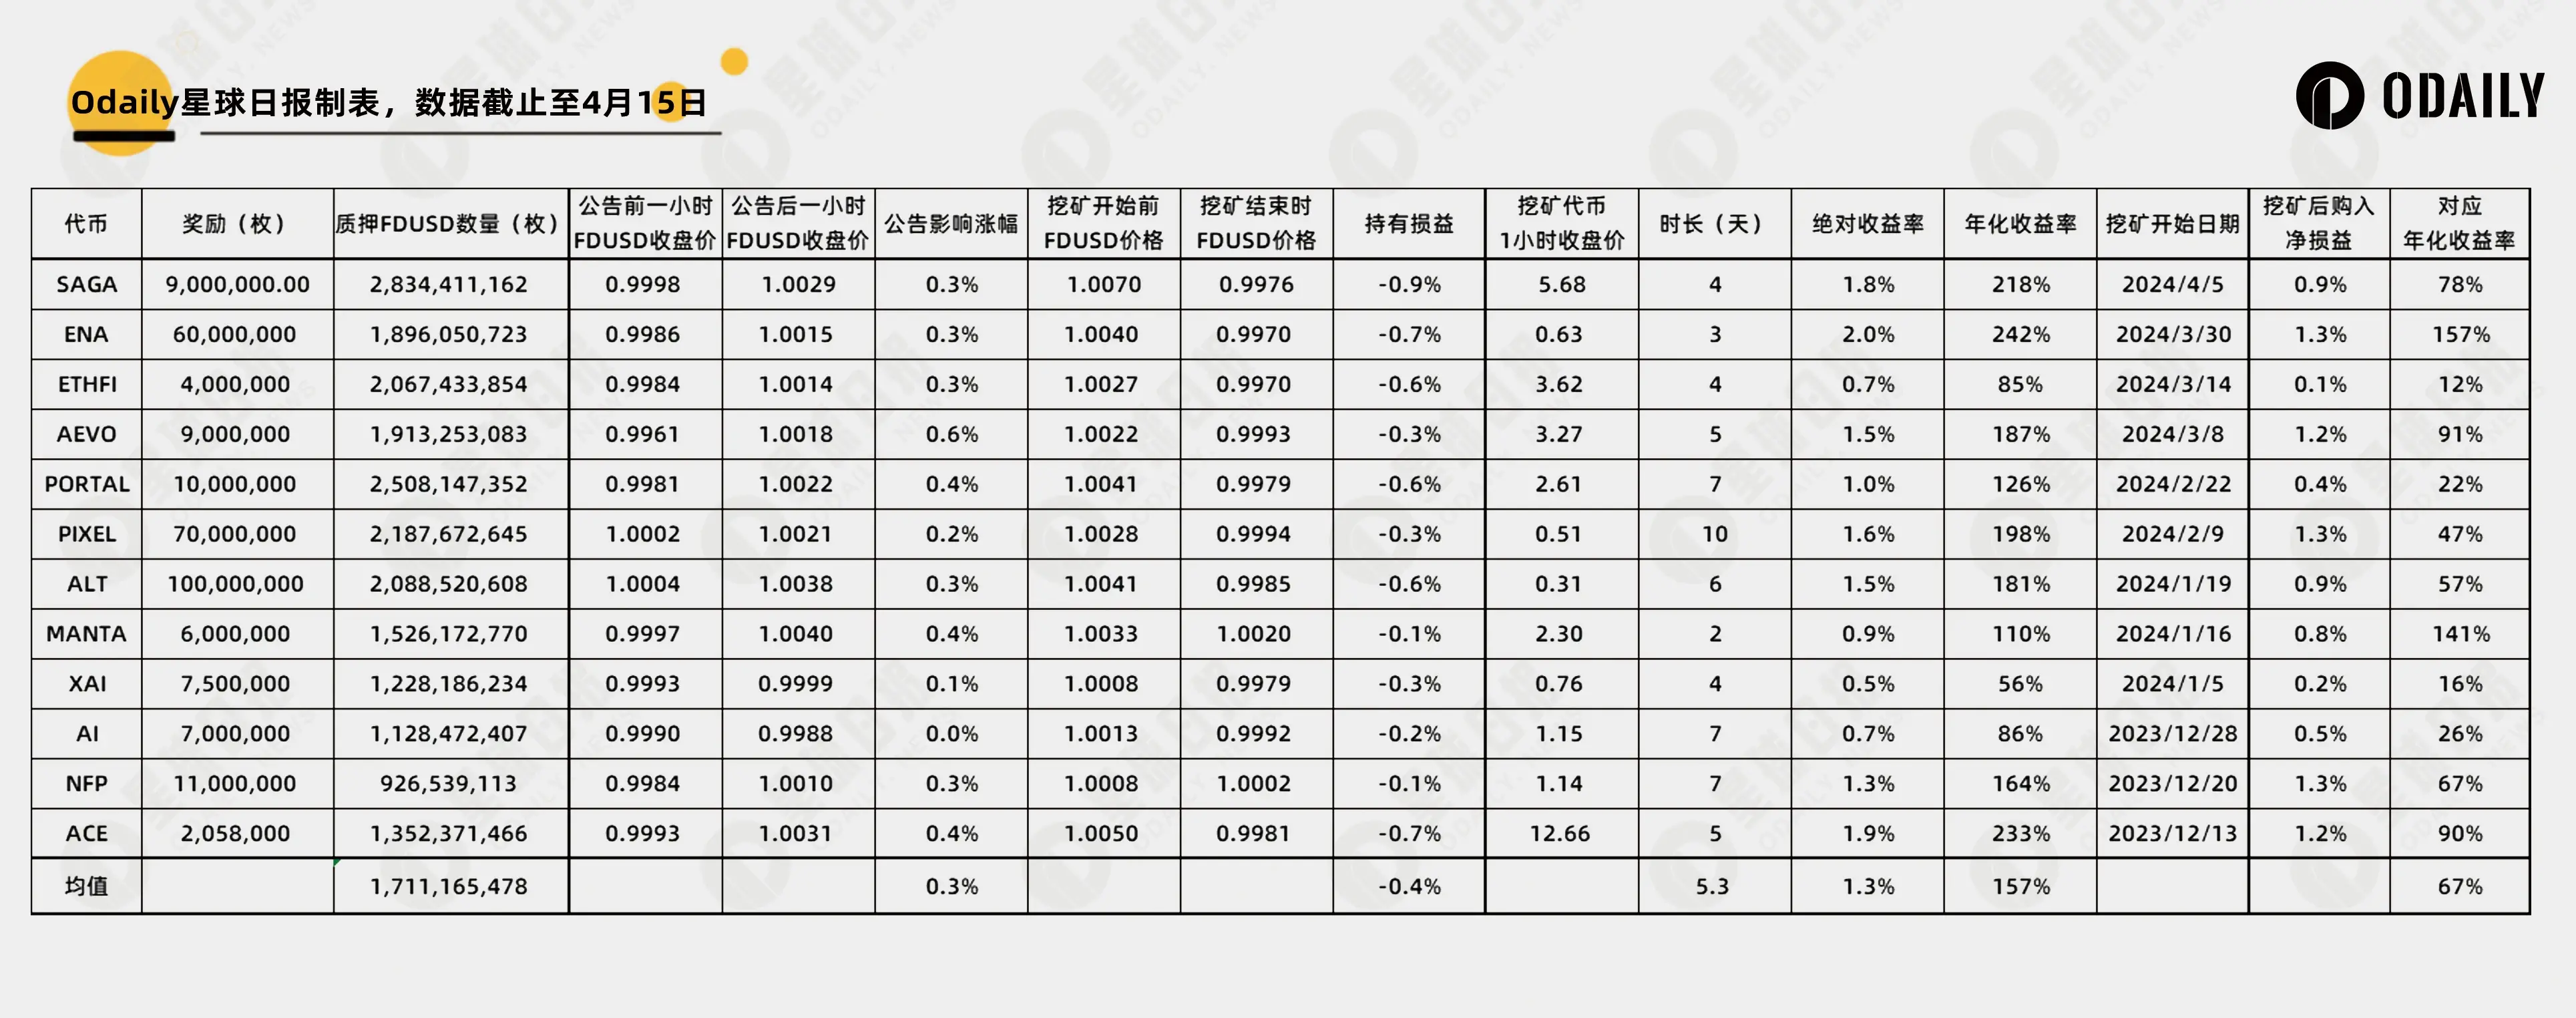
- After the Launchpool was issued, FDUSD's increase was relatively consistent, with an average of 0.3%;
- During the period from the start to the end of mining, FDUSD experienced a significant decline, with an average of -0.4%. This also indicates that FDUSD's discount rate is relatively stable, with little long-term price difference;
- Similarly, the annualized yield for each period varies greatly, with the relative sizes between periods being basically consistent with the BNB mining pool;
- Using the holding profit and loss combined with the absolute yield from mining, the absolute yield under the short-term strategy, and then converting it to an annualized yield, the average annualized yield is 67%, with no negative values, indicating that even temporary purchases yield high returns;
- Additionally, in the SAGA new coin mining period, FDUSD issued over $1.1 billion, but the yield did not decrease, and its sustainability needs to be verified over multiple periods.
BNB Data Comparison
Changing the statistical object to the BNB mining pool, all statistical criteria remain unchanged, with specific data shown in the table below.
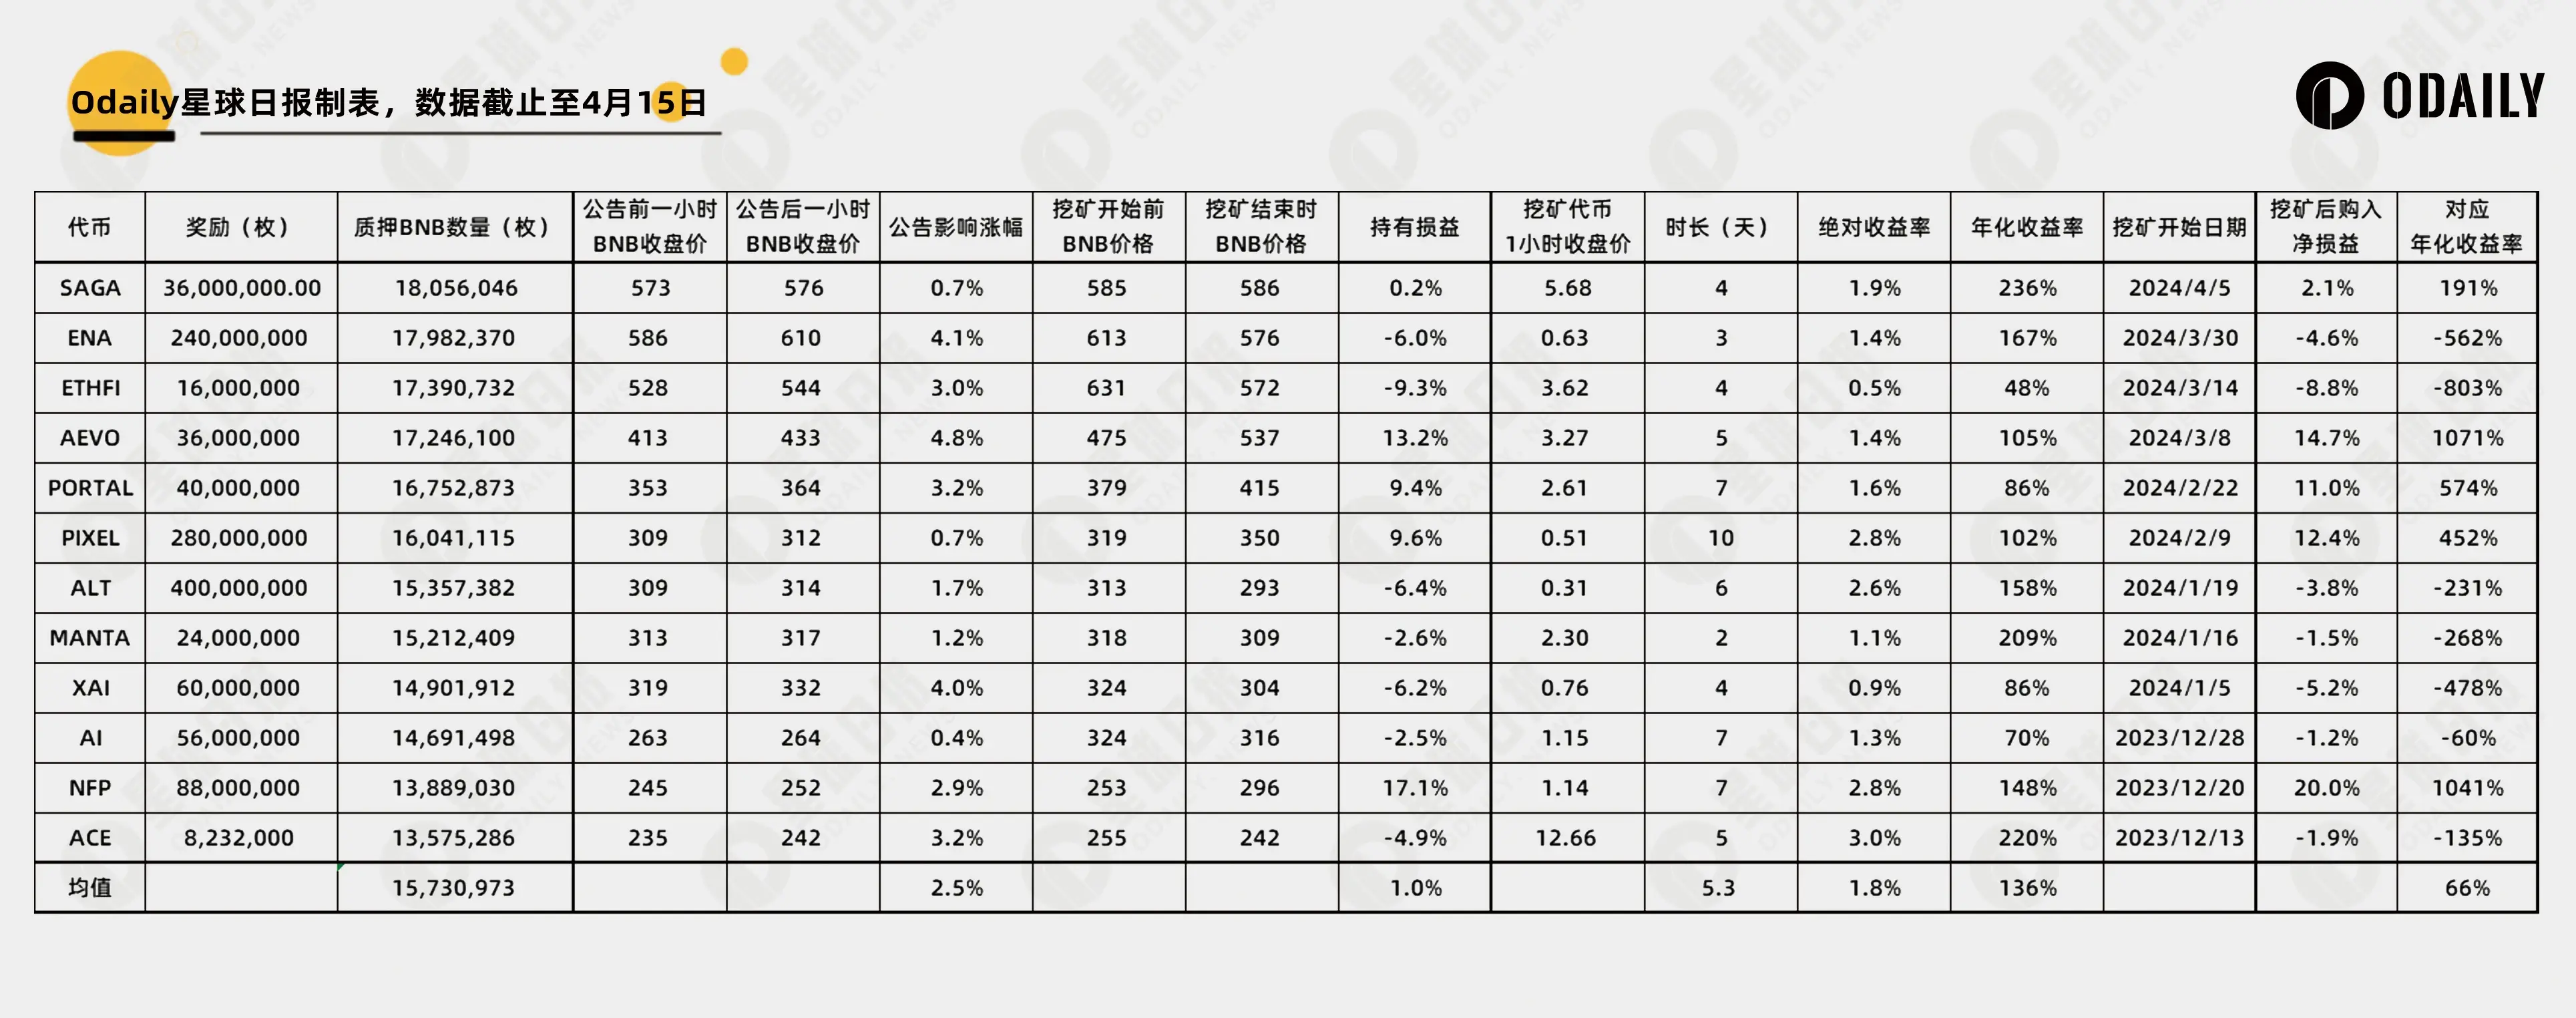
- New coin mining has a significant uplifting effect on BNB prices, with greater volatility;
- Correspondingly, the price fluctuations of BNB before and after mining are also larger, and are likely to be negative, with only 4 out of 12 periods showing significant positive numbers. This means that if BNB is purchased before mining and held until the end, it is likely to incur a certain price decline;
- The average mining yield for BNB is 136%, which is generally lower than that of the FDUSD mining pool (average 157%) before the issuance of FDUSD;
- The short-term mining strategy for BNB has extreme volatility, with average annualized yields being quite similar to FDUSD, at 66% and 67% respectively, but it should be noted that this is mainly supported by the price increases of BNB during the two rounds of NFP and AEVO (with BNB's unit price increasing by over 40 USDT).
Conclusion
If I want to make a temporary purchase, is it better to mine FDUSD or BNB?
For users who only want to obtain new coin mining yields, the returns of both are close, but FDUSD is more stable. Additionally, for users with a neutral strategy, there is no need to hedge BNB, and the yield is actually higher.
Therefore, FDUSD is the better choice under short-term strategies.
For long-term holders, which is better?
Based on the data from the past 12 periods, FDUSD's annualized yield is only 15.4% higher than that of BNB. This means that for users, if they believe BNB can rise by 15.4% from its current level, the advantages of BNB become more apparent.
However, the above conclusion is from a purely holding perspective. In reality, there are also options to collateralize FDUSD to borrow ETH and other assets, engage in on-chain mining activities during the gap period, and then switch back during the mining period, so decisions should be made based on the user's specific situation.
How long is the mining gap period?
From the start of mining with ACE to the end of SAGA, it totals 118 days, with a mining period of 64 days and a gap period of 54 days, resulting in an average interval of only 4.9 days between each period.
So what is the yield for buying the dip on BNB/FDUSD after mining ends, selling after the announcement, and not participating in the mining strategy?
For BNB, the absolute yield from the above operation is 2.44%, higher than the absolute yield from mining at 1.8%. Calculating based on the 4.9-day gap period, the annualized yield is 181.7%. However, reusing this strategy requires considering the risk of BNB's high-level decline;
For FDUSD, the yield from this operation is 0.3%, which is far lower than the mining yield of 1.3%.
 Risk warning Risk warning


Popular articles