The Great God said about the coin: Trump loudly calls for a buy at 3.4, be cautious about chasing after Bitcoin's rebound!

 On the 2nd, U.S. President Trump dropped a bombshell by announcing the inclusion of Ripple, SOL, and ADA into the U.S. cryptocurrency strategic reserve plan.
On the 2nd, U.S. President Trump dropped a bombshell, announcing that XRP, SOL, and ADA would be included in the U.S. cryptocurrency strategic reserve plan. Amidst the market's excitement, Bitcoin's price surged by 10% at one point, but its market share subsequently declined, falling below the critical 50% mark. Although Trump later emphasized that Bitcoin and Ethereum remain the core assets of the cryptocurrency reserve, the news triggered a "massive capital shift" in the cryptocurrency market, with Bitcoin's market share plummeting from 55.4% to 48.84% within just a few hours.
** Meanwhile, alternative coins surged across the board, with ADA skyrocketing by 60.3%; XRP also jumped by 34.7%; and SOL rose by 25.5% and 13.1% against Ethereum, respectively. Notably, other unnamed competing coins also rose simultaneously, while Bitcoin's gains were relatively modest, barely reaching 10%. However, it must be said that Trump's endorsement had a remarkable effect, as Bitcoin surged by $10,000 from around $85,000 to nearly $95,000 just before 2 PM, before pulling back to $90,500 at the time of writing, with a daily gain narrowing to 5.2%.**
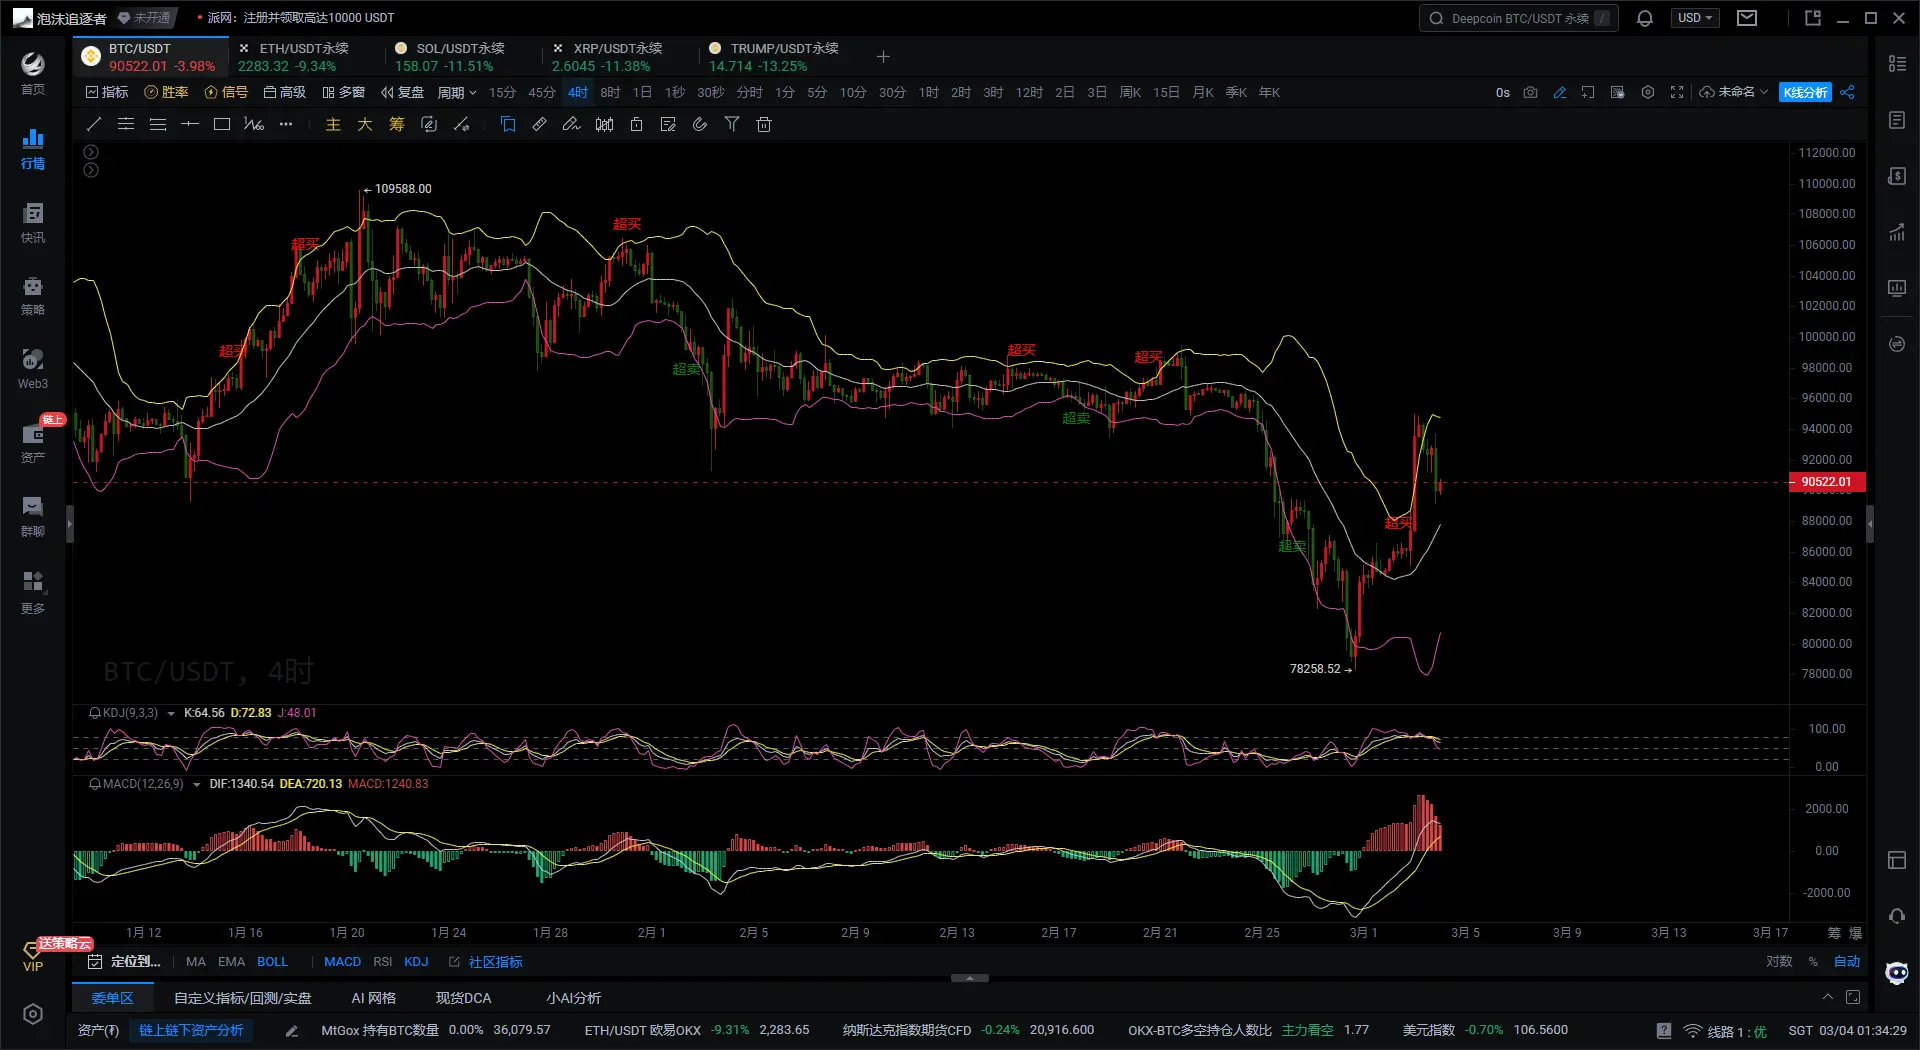
** Bitcoin 4-Hour Chart**
**  **
**
** First, according to the Bollinger Bands indicator on the 4H Bitcoin chart, the price has shown a strong rebound starting from a low of $78,258.52, successfully breaking through the resistance of the middle band. The price is currently approaching the upper band resistance, and due to the pressure in this area, there may be a risk of price correction in the short term. With the Bollinger Bands opening upward, market volatility is increasing, indicating that the current market is in an upward trend. However, short-term price adjustments are also inevitable. Currently, Bitcoin has entered a critical pressure zone between $90,000 and $92,000; if it breaks through the upper band, it may challenge $95,000, but if it corrects, attention should be paid to support around $88,000.**
** Secondly, according to the KDJ indicator on the 4H Bitcoin chart, the K and D values have climbed to around 80 and are nearing the overbought area, indicating that the upward momentum in the market may slow down in the short term. Additionally, the turning point of the J value may signal the formation of a death cross, suggesting that a correction may occur in the short term. The market has entered a short-term overbought range, and there will be a demand for correction in the short term.**
** Finally, according to the MACD indicator on the 4H Bitcoin chart, both the DIF and DEA lines are running above the 0 axis, but both lines are turning downward, and the MACD red histogram is also continuously shrinking, indicating that the current market is in a correction state. If the DIF line crosses downward through the DEA line to form a death cross signal, it will further confirm the correction trend.**
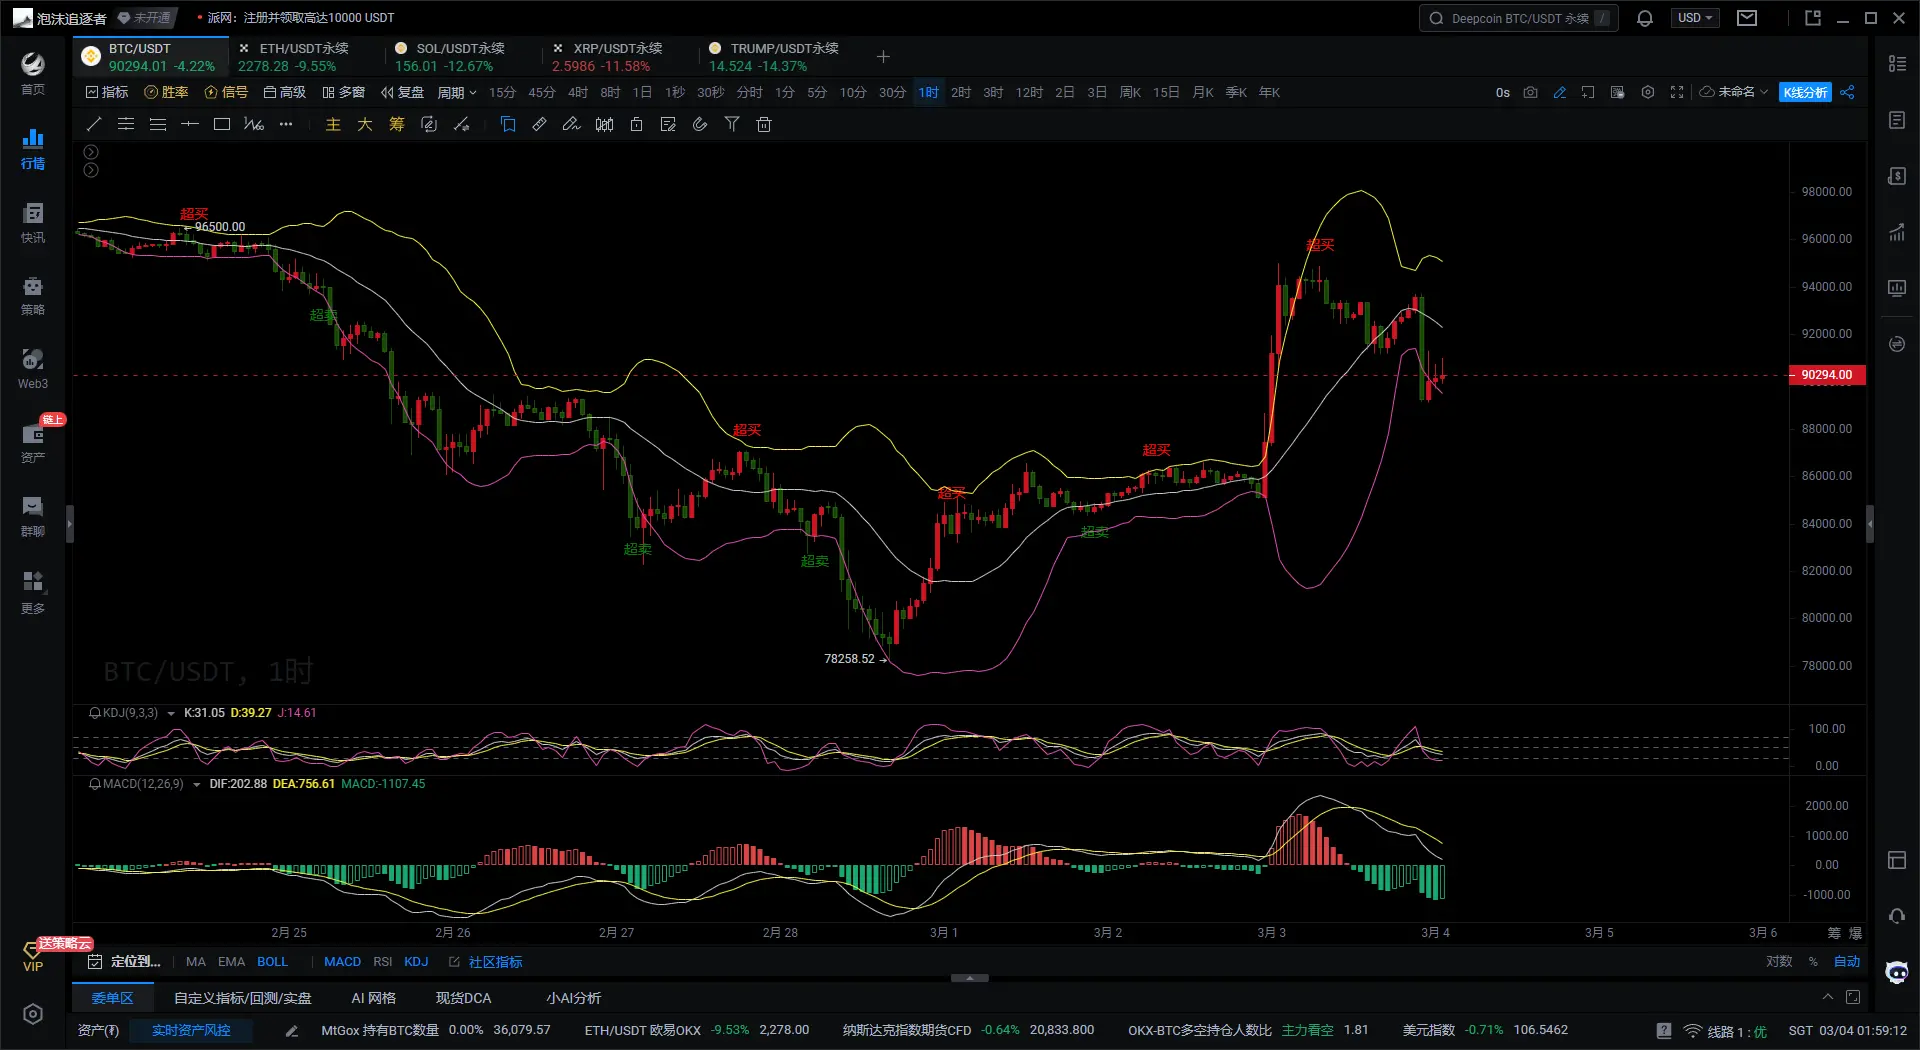
** Bitcoin 1-Hour Chart**
**  **
**
** First, according to the Bollinger Bands indicator on the 1H Bitcoin chart, Bitcoin's price is currently experiencing a strong rebound, starting from a low of $78,258 and has broken through the previous upper band, with market volatility continuing to increase. After a brief surge to $96,000 without success, the price is now slightly retreating and is consolidating near $90,000. A correction is necessary in the short term; if the price falls below the lower band support at $89,000, the market may further decline to around $87,000. However, if the lower band receives solid support, it may challenge the $92,000 to $94,000 range again.**
** Secondly, according to the KDJ indicator on the 1H Bitcoin chart, the K and D values are at a low of 30 but are not yet fully oversold, indicating that there may still be fluctuations in the short term. The J value has shown signs of a bottoming rebound; if the K value crosses upward through the D value to form a golden cross signal, a short-term rebound may occur. Conversely, if the KDJ fails to form a golden cross signal and continues to decline, the price may adjust to lower levels.**
** Finally, according to the MACD indicator on the 1H Bitcoin chart, the DIF and DEA are running above the 0 axis and have formed a death cross, indicating that the price will move downward in the short term. At the same time, the MACD green histogram is gradually increasing, indicating strong bearish pressure, and the depth of the downward adjustment may be greater.**
** In summary, after Bitcoin's price rebounded from a low of $78,258, it tested $96,000 without success and began to retreat, currently oscillating around $90,000. According to the 4H chart, the KDJ is about to form a death cross signal, and the price has fallen from the upper band to near the middle band, indicating that it is currently in a bearish trend.**
** Based on the above, I offer the following suggestions for reference:**
** Suggestion 1: Short Bitcoin near $90,500, targeting $88,000-$87,000, with a stop loss at $91,000.**
** Suggestion 2: Long Bitcoin near $87,000, targeting $91,000-$92,000, with a stop loss at $86,500.**
** Instead of giving you a 100% accurate suggestion, I prefer to provide you with the right mindset and trend. After all, teaching a person to fish is better than giving them fish. Suggestions can earn you a moment, but learning the mindset can earn you a lifetime! What matters is the mindset, grasping the trend, and planning your positions. What I can do is use my practical experience to help you, guiding your investment decisions and management in the right direction.**
** Writing time: (2025-03-04, 01:30)**
** (Article by: Master Daxian)**