On-chain liquidity changes: After 15 months of ups and downs, who remains standing after the hype fades?

 The future of DeFi lies not in multi-chain expansion, but in protocols that can transform industry narratives into user habits.
Original Title: Where is Onchain Volume Rotating?
Original Author: Stacy Muur
Original Compilation: Tim, PANews
In the past 15 months, the liquidity landscape of DeFi has been reshaped across various chains. Projects driven by speculative hype have gradually exited the stage, and liquidity has quietly concentrated in places with strong fundamentals rather than market speculation.
Key Insights
- DEX trading volume reached a historic high of $38 billion in January 2025, followed by a 35% drop in the next two months, suggesting that January may have formed a short-term peak.
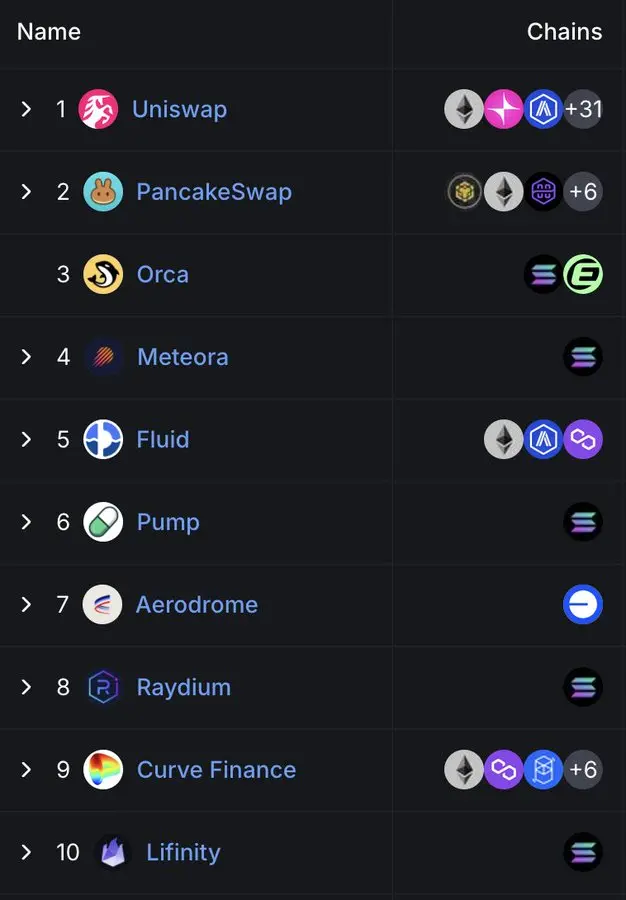
- Currently, the top ten DEXs account for nearly 80% of the total trading volume; Uniswap and PancakeSwap alone account for about 40% of the share.
- Solana-based DEXs have quietly dominated the leaderboard, occupying 5 out of the top 10 spots, with their market share growth primarily driven by the trading volume brought by the Meme coin craze.
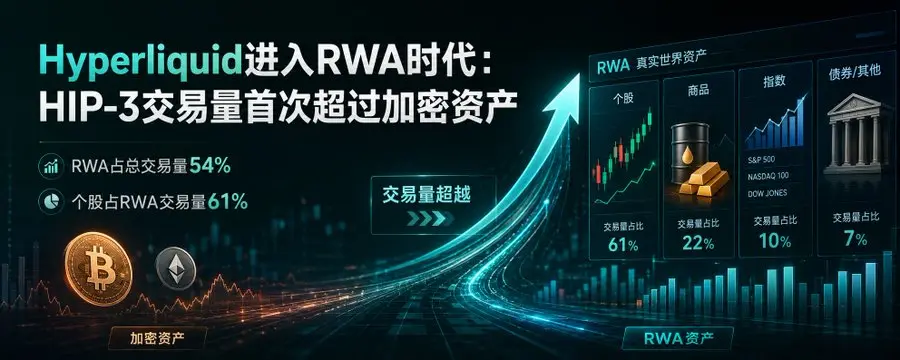
- Hyperliquid has completely transformed the perpetual contract landscape, rising from an industry newcomer to capturing over 60% of the market share by March 2025.
All insights in this article are based on publicly available data. Special thanks to DefiLlama for continuously providing high-quality statistical data.
Cycles Defined by Surge and Slowdown
At the beginning of 2024, DEX trading volume performed strongly in March and May, then gradually slowed down before mid-year.
The situation changed dramatically in the fourth quarter, with trading volume surging in November and December, a momentum that continued into January 2025, reaching an explosive peak of $38 billion.
However, this rebound was short-lived. By February, market trading volume had plummeted to $24.5 billion, marking a 35% cliff drop that ended three months of vertical surges. This decline set the tone for a more cautious second quarter.

DEX Dominance: Leading Protocols Hold Power
The market landscape for DEXs remains highly concentrated. Currently, the top ten protocols account for 79.5% of daily trading volume, with the top five alone accounting for 59.1%.
Uniswap and PancakeSwap together account for about 40% of DEX trading volume, being the only two platforms to surpass a cumulative trading volume of $1 trillion. Their leading position stems from first-mover advantage, extensive support for multi-chain ecosystems, and deep liquidity.
Uniswap Labs has also launched Unichain, a second-layer network on Ethereum built on the Optimism Superchain. This chain aims to achieve fast, low-cost transactions through native multi-chain interoperability.

The Quiet Rise of Solana
Notably, Solana's position in the DEX space is becoming increasingly prominent. Currently, five of the top ten DEXs, including Orca, Meteora, Raydium, Lifinity, and Pump.fun, are natively developed on Solana.
Orca (8.02%) and Meteora (6.70%) alone account for about 15% of global decentralized exchange activity.
This growth is driven by low GAS fees, fast block times, and the Solana Meme coin craze. Pump.fun's rise to the top ten is a testament to this fervor.
Emerging Protocols: Fluid and Aerodrome
Fluid (7.09%) is the most capital-efficient platform among the top five DEXs. The protocol is active on Ethereum, with monthly settlements exceeding $10 billion. Its performance has been particularly impressive since launching in the Arbitrum ecosystem: trading volume surged from $426 million in February to $1.6 billion in March, clearly indicating its adoption speed far exceeds the industry average.
Aerodrome, as a native project of Base, showcases the sustained growth of liquidity on Base L2.
Although Hyperliquid does not rank high in the spot market, it dominates the perpetual contract market, with a market share exceeding 60%.

DEX Market Share Across Chains: Easy to Grow, Hard to Retain
The past 15 months have clearly demonstrated a phenomenon: most blockchain projects can attract attention, but only a few can maintain lasting appeal. From January 2024 to March 2025, the market share of chain-level decentralized exchanges changed rapidly, with only a handful of projects truly exhibiting user stickiness.

Solana achieved the most significant breakthrough. It steadily climbed in 2024, driven by the TRUMP and MELANIA Meme coin craze, reaching a market share peak of 45.8% in January 2025. However, by March, its market share was halved to 21.5%, yet it still maintained the top position among public chains with an average share of 25.1%.
Ethereum, on the other hand, had a completely opposite trajectory. Starting with about 32% in early 2024, it dropped to 15.3% in January 2025, then rebounded to 26.4% in March. Even though Ethereum lost growth momentum, its ecological resilience remains.
Base can be considered the most robust contender. It grew steadily from 3% in March 2024 to 12.4% in December, then fell back to 7.4% in March 2025, maintaining an average share of 6.6% during this period. Without speculative support, it has achieved slow but sticky growth.
BNB Chain maintained stability with an average share of 14.7%. There were neither explosive rises nor falls, consistently sustaining stable retail capital flow.
Arbitrum started strong (16% share) but faltered later, dropping to 4.8% by January 2025, surpassed by both Base and Solana.
Blast reached a market share peak of 42.3% in June 2024 but disappeared the following month. This is a clear case of incentive-driven trading volume with zero user retention.
In summary: The DEX dominance of various public chains exhibits strong volatility. Solana once surged, Ethereum achieved value recovery, Base gradually expanded its ecosystem, while the market speculation cycle showed characteristics of significant ups and downs. Ultimately, the public chain that occupies the dominant position is not the one with the loudest voice, but the one with the highest actual usage rate.

Centralized Exchanges Still Dominate Spot Trading Volume
Despite the explosive growth of DEXs in early 2025, centralized exchanges still dominate the spot market. Even in January, when DEX trading volume peaked, CEXs accounted for nearly 80% of the total trading volume.
Although the dominance of centralized exchanges dropped from 90% in early 2024 to a low of 79%, the broader trend is evident: while DEXs continue to grow, CEXs remain the default choice for most traders.

Market Share of Perpetual Protocols
The landscape of on-chain perpetual contracts underwent a fundamental shift in 2024.
After dYdX held the top position in perpetual contract trading for over two years, Hyperliquid emerged, redefining what dominance means. The platform first topped the charts in February but was briefly surpassed by SynFutures mid-year, reclaiming the top spot in August and then maintaining a significant lead. As of March 2025, Hyperliquid accounted for nearly 59% of the total trading volume in perpetual contracts, solidifying its position as the preferred platform for professional traders.
This rise has attracted considerable market attention, with its product experience closer than ever to that of centralized exchanges. In contrast, dYdX's market share has rapidly declined, falling from 13.2% at the beginning of 2024 to just 2.7% by March 2025, as users flocked to faster, more streamlined, and modern alternative platforms.
Jupiter's perpetual contracts took a different path, leveraging Solana's native liquidity and the traffic from its spot DEX, rising to second place with an 8.8% market share. Although it surged quickly, it ultimately fell behind Hyperliquid. Other projects like SynFutures, Vertex Protocol, and Paradex also briefly shone.

Perpetual Contract Chains: Execution Layer Reconstructed in One Cycle
The most significant change in the perpetual contract infrastructure over the past year is not which protocols users prefer, but which chains they trust to execute trades.
By March 2025, the trading volume share of perpetual contracts on Ethereum and Arbitrum had plummeted to 11.8%, a stark contrast to their combined market dominance of over 65% in January 2024, as newer, faster execution layers have fully taken over.

The driving force behind this shift is Hyperliquid's self-developed blockchain. During the same period, it significantly increased its market share from 13.6% to 58.9%, replacing various Layer 1 and Layer 2 solutions that once defined industry standards, becoming the default execution environment for perpetual contract trading. Its advantages lie not only in faster transaction speeds but also in providing the reliability and low-latency guarantees demanded by professional traders.
Solana also experienced a strong rise, driven by the Jupiter and Phoenix projects at the end of 2024, with its market share climbing to nearly 16%. However, it ultimately stabilized in the 10-11% range, failing to sustain its breakthrough growth momentum. Meanwhile, the Base and ZKsync ecosystems showed vitality (with market share peaks reaching 6-7%) but never managed to break into the ranks of top public chains.
At the same time, Blast serves as a cautionary tale: this fleeting project reached an 18.8% market share in June 2024 but vanished just as quickly. In a field driven by product quality and user retention, mere speculation cannot last. The new industry execution standard is clear: performance-centric public chains have redefined the competitive benchmark, and traditional infrastructure no longer holds a default advantage.

The future of DeFi lies not in multi-chain expansion, but in protocols that can transform industry narratives into user habits.
 Risk warning
 Risk warning


Popular articles