BTC Volatility Review (July 21 - July 28)
Summary:
Last week, the market entered a consolidation phase, attempting to test the support level of $115,000 on Friday. After briefly breaking below it, the price quickly rebounded and ultimately held the level. Currently, the price has returned to the consolidation range, but upward momentum has strengthened. On the surface, this pattern lays a strong foundation for a return to the all-time high (ATH). If the breakout is successful, the target price may point to the range of $125,000–$135,000.

2025-07-29 19:33:22
Collection
 Last week, the market entered a consolidation phase, attempting to test the support level of $115,000 on Friday. After briefly breaking below it, the price quickly rebounded and ultimately held the level. Currently, the price has returned to the consolidation range, but upward momentum has strengthened. On the surface, this pattern lays a strong foundation for a return to the all-time high (ATH). If the breakout is successful, the target price may point to the range of $125,000–$135,000.
Key Metrics (July 21, 4 PM HKT to July 28, 4 PM HKT)
- BTC/USD -0.3% ($119,400 → $119,000), ETH/USD +2.4% ($3,800 → $3,890)

- Last week, the market entered a consolidation phase, attempting to test the support level at $115,000 on Friday. After briefly breaking below, it quickly rebounded and ultimately held the level. The price has now returned to the consolidation range, but upward momentum has strengthened. On the surface, this pattern lays a strong foundation for a return to the all-time high (ATH); if a breakout occurs, the target price may point to the $125,000--$135,000 range.
- If it breaks below $115,000, the pullback may deepen, potentially moving down to around $112,000. If the stronger support level at $109,000 is lost, it could lead to a more significant price adjustment, and we would need to reassess the trend.
Market Themes
- Overall, market sentiment remains optimistic: U.S. stock earnings data remains robust, continuing the "Goldilocks" scenario, and economic data paves the way for the Federal Reserve to cut rates in the coming months, with no significant signs of rising inflation risks. Although there are still noises regarding tariff issues, the peak of uncertainty has passed, and most countries (except China) have ultimately compromised with the U.S./Trump's demands, making the U.S. the biggest beneficiary.
- Cryptocurrencies have generally maintained strength in this environment, but crypto-related stocks (such as $SBET and $BMNR, among others) saw significant pullbacks last week due to a return to rationality in the market and the fading of the meme craze. However, spot prices were not significantly dragged down: ETH held above $3,700; BTC, despite facing pressure from long-term holders selling $9 billion through Galaxy (executed last Friday), still showed strong support around $115,000, rebounding to above $119,000 after the weekend. Current participation in the bull market is slightly subdued due to the summer off-season, but if the macro environment stabilizes, it may attract more capital inflows in the coming months.
BTC USD ATM Implied Volatility

- Actual volatility fell back to the mid-20% range early last week (as spot prices hovered around $118,000--$119,000), but before the weekend, MSTR announced a $2.5 billion stock issuance (originally planned for $500 million), which briefly pushed prices up to $120,000. Subsequently, Friday's $9 billion selling pressure caused the spot price to drop to $115,000. Although it recovered to $118,000 and tested $120,000 on Monday morning, short-term implied volatility continued to decline, as the market clearly remained in the bullish Gamma excess range of $115,000--$121,000.
- The term structure is gradually steepening, but it remains relatively flat compared to historical levels, making it difficult for the market to price long-term term premiums. However, the liquidity of long-term option sellers has dried up, combined with localized price fluctuations (such as dropping to $114,600 on Friday), leading us to continuously see the market attempting to capture directional opportunities through options expiring in September to December—considering the low underlying volatility and higher leverage.
BTC USD Skew/Kurtosis

- Skew: There has been a surge in demand for bearish options in the short term (due to concerns over a deep pullback to $112,000--$110,000 triggered by Friday's sell-off), and the hedging buy orders at the $110,000 strike price for the 1-2 month period further pushed up the bearish skew. Although actual volatility has not significantly increased, and volatility was equally intense during price rebounds, it is expected that the skew price is unlikely to sustain current levels unless $115,000 is confirmed to break down. Long-term demand remains concentrated on bullish options, supporting a skew tilted upwards.
- Kurtosis: In the short term, it has risen due to increased demand for bearish hedging on the wings. The butterfly curve is severely inverted, and with BTC asset volatility at historical highs, the strategy of "going long on long-term butterfly options + going short on short-term butterfly options" offers a better cost-performance ratio in this environment.
- Wishing you successful trading this week!

 Risk warning Risk warning

Popular articles
Why does SpaceX, with an annual loss of 5 billion dollars and a valuation of 2 trillion dollars, captivate crypto players so much?
04-15

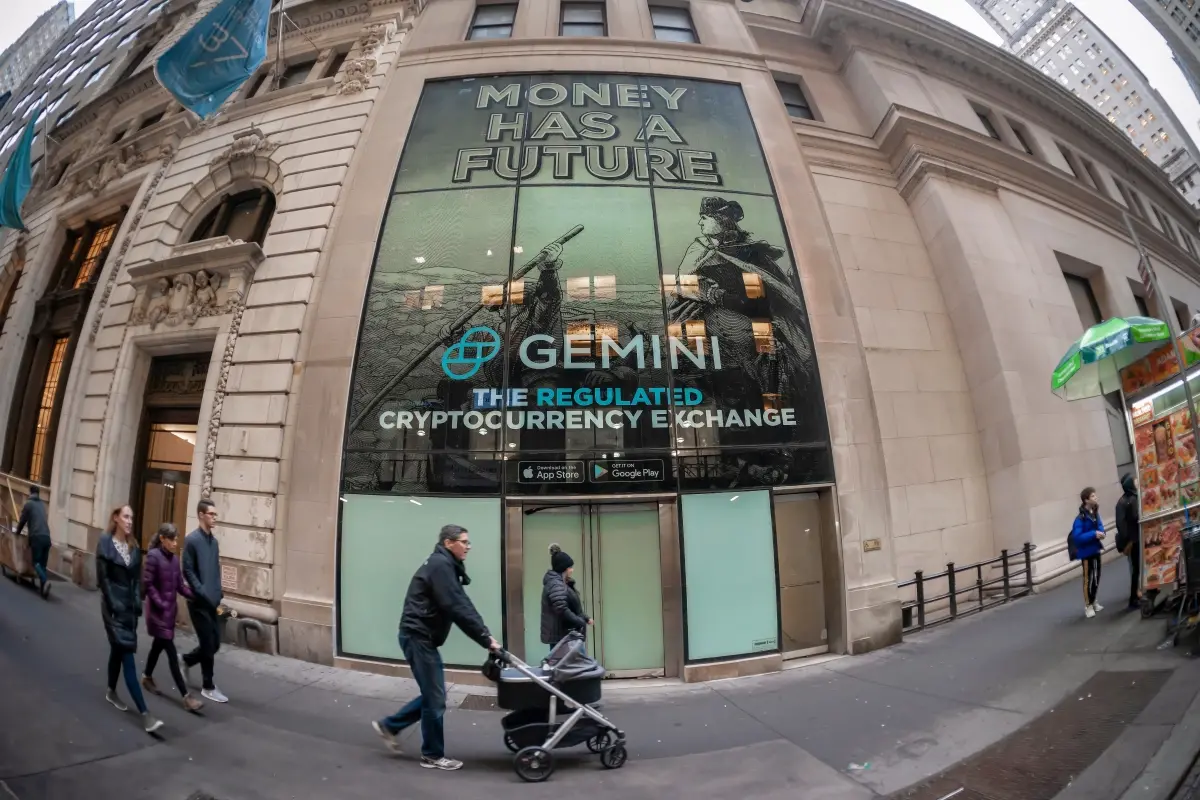
The End of Crypto Premium? Observing the Market Logic Shift from the Dilemma After Gemini's Listing
18 小时前
Understanding the Key Issues of Tokenization in One Article
1 天前

Related reading