


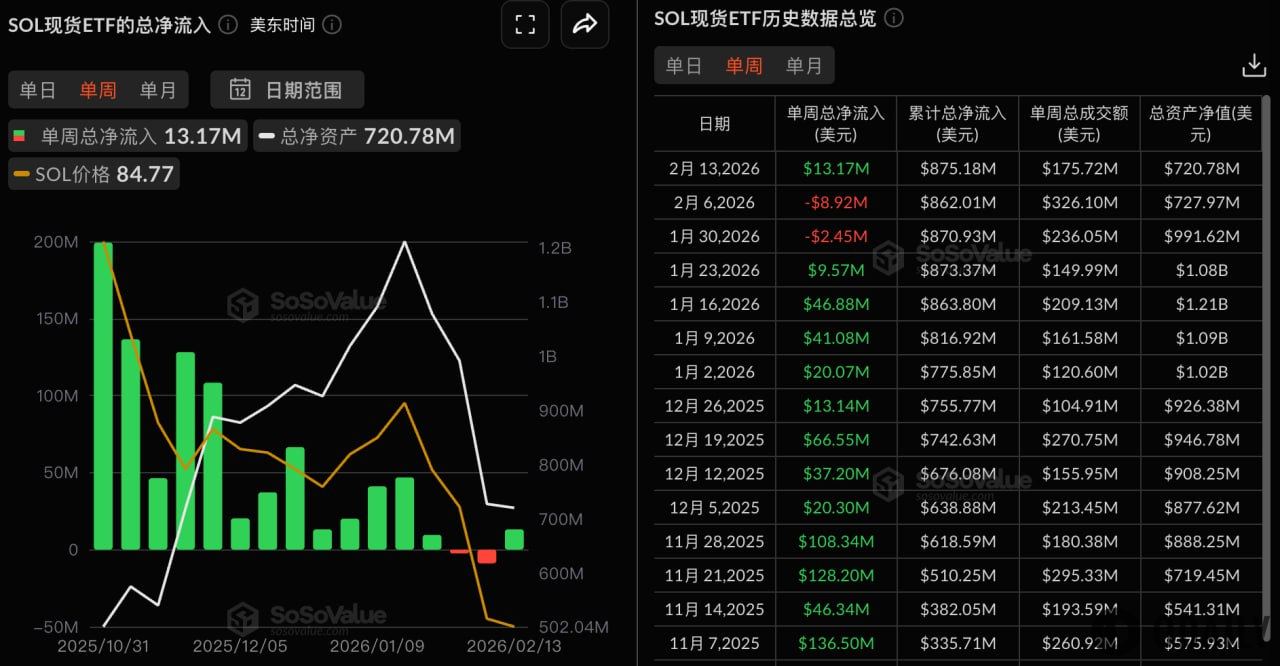
Data: SOL spot ETF net inflow this week is $13.1706 million
According to SoSoValue data, this week's trading day saw a net inflow of $13.1706 million for SOL spot ETFs.
The SOL spot ETF with the highest net inflow this week is the Bitwise ETF BSOL, with a weekly net inflow of $12.7196 million, bringing the historical total net inflow for BSOL to $683 million. Following that is the Fidelity ETF FSOL, with a weekly net inflow of $7.32 million, and the historical total net inflow for FSOL currently stands at $159 million. The SOL spot ETF with the highest net outflow this week is the VanEck ETF VSOL, with a weekly net outflow of $5.541 million, while the historical total net inflow for VSOL is $20.21 million. As of the time of writing, the total net asset value of SOL spot ETFs is $721 million, with an ETF net asset ratio of 1.5%, and the historical cumulative net inflow has reached $875 million.

 Risk warning Risk warning


