Bitwise Staking Report: Income from the six major public chains has generally declined, what supports the value of tokens?
 Core Viewpoint
 Ethereum processes 70% more transactions per second than a year ago, but network revenue has decreased by 51% year-on-year. Currently, 2.84% of the annualized staking yield comes from protocol inflation, with users' actual paid transaction fees contributing only 0.19 percentage points. This article breaks down the staking yields, network revenues, and on-chain activities of six chains: Ethereum, Solana, Hyperliquid, Avalanche, NEAR, and Tempo, pointing to the same question: As block space becomes cheaper and transaction fee revenue continues to decline, how do public chains and their tokens achieve value capture?
Author: Bitwise "Staking Report Q3 2026"
Compiled by: Jiahua, ChainCatcher
In the second quarter of 2026, market sentiment and network fundamentals moved in two directions. In the networks covered in this article, block space became cheaper, on-chain activity increased, and fee income decreased.
The decline in income was mainly caused by protocol design, as various chains actively made block space more abundant and cheaper. Some networks did experience weakening demand, but that was not the general case.
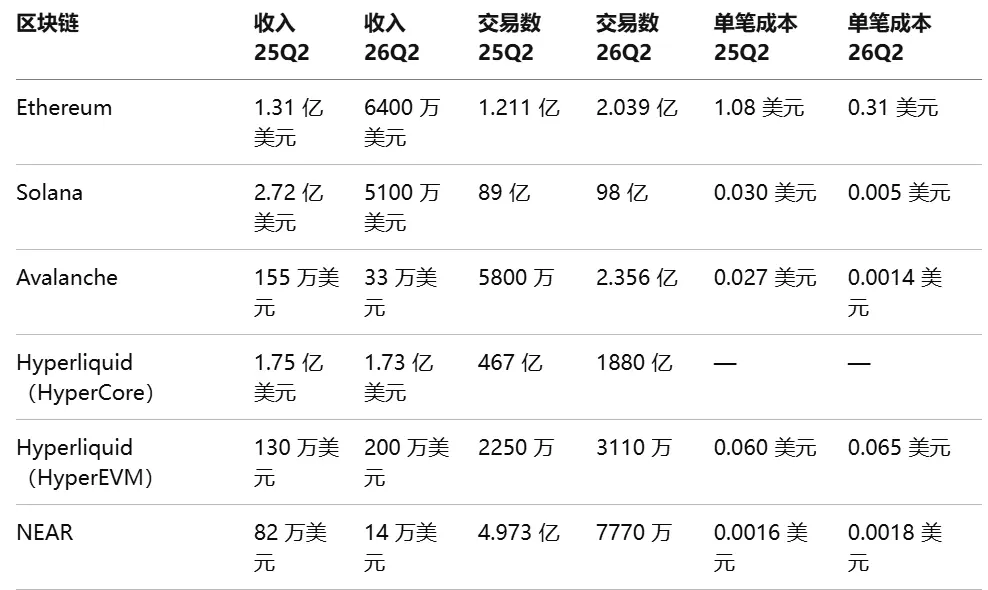
The divergence between income and activity was the main theme of this quarter. Fees are falling while usage is rising.
After increasing the gas limit, Ethereum processed 26 transactions per second, up from 15 a year ago. Solana processed about 10 billion non-voting transactions, higher than any quarter in 2025. Avalanche's C chain processed 236 million transactions, compared to 58 million a year ago. The decrease in block space costs does not indicate weakened demand.
Institutional adoption became quantifiable for the first time this quarter. In terms of staking, Ethereum's active staking reached a historic high of 40.2 million ETH, accounting for 33% of the supply, while Coinbase and Circle each staked 500,000 HYPE under Hyperliquid's AQAv2 framework.
In terms of tokenized real assets, the trading volume of tokenized stocks on Solana increased 2,479 times year-on-year, rising from $1.34 million in June 2025 to $3.32 billion a year later, driven by the launch of SpaceX and Micron on Backpack Securities. S&P Dow Jones Indices authorized the S&P 500 for products on Hyperliquid, and FIFA's World Cup ticketing system runs on a dedicated Avalanche L1.
In payments, Deel distributed approximately $30 million to 7,200 contractors in its first full quarter on Tempo.
Ethereum
Staking Rewards and Validator Economics
Ethereum's staking rewards consist of two parts. Consensus rewards are new ETH issued by the protocol to validators and stakers, which is pure issuance and will slowly increase the total supply. Execution rewards come from user-paid priority fees and MEV, reflecting the true demand for block space.
The revenue structure is primarily based on issuance. In Q2 2026, of the total yield of 2.84%, 2.65 percentage points came from consensus rewards, and 0.19 percentage points came from execution rewards, with a ratio of approximately 93% to 7%.
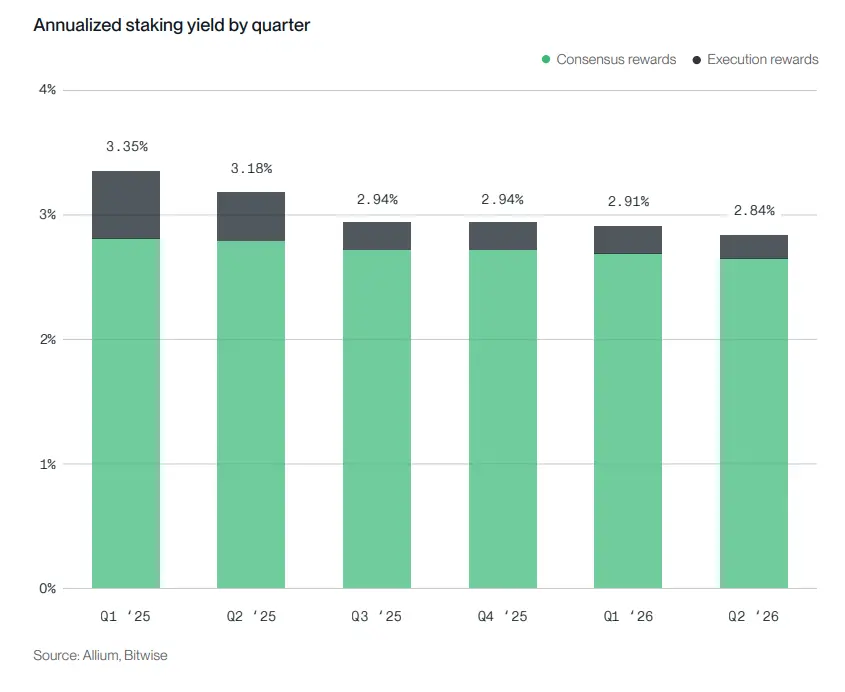
Figure Caption: Annualized staking yield: 25Q1 3.35%, 25Q2 3.18%, 25Q3 2.94%, 25Q4 2.94%, 26Q1 2.91%, 26Q2 2.84%
Network Revenue
Ethereum's network revenue comes from four fee streams. Two of these are burned: base fees (the block space fee priced by EIP-1559, paid for each transaction) and blob fees (paid when L2 sends transaction data back to the mainnet for data availability).
The other two go to validators and stakers: priority fees (tips users pay to accelerate transactions) and MEV (the additional value captured by validators from transaction ordering, after deducting the share for block builders).
In Q2 2026, the entire chain collected approximately 31,166 ETH, of which 74% went to validators and stakers, and 26% was burned. Converted at the quarterly average price, this amounts to about $64 million, down from $131 million in Q2 2025, a year-on-year decline of 51%. After the upgrades of Pectra and Fusaka made blob space abundant, blob fees have approached zero.
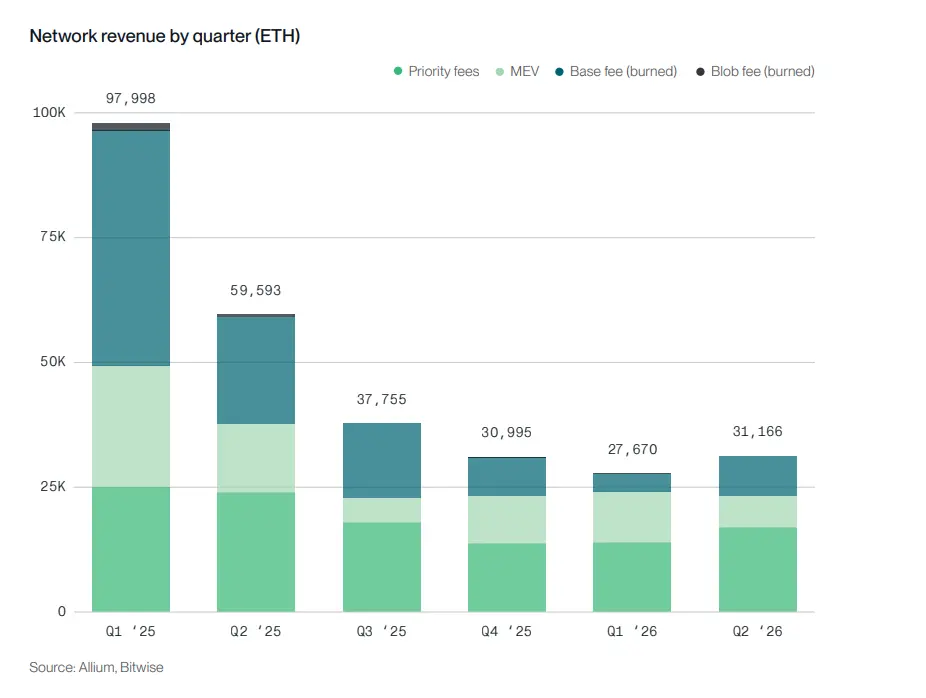
Figure Caption: Quarterly network revenue in ETH: 25Q1 97,998, 25Q2 59,593, 25Q3 37,755, 25Q4 30,995, 26Q1 27,670, 26Q2 31,166
In terms of ETH, revenue rebounded from 26Q1's 27,670 ETH to 31,166 ETH in 26Q2, marking the first quarter-on-quarter increase in over a year. The decline in dollar figures was solely due to the drop in ETH prices during this quarter.
Active Staking and Capital Flow
Active staking steadily rose from 34.2 million ETH at the end of 25Q1 to 40.2 million ETH at the end of 26Q2, reaching a historic high and accounting for 33% of the total supply.
Inflows were concentrated in the first half of 2026. In Q1, an additional 2.81 million ETH was added, the largest single-quarter increase during this period, followed by another 1.73 million ETH in Q2. The more ETH staked, the slower and lower the consensus yield declines.
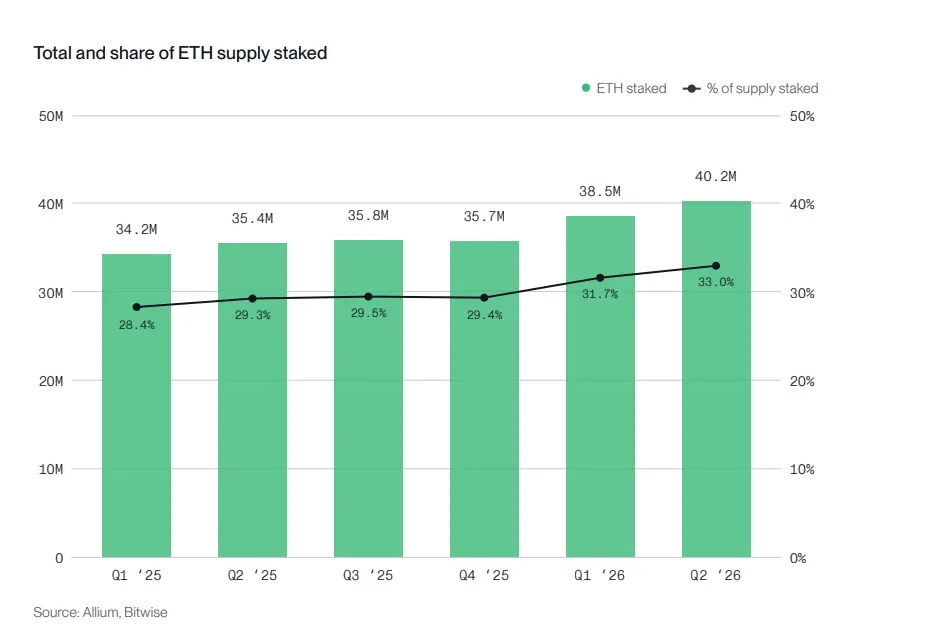
Figure Caption: Total staked amount and proportion of supply: 25Q1 34.2 million (28.4%), 25Q2 35.4 million (29.3%), 25Q3 35.7 million (29.5%), 25Q4 35.8 million (29.4%), 26Q1 38.5 million (31.7%), 26Q2 40.2 million (33.0%)
These inflows came from institutions. Bitmine Immersion held 5.62 million ETH as of June 14, 2026, of which 4.72 million ETH had been staked. BlackRock's iShares Staked Ethereum Trust ETF (ticker ETHB) was listed on Nasdaq on March 12, 2026, with 70% to 95% of its staked holdings, distributing rewards to investors monthly.
Block Capacity and Usage
The mainnet's throughput nearly doubled within a year, increasing from 15 transactions per second to 26, as the block gas limit was raised from 30 million to 60 million. This increase was phased in by validators in 2025: from 36 million in February, to 45 million in July, and to 60 million by the end of November.
The gas limit is the computational budget available for each block; raising it allows more transactions to fit in each block, thus increasing throughput without making blocks more congested.
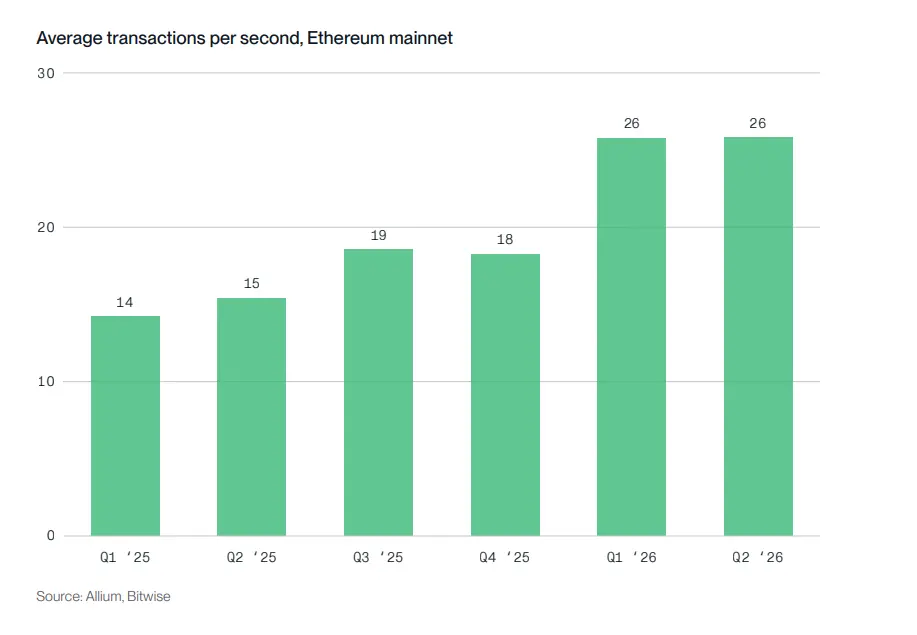
Figure Caption: Average TPS on the mainnet: 25Q1 14, 25Q2 15, 25Q3 19, 25Q4 18, 26Q1 and 26Q2 both 26
The block fill rate has long been maintained at around half, which is by design. EIP-1559 sets the target fill rate at 50% and automatically adjusts the base fee to maintain this level. If a block exceeds half full, the base fee for the next block can be raised by up to 12.5%; if it remains overfilled, the fee continues to rise until usage falls back. The reverse is also true.
The reason for targeting half full rather than fully full is to leave room for demand peaks. When activity surges, blocks can expand to the limit, while rising fees gradually push out lower-priority transactions.
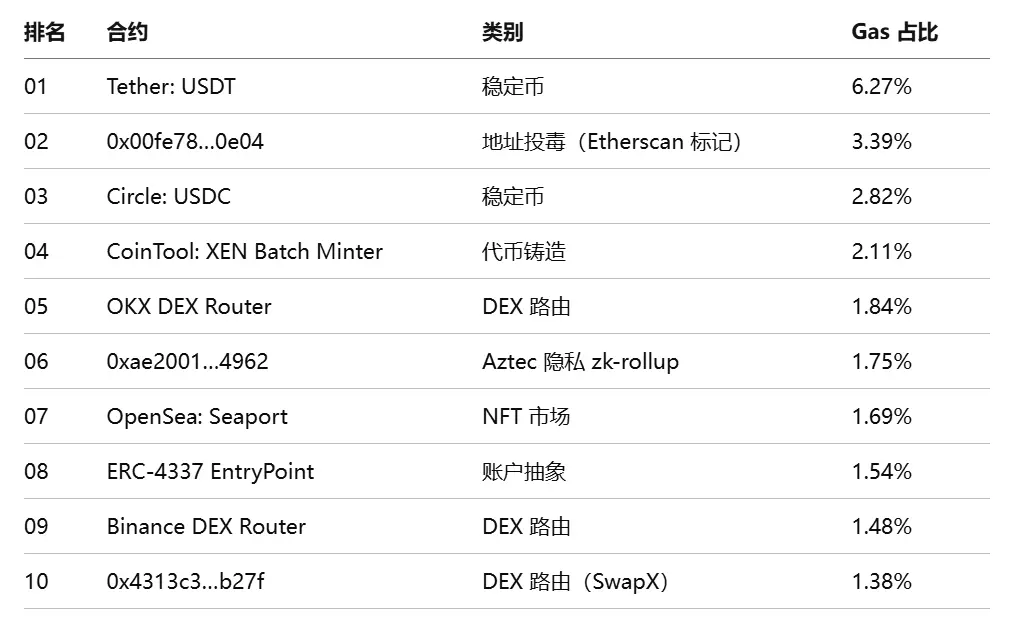
Ranking contracts by gas consumption in Q2 26, the largest single consumer was Tether (USDT), accounting for 6.27% of all mainnet gas, with the top ten contracts collectively accounting for nearly a quarter. The heaviest single use case was regular stablecoin transfers, with USDT and USDC together consuming about 9% of the gas.
Two noteworthy results emerged. The second-largest consumer, accounting for 3.39%, is a contract marked by Etherscan as address poisoning, which sends small fake transfers to numerous wallets, waiting for users to mistakenly copy the scammer's address. Aztec's privacy rollup consumed 1.75% of the gas for verifying zero-knowledge proofs on L1, while ERC-4337 EntryPoint accounted for 1.54%. Named MEV bots are present, but none exceed 1.5% in scale.
Roadmap
Two upgrades shaped the current situation. Pectra (May 2025) introduced smart account functionality (EIP-7702) for regular wallets and raised the maximum balance for validators from 32 ETH to 2048 ETH (EIP-7251), allowing operators to merge stakes and run the same amount with fewer validators.
Fusaka (December 2025) introduced PeerDAS, allowing nodes to sample rollup blob data without needing to download and store everything. This expanded blob capacity, and the cost of L2 sending data to Ethereum is expected to decrease.
Next are two hard forks. Glamsterdam aims for the second half of 2026, with a specific date yet to be determined, focusing on two main tasks: incorporating block building into the protocol's ePBS and eliminating the reliance on trusted relays that has existed since the merge; and implementing block-level access lists to inform the network in advance which states a transaction will touch, thereby supporting parallel execution. This upgrade is also expected to further increase the gas limit, with long-term discussions reaching up to 200 million.
The second hard fork is Hegota, planned for the end of 2026, introducing FOCIL (EIP-7805), a change to the consensus layer aimed at anti-censorship. In each slot, a committee of 16 validators lists the valid transactions they see in the mempool, and block builders must include these transactions; validators only vote for blocks if builders comply. This decentralizes the inclusion rights of transactions among many participants, making it structurally difficult for a single party to exclude a transaction.
Finally, regarding block time, a block is normally produced every 12 seconds, with final confirmation taking 12 to 15 minutes. EIP-7782 proposes to cut block time in half to 6 seconds by compressing three sub-tasks within each slot: block proposal from 4 seconds to 3 seconds, proof from 4 seconds to 1.5 seconds, and aggregation from 4 seconds to 1.5 seconds. This proposal is currently not attached to any scheduled fork; it was considered for Glamsterdam but was not selected.
Solana
Staking Reward Composition
Solana's staking rewards remain among the highest in mainstream public chains. Validator income has three sources: protocol inflation, block rewards, and MEV tips. In the first half of 2026, all three were declining, with inflation decreasing according to Solana's reduction schedule, while block rewards and tip income weakened due to reduced network activity.
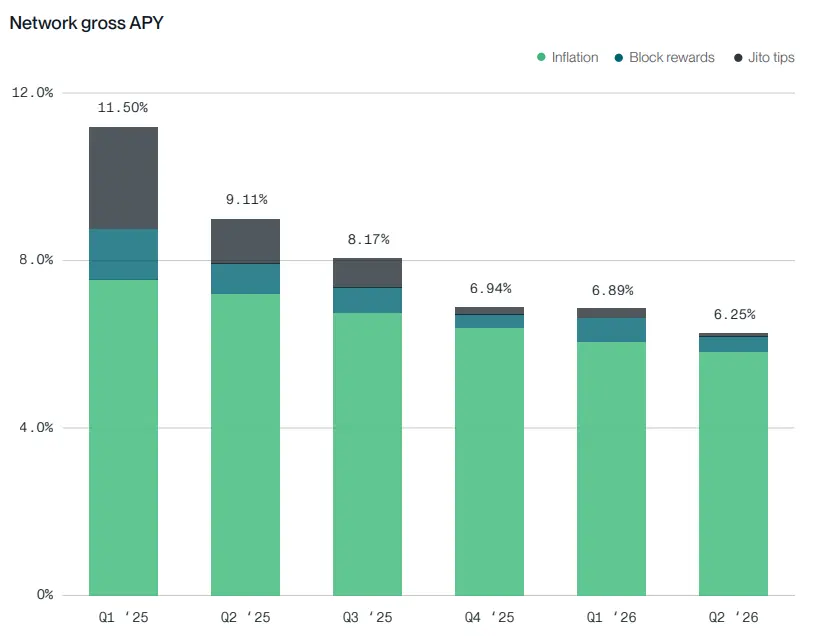
Figure Caption: Network comprehensive annualized yield: 25Q1 11.50%, 25Q2 9.11%, 25Q3 8.17%, 25Q4 6.94%, 26Q1 6.89%, 26Q2 6.25%
Inflation rewards decreased from 6.1% to 5.8% in the first half of the year, still being the main source of income, accounting for over 90% of annualized staking returns. Block rewards and Jito tips contributed a total of 0.44% in Q2 26, down from 0.79% in the previous quarter.
A notable change from 2025 into 2026 is the reversal of the internal structure of non-inflation rewards. In 25Q1, during the trading boom, Jito MEV tips accounted for about 70% of non-inflation income. By the first half of 2026, block rewards became the main source, accounting for about 75%.
Two factors contributed to this. First, reduced trading activity led to fewer arbitrage opportunities, decreasing the demand for competing for transaction ordering through Jito bundles. Second, new block-building clients like Jito's BAM and Harmonic have been increasingly adopted, with Harmonic using its own priority fee-based packaging scheme, thus cutting into the revenue share flowing through the traditional Jito ecosystem.
These trends accelerated after the market crash in October 2025 and were amplified by competition from new trading platforms like Hyperliquid.
REV and On-Chain Activity
Solana's Real Economic Value (REV, the total amount users pay to use this chain) has continued to decline during this period, dropping from a peak of $812 million in 25Q1 to $89 million a year later, further decreasing to $51 million in Q2 26.
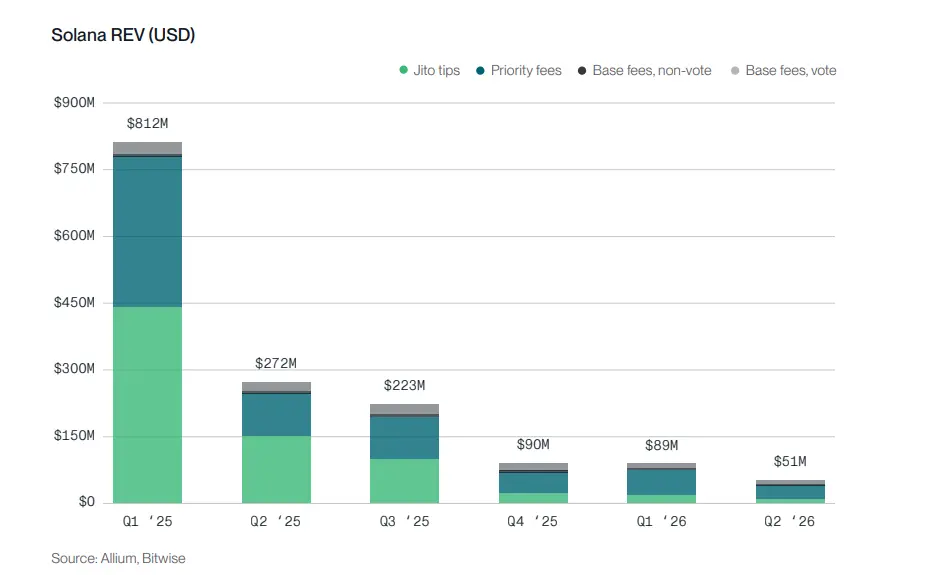
Figure Caption: REV in USD: 25Q1 $812 million, 25Q2 $272 million, 25Q3 $223 million, 25Q4 $90 million, 26Q1 $89 million, 26Q2 $51 million
In terms of SOL, the decline is not as severe as shown in the dollar figures. In 25Q1, REV generated approximately 3.9 million SOL, while in 26Q1 it was 877,000 SOL, and in 26Q2 it was 631,000 SOL. Compared to the activity peak in early 2025, this is still a significant drop, but much milder than in dollar terms, as SOL prices fell by 62% during this period. A positive momentum was observed in 26Q1, indicating that demand has rebounded from the low point at the end of 2025, but it has not fully recovered.
Activity itself has shown resilience. In 26Q1, 10.1 billion non-voting transactions were processed, an 18% year-on-year increase, while in 26Q2, 9.8 billion transactions were processed, remaining flat compared to the same period last year.
So the question arises: why is REV declining when transaction volume is not weak?
Transactions on Solana consume computational resources, measured in Compute Units (CUs). Each block has a fixed CU capacity. This capacity was increased from 48 million CU to 60 million CU in two updates in April and July 2025, and is expected to reach 100 million CU in 2026.
The average CU utilization for non-voting transactions dropped from 55.5% in 26Q1 to 47.5% in 26Q2. With reduced competition, the demand for priority fees and Jito tips has also decreased, leading to a 31% quarter-on-quarter drop in average rewards per block, from 0.041 SOL in 26Q1 to 0.0287 SOL in 26Q2.
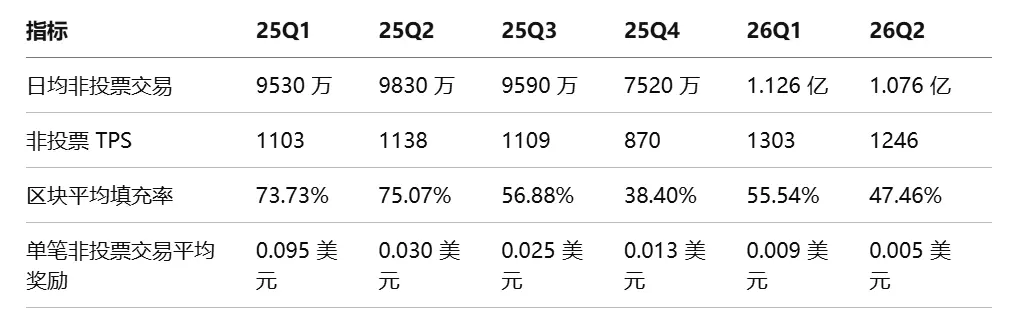
The conclusion is straightforward: the decline in Solana's income is due to the decreased congestion. Block space is no longer scarce, and users have little reason to bid aggressively for packaging, leading to a drop in REV.
Regarding slot time, Solana's target is about 400 milliseconds, with actual durations fluctuating based on validator behavior. Different schedulers have different trade-offs; some may slightly extend slots to capture more transactions and increase block revenue. After peaking in January 2025, slot times have been declining, reaching about 385 milliseconds in Q4 25 and returning to nearly 400 milliseconds in Q2 26. A reasonable explanation is that validators have economic incentives to extend slots to build higher-value blocks, at the cost of slowing down the network.
Staking Structure and Validators
Solana's staking rate is among the highest in public chains, with approximately 427 million SOL staked, accounting for 68% of the total supply of 628 million. This ratio has remained remarkably stable over the past two years, supported by relatively high staking rewards.
Of the staked SOL, about 57 million (13.3%) is delegated through liquid staking tokens (LSTs), with the Solana Foundation Delegation Program (SFDP) accounting for 20 million (4.7%), while the remaining 350 million is directly staked by market participants. SFDP was originally intended to distribute staking among smaller validators to support decentralization, but the foundation has increasingly only supported validators that genuinely contribute to the ecosystem, with the program's share of total staking dropping from about 10% to less than 5% within a year.
The total amount of liquid staking has increased from 40 million SOL in January 2025 to a peak of 66 million a year later, before falling back to 56.5 million in June 2026.
JitoSOL saw the steepest decline, dropping from a peak of 18.5 million SOL in June 2025 to 9.94 million a year later. Marinade followed a similar trend, falling from 5.5 million to 2.4 million. Binance emerged as a clear winner, growing from 6.5 million at the beginning of 2025 to 10.1 million. DoubleZero reached 13 million between November 2025 and February 2026 but has since fallen back to 5.2 million.
The key point is that the growth of liquid staking is no longer dominated by old players; JitoSOL and Marinade have lost market share, while BNSOL, dzSOL, dSOL, and a number of smaller LSTs have captured most of the incremental growth.
The number of active validators has decreased from about 1,250 in June 2025 to about 830 a year later, a 34% reduction over 12 months. The reason is that light voting costs about 1 SOL per day, which, at recent prices, annualizes to about $25,000, not including hardware and infrastructure expenses. Validators with insufficient delegation are increasingly finding it difficult to be profitable, and with the gradual contraction of SFDP staking, smaller operators are accelerating their exit.
Application Layer Revenue
Solana's application layer generated $227 million in revenue in Q2 26, down 31% from $328 million in Q1 26. This decline can largely be attributed to the SOL price, which fell similarly during the same period.
Transactions remain Solana's dominant use case, with seven of the top ten applications related to trading. Pump continues to lead by a wide margin, generating $90.1 million in Q2 26, about three times that of the second-place Collector Crypt ($32.2 million), together accounting for more than half of the total revenue of the top ten.
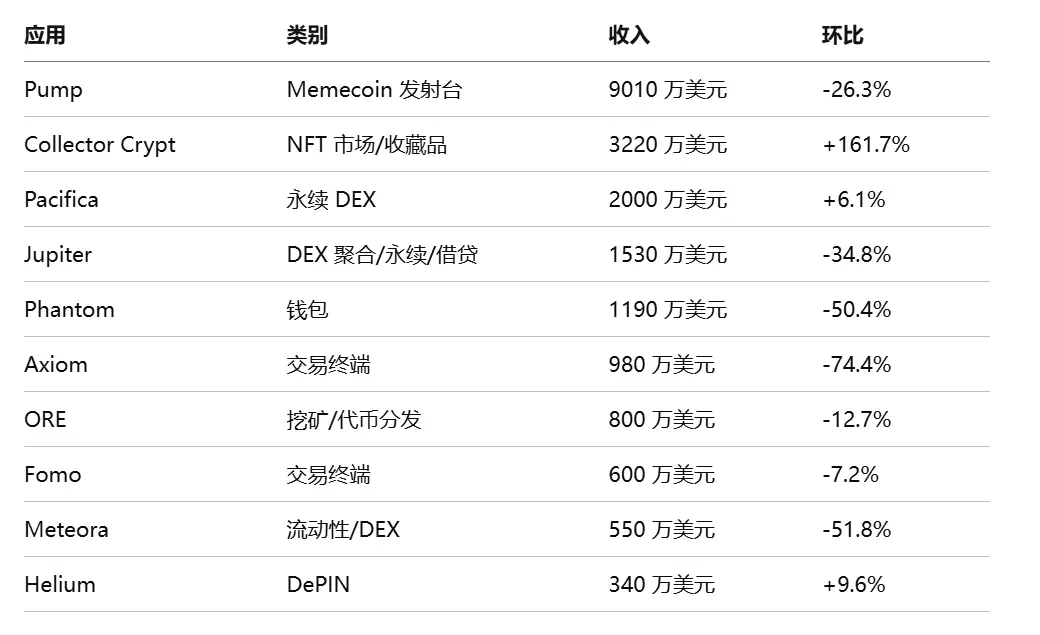
Collector Crypt is a collectibles platform focused on tokenized real assets, featuring cards similar to Pokémon. It gained traction after launching a gacha mechanic, where random card packs contain tokenized collectibles that users can hold, trade, or redeem for physical delivery. It is the fastest-growing among the top ten.
Pacifica is a newer entrant, generating $20 million in Q2 26, slightly above $18.9 million in Q1 26. It is a hybrid perpetual exchange, with its matching engine running off-chain for low-latency execution, while custody and settlement are on-chain.
The list misses a growing category of proprietary automated market makers (propAMMs). Unlike traditional AMMs, propAMMs typically do not charge explicit fees but earn through the bid-ask spread like traditional financial market makers, making profitability difficult to quantify. Given their increasing importance in liquid markets, the actual revenue of Solana's trading ecosystem should be higher than what the list indicates.
Tokenized Stocks
On June 12, the largest IPO in stock market history occurred. SpaceX went public with a valuation of $1.77 trillion, attracting significant attention from both institutions and retail investors, and Solana was well-prepared.
In 2025, trading volume for tokenized assets was primarily driven by credit. In 2026, stock trading volume rose from $226 million in January to $871 million in May, and then skyrocketed to $3.3 billion in June due to SpaceX's IPO.
On Solana, tokenized SpaceX stock $SPCX can be purchased through three channels: Backpack, xStocks, and PreStocks. Since the IPO, these three have collectively traded $600 million, with 85% coming from Backpack.
Memory chip manufacturer Micron ($MU) began trading on Solana in early May but only saw significant trading volume after launching on Backpack Securities on June 22. By the end of June, the stock had a total quarterly trading volume of $107.9 million, with $106.7 million occurring on Backpack.
Backpack dominates the tokenized stock space, likely because it allows users to redeem tokenized stocks on Solana for underlying assets through its exchange, Backpack Securities.
Block Building: BAM and Harmonic
The competition for block building began in the second half of 2025, with Jito's BAM launching in September and Harmonic in November, each having different visions for Solana's future.
Traditionally, validators are responsible for both proposing blocks and deciding the trade-offs and ordering of transactions. As MEV value has risen, concerns about centralization and market fairness have emerged. The new block building systems separate transaction ordering from block proposals. BAM emphasizes transaction privacy and predictable execution, while Harmonic emphasizes competition among builders.
Both systems saw substantial adoption shortly after launch. Validators running BAM correspond to about 140.8 million staked SOL (33.0% of total staking), while Harmonic validators correspond to 99.4 million (23.3%), together accounting for about 56%, meaning that most blocks on Solana are now produced by these two systems. As of the end of June 2026, both ecosystems remain closed, with block building infrastructure operated privately by their respective teams.
BAM's architecture is built around a Trusted Execution Environment (TEE). TEE allows participants to verify that a node is indeed executing approved code without being altered to the extent that it harms transaction privacy or changes execution results, thus providing a more trustworthy environment for market participants submitting order flows.
In addition to privacy, BAM also brings a standardized building environment. Today, Solana's market makers face a fragmented ecosystem, with validators running different clients like Agave, Frankendancer, BAM, Harmonic, etc., and often using different scheduling implementations within the same client. The scheduler determines how transactions are ordered within a block, resulting in inconsistent transaction landing behavior among different validators, forcing market makers to adjust strategies for different execution environments. BAM addresses this issue by deploying a single scheduler across all BAM nodes.
BAM also connects to many of the fastest validators on the network. In the median slot time distribution from epochs 971 to 980, BAM validators cluster tightly in the lower range, while non-BAM validators drag a long slow tail. BAM validators dominate in the 350 to 360 milliseconds range, with almost no presence in the slowest segment.
Harmonic's vision is closer to Ethereum's architecture, where independent builders compete to construct the highest-value blocks. To support this model, it offers several strategies aimed at different goals: first-come-first-served (FCFS) for low-latency execution, MREV for maximizing validator income, 50-millisecond frequent batch auctions for reordering transactions within short auction windows, and customizable batch timing, ordering rules, and bundle processing methods.
Harmonic also focuses on reducing toxic MEV, with its validators' sandwich attack rates consistently among the lowest in the network.
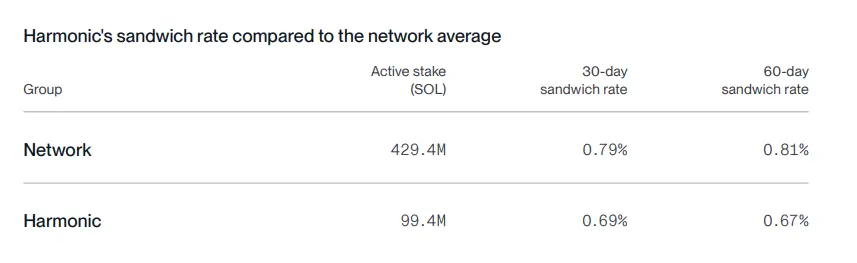
Figure Caption: As of June 15, 2026, the network's 30-day sandwich attack rate was 0.79%, and 60-day was 0.81%; Harmonic validators corresponding to 99.4 million staked SOL had rates of 0.69% for 30 days and 0.67% for 60 days.
Traditional finance relies on regulation and market oversight to limit predatory trading, while public chains can only address the same issues through protocol design and infrastructure.
Alpenglow and 200 Millisecond Slots
The most radical protocol upgrade currently in development is Alpenglow, a new consensus protocol intended to replace Tower BFT, planned for deployment in Q3 2026, representing the largest change to Solana's core architecture since the mainnet launch.
The main benefit is faster finality. Solana's block time is already among the fastest in the industry, but achieving finality still takes over ten seconds; Alpenglow aims to reduce this to a few hundred milliseconds.
To achieve this, Alpenglow introduces a two-round voting consensus mechanism, replacing historical proof (PoH) with validators' local clocks, and shifting from the current gossip message propagation to direct communication between validators. These changes significantly simplify the consensus layer and reduce communication overhead.
Alpenglow also eliminates on-chain voting. Once consensus messages move off-chain, voting transactions disappear, lowering validators' operational costs while freeing up block space for non-voting activities.
If finality time is shortened without synchronously shortening slot times, it would seem incomplete. Therefore, the target slot time is expected to be reduced from about 400 milliseconds to 200 milliseconds with SIMD-0525, which is anticipated to be deployed before Alpenglow goes live.
Halving the slot time means doubling the block production frequency and reducing latency, while shortening the leader window from 1.6 seconds to 800 milliseconds, leaving validators less time to delay block production in search of more profitable transactions. For traders and market makers, this means faster execution and more predictable landing; for validators, it increases operational pressure, as the number of voting transactions under the existing consensus model will roughly double before Alpenglow is fully implemented, leading to increased costs.
Inflation and Burn
SOL inflation has always been a controversial topic within the community. When Solana launched in 2020, it adopted an 8% inflation rate to incentivize validator participation and ecosystem growth, decreasing by 15% each year according to the current schedule, ultimately reaching a terminal value of 1.5% in 2031.
As the network matures, more participants believe the inflation rate has fulfilled its historical mission. Proponents of lowering inflation argue that the current 3.8% inflation rate makes staking relatively more attractive, thereby suppressing DeFi participation, while stakers sell rewards to cover taxes and operational expenses, creating continuous selling pressure.
For reference: when SOL first reached $250 in Q4 2021, its market cap was about $75 billion; when it returned to the same price in Q3 2025, its market cap had increased by 80% to $135 billion.
The first large-scale attempt was SIMD-0228 proposed by Multicoin in early 2025, which sought to replace the fixed reduction schedule with a market-driven mechanism linked to staking participation rates. This proposal sparked one of the largest governance debates in Solana's history but ultimately failed to secure the required absolute majority.
Subsequent discussions shifted to more targeted proposals. Helius proposed SIMD-0550, raising the reduction rate from 15% to 30%, maintaining the issuance model, but allowing the network to reach a terminal inflation rate of 1.5% in 2028 instead of 2031, cumulatively issuing nearly 19 million fewer SOL.
Temporal proposed SIMD-0547 from another angle: instead of reducing issuance, it aimed to increase burns. Currently, users can reserve a large amount of computational resources without paying for the portion that is not actually consumed. Under this proposal, transactions will pay a small fee based on the requested resources, regardless of actual consumption, with all revenue burned.
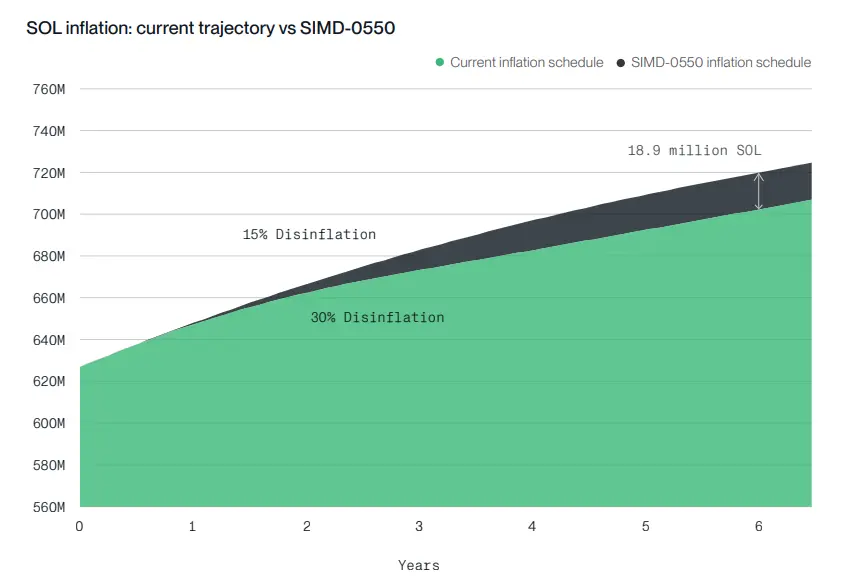
Figure Caption: Estimated daily burn under SIMD-0547: 0.1 lamport approximately 2,851 SOL (4.3% of issuance), 0.25 lamport approximately 7,128 SOL (10.7%), 1.0 lamport approximately 28,512 SOL (42.9%)
Based on the suggested starting parameters of 0.25 lamport per compute unit, this mechanism would burn approximately 7,128 SOL daily, equivalent to about 11% of the current daily issuance. While not enough to offset inflation, it would significantly increase the burn rate of SOL.
Hyperliquid
Value Capture Mechanism
In Q2 26, Hyperliquid had seven revenue streams, all of which ultimately lead to HYPE exiting circulation, either through the assistance fund repurchase or direct destruction. The assistance fund is a system address built into the protocol, with no private key or owner; fees are automatically converted to HYPE and sent in, making them permanently unrecoverable. After a governance vote in December 2025, all HYPE held in the fund was officially recognized as burned and removed from circulating supply.
The seven revenue streams are:
Native perpetual trading fees from the listing market. Each perpetual trade is charged based on the quoted asset (USDC, USDT, USDe, etc.), which is the largest revenue stream, with fee flows going into the assistance fund for buying and destroying HYPE.
HIP-3 perpetual fees (net). Any team staking 500,000 HYPE can deploy a perpetual market, with underlying assets being either crypto or real assets like commodities, stocks, or indices. Trading fees in HIP-3 markets are distributed between Hyperliquid and the deploying party, defaulting to twice the standard rate and split 50-50, with the deploying party able to take less but never more than half. This line is currently significantly reduced, as most HIP-3 markets are in "growth mode," cutting total fees (including both parties' shares) by about 90% to help new markets attract liquidity.
Spot trading fees. Portions charged in USDC go into the assistance fund for repurchase, while those charged in HYPE are directly destroyed.
HyperEVM gas fees, which are paid by users trading on HyperEVM, with both base fees and priority tips being destroyed.
Token listing and deployment auctions. To list a new spot token or deploy a new HIP-3 market, teams must win a Dutch auction, with the winning amount paid in HYPE and destroyed.
Order priority fees. Traders can pay to prioritize their orders in the execution queue, paying in HYPE and directly destroying it. This line is zero until 2026.
Gossip priority fees. Participants bid in a circular auction to obtain market data faster than standard data sources, also paying in HYPE and destroying it, which is also zero until 2026.
Revenue Composition
Fees flowing to repurchase increased from $22 million in 25Q1 to a peak of $332 million in 25Q3, then fell back to $186 million in 26Q1 and $175 million in 26Q2. Native perpetual fees accounted for 83% of total revenue in Q2 26, with the remaining 17% spread across HIP-3 perpetual, spot, HyperEVM gas, priority fees, and auctions.
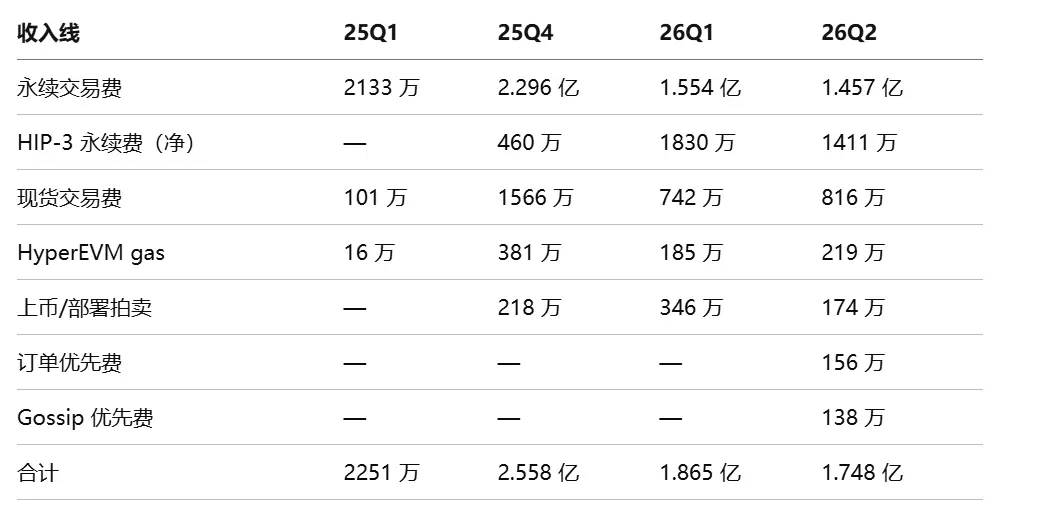
More notably, diversification is occurring. HIP-3 launched on October 13, 2025, with negligible fees in the first quarter, but by 2026 it had become a significant second revenue stream, generating $18 million in Q1 26 and $14 million in Q2 26, accounting for about 8% of total revenue. As core crypto perpetual fees declined, the growth in fees from non-crypto markets such as commodities, stocks, and indices partially offset the decline.
Two revenue streams have yet to be reflected in the Q2 26 figures. The HIP-4 outcome market has launched and is growing, with trading volume rising from $149 million in May 2026 to $287 million in June, but trading fees remain off during the testing phase. AQAv2 is a framework where stablecoin issuers participating share about 90% of their reserve income with the protocol, contributing to the assistance fund for repurchasing HYPE; this framework has been approved by validator governance and applies to USDC on the Coinbase and Circle sides, but as of Q2 26, the first payment has not yet begun.
Staking and Delegation
438 million HYPE is currently staked, accounting for 43.8% of the total supply. Staking is done through delegation, where holders assign HYPE to validators, who use it to participate in HyperBFT consensus and earn staking rewards. Rewards are automatically reinvested back into the staking balance daily, currently yielding an annualized 2.2%. This portion of revenue does not come from trading fees or protocol income but is paid by a dedicated emission reserve that issues HYPE.
The validator set remains concentrated but is becoming decentralized. Initially, there were only five foundation validators, gradually expanding to 16, 21, and 24, reaching 27 by the end of Q2 26. The five validators operated by the Hyper Foundation currently hold about 49% of all staked HYPE, down from over 60% in Q2 25.
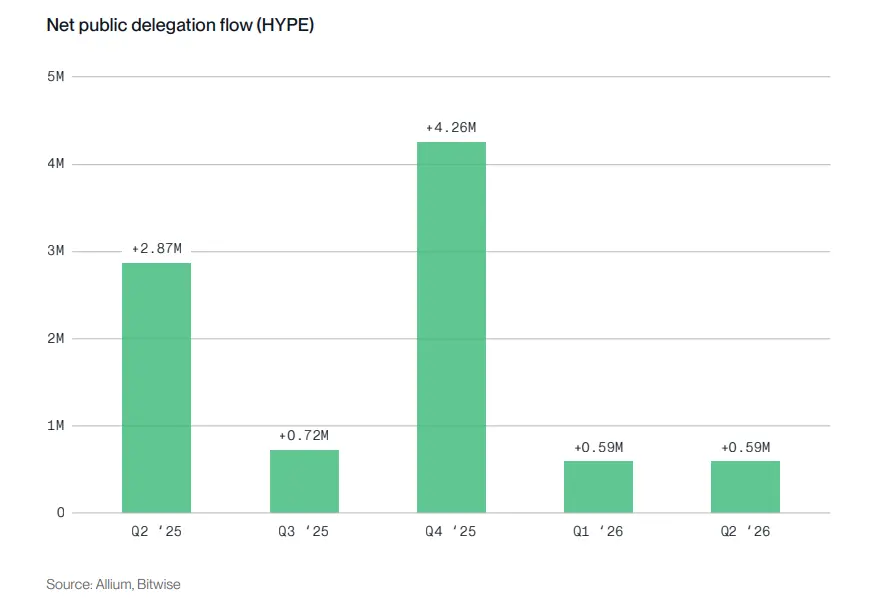
Figure Caption: Net inflow of delegation: 25Q2 +2.87 million, 25Q3 +0.72 million, 25Q4 +4.26 million, 26Q1 +0.59 million, 26Q2 +0.59 million
This quarter's inflows primarily came from institutions. Coinbase and Circle each staked 500,000 HYPE as a condition of the AQAv2 framework. Hyperliquid Strategies, a corporate treasury that converted its balance sheet to HYPE, is one of the largest holders outside the foundation. Bitwise launched BHYP on the NYSE on May 15, 2026, staking through its infrastructure division Bitwise Onchain Solutions; 21Shares launched THYP on Nasdaq on May 12, and Grayscale launched HYPG on June 3, both also staking on-chain.
HyperCore and HyperEVM
Hyperliquid has two execution environments, HyperCore and HyperEVM, running on the same chain and sharing the same set of validators. Both share a single state, allowing applications on HyperEVM to directly read prices and place orders under HyperCore without needing cross-chain bridges.
Two mechanisms support this. Read precompiles allow HyperEVM contracts to access real-time data from HyperCore, including oracle prices, positions, and balances. The CoreWriter system contract allows HyperEVM contracts to send actions back to HyperCore, including placing and canceling orders, transfers, and staking.
HyperCore is a native order book exchange, with block times under 100 milliseconds and an average throughput of about 24,000 transactions per second, with a theoretical limit of 200,000 transactions per second, recording billions of transactions and operations daily.
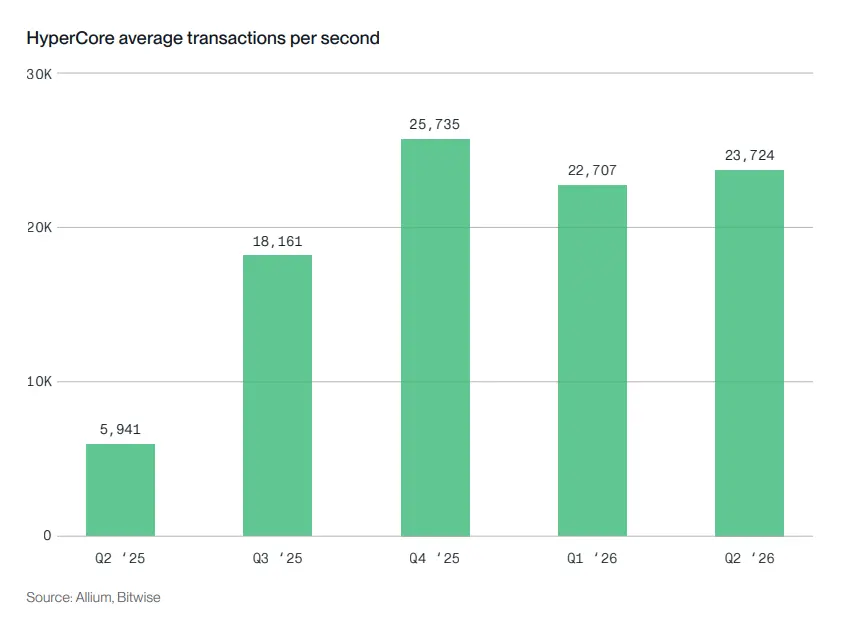
Figure Caption: Average TPS on HyperCore: 25Q2 5,941, 25Q3 18,161, 25Q4 25,735, 26Q1 22,707, 26Q2 23,724
HyperEVM is a general-purpose permissionless smart contract environment, secured by the same consensus as HyperCore. This chain processes about four transactions per second, with a block fill rate of about 20%. In terms of unique users, the most used are stablecoin transfers, primarily using the native Circle USDC, followed by a few decentralized exchanges and aggregators.
Perpetual Volume and Non-Crypto Assets
Hyperliquid's perpetual volume in Q2 26 was $652 billion, roughly flat compared to $633 billion in Q1 26, remaining among the highest in on-chain venues. More interestingly, the structural change is notable. By Q4 25, the first full quarter after HIP-3 launched, non-crypto markets accounted for 2% of total volume. By Q2 26, this portion reached $212 billion, accounting for 32%.
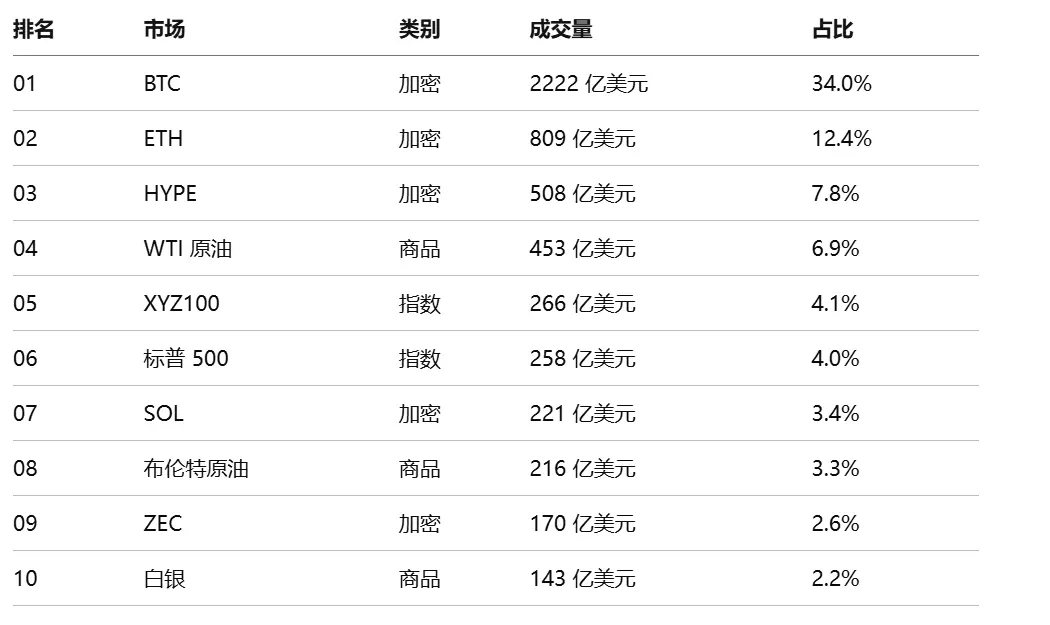
Trade.xyz is the leading team in the HIP-3 market, accounting for 95.1% of HIP-3 volume in Q2 26 ($202.6 billion). It was the first deployer under HIP-3, building products around non-crypto perpetuals, starting with US stocks and expanding to commodities and indices. On March 18, 2026, S&P Dow Jones Indices authorized the S&P 500 for Trade.xyz, making it the first and only officially authorized perpetual derivative based on that index on any decentralized platform. Qualified non-US investors can gain leveraged exposure to the S&P 500, available for trading 24/7, with index data provided by S&P Dow Jones. This represents a substantial difference from previous synthetic stock products in DeFi that relied on unofficial price sources.
Open interest is also worth noting. Open interest only grows when capital enters the market and stays, making it a better reflection of real market activity than trading volume. In Q2 26, the average open interest was $8.7 billion, up 32% from $6.6 billion in Q1 26, indicating that traders held positions longer in the second quarter.
Three deployers exited during the quarter. Felix was the first to announce on June 8, followed by Ventuals, which provided perpetual contracts for private companies like OpenAI and Anthropic, announcing market closure on June 15. A few days later, Dreamcash, supported by Tether and operating USDT-collateralized perpetuals, exited, citing that its model lost competitiveness after Hyperliquid natively integrated USDC.
On the front end, builder code shows which applications are sending order flows to exchanges. These fees are layered on top of Hyperliquid's own trading fees and belong to the applications rather than the protocol.
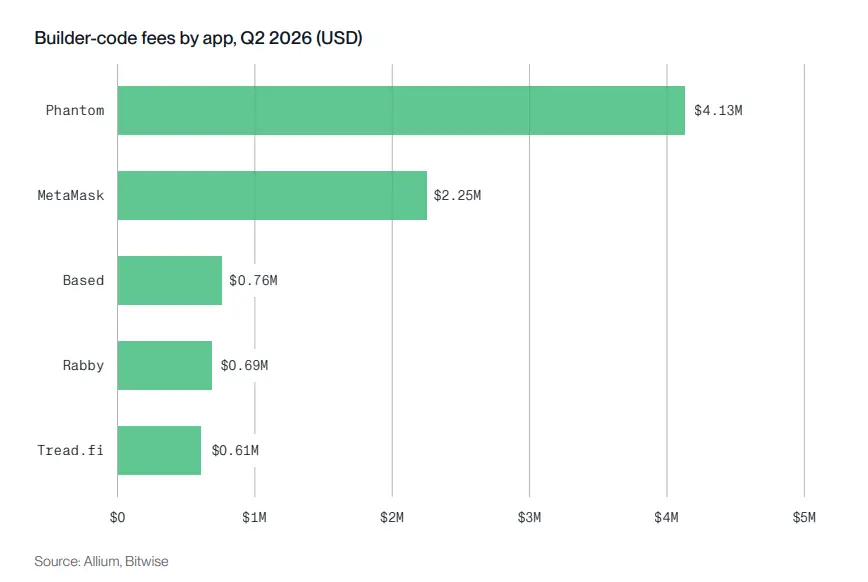
Figure Caption: Q2 26 builder code fees: Phantom $4.13 million, MetaMask $2.25 million, Based $760,000, Rabby $690,000, Tread.fi $610,000
General wallets have surpassed specialized trading terminals, indicating that Hyperliquid's user base is expanding beyond its initial scope.
Outlook
Hyperliquid's value capture primarily relies on trading fees, which fluctuate with trading volume, and trading volume itself is cyclical. Two changes are altering the composition of this revenue.
The first is the widening of trading targets. In the three quarters since HIP-3 launched, the non-crypto market has reached 32% of trading volume. HIP-4 further extends the model to outcome and prediction markets, with a cumulative nominal trading volume of about $436 million as of Q2 26, including about $149 million in the first 30 days, but trading fees remain off during the testing phase, temporarily not contributing to protocol revenue.
The second is AQAv2, a revenue stream distinct from trading fees. It directs about 90% of the reserve income from USDC on Hyperliquid to the assistance fund, with the first payment scheduled for October 3, 2026. The platform has about $5 to $6 billion in USDC, with Coinbase acting as the capital deployment party, expected to contribute $135 million to $160 million annually. This figure depends on short-term interest rates and whether USDC remains on the platform, but it does not fluctuate with the crypto market cycle.
Avalanche
Staking and Yield
By the end of Q2 26, Avalanche had 196 million AVAX staked across 591 validators, with a staking rate of 41.5%. The staking rewards for this chain are entirely provided by inflation, unrelated to transaction fees. The protocol issues new AVAX according to a fixed schedule, with a permanent cap of 720 million AVAX, while all transaction fees are burned, partially offsetting inflation.
The reward rate depends on two variables: the difference between the current supply and the 720 million cap, and the staking duration. The longer the lock-up, the higher the fee rate, with the maximum consumption rate for a full year commitment being 12%.
Reward Rate = (720 million - Current Supply) ÷ Current Supply × Consumption Rate
As of June 2026, the circulating supply was approximately 472 million AVAX, leading to: (720 million - 472 million) ÷ 472 million × 12% ≈ 6.3%.
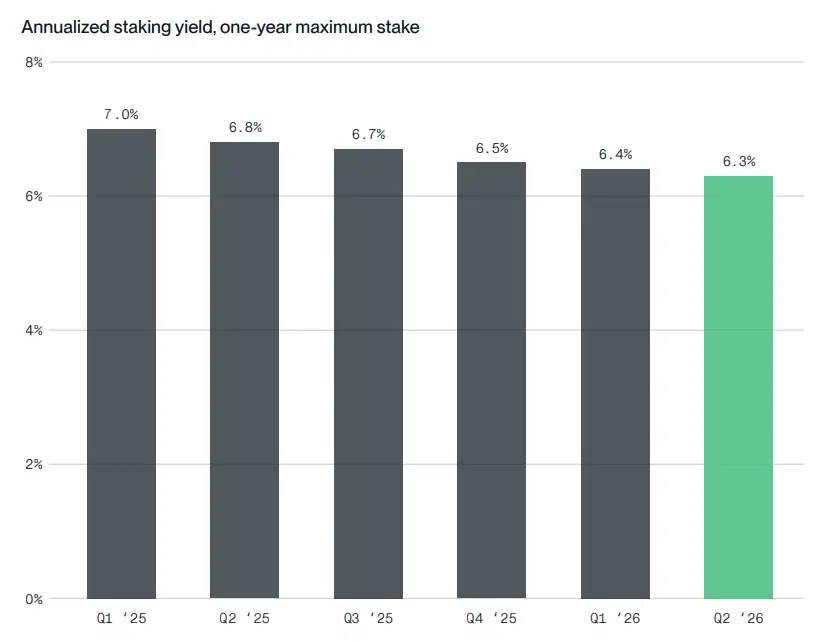
Figure Caption: Annualized yield for maximum staking over one year: 25Q1 7.0%, 25Q2 6.8%, 25Q3 6.7%, 25Q4 6.5%, 26Q1 6.4%, 26Q2 6.3%
On-Chain Activity and Network Revenue
Avalanche's network revenue encompasses all transaction fees from the C chain, P chain, and X chain, all of which are burned, with the C chain accounting for about 97%.
In addition to C chain fees, there is a second flow: L1 validator fees. Since Avalanche9000 removed the requirement to lock 2,000 AVAX to launch a sovereign L1, each L1 validator now pays about 1.33 AVAX per month to the P chain, which is burned. This flow is currently small, amounting to a few thousand AVAX per quarter, compared to tens of thousands from the C chain, but it grows with each new L1 launched. The contribution from the X chain can be ignored.
Over the past year, transaction costs have significantly decreased due to three upgrades. The most radical, Etna in December 2024, cut the minimum base fee on the C chain by 96%, from 25 nAVAX per unit of gas to 1 nAVAX. Octane in April 2025 improved the fee response to demand; previously, surges in activity would quickly push fees up and slowly bring them back down, but Octane smoothed this adjustment process, bringing fees closer to actual usage levels, with average transaction fees dropping by another 43%. Granite in November 2025 adjusted block production speed according to demand, making it faster during busy times and slower during idle times, without affecting sub-second finality.
Each upgrade has reduced the cost per transaction, leading to increased activity. C chain transactions rose from 58 million in Q2 25 to 236 million in Q2 26, nearly quadrupling in a year.
In terms of AVAX, network revenue increased from 58,000 AVAX in Q1 25 to a peak of 134,000 AVAX in Q4 25, then fell by about 70% in 2026, due to weakened demand and a smoother fee mechanism that reduced per-transaction fees. The decline in dollar terms was even greater, as the price of AVAX dropped from about $26 in Q3 25 to about $8 in Q2 26.
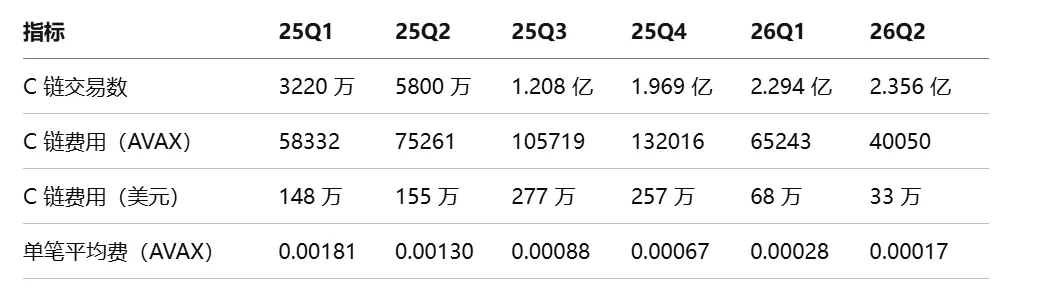
Overall, the decline in network revenue is not due to fewer users, but primarily because the cost of unit block space has decreased.
L1 Ecosystem
Currently, 33 sovereign L1 networks are operating on the Avalanche mainnet. L1s on Avalanche are application-specific chains with their own sets of validators, offering benefits such as: validator sets can be permissionless or permissioned; fees can be paid in the project's own tokens rather than AVAX; validators can be required to undergo identity verification, operate in specific jurisdictions, or hold licenses; each network has dedicated block space, avoiding competition for throughput with other chains while maintaining connectivity through cross-chain messaging.
AvaCloud is Ava Labs' managed deployment platform, allowing teams to configure without having to build and maintain validator infrastructure, RPC nodes, indexers, and block explorers through a web console.
FIFA has partnered with Modex to build a dedicated Avalanche L1 for the 2026 World Cup, bringing the secondary ticket market into its ecosystem, eliminating the need for third-party resale platforms like StubHub.
Fans first receive a "purchase right" token, which allows them to prioritize purchasing tickets for designated matches before the public sale. This token can be traded on FIFA's own market, with both buyers and sellers paying fees to FIFA. When it comes time to buy tickets, fans exchange the purchase right for a "ticket collection right," completing the purchase through FIFA's regular ticketing system. Each token is verifiable and traceable on-chain, eliminating fraud from the source. Users operate on FIFA's standard platform without needing to know they are using blockchain.
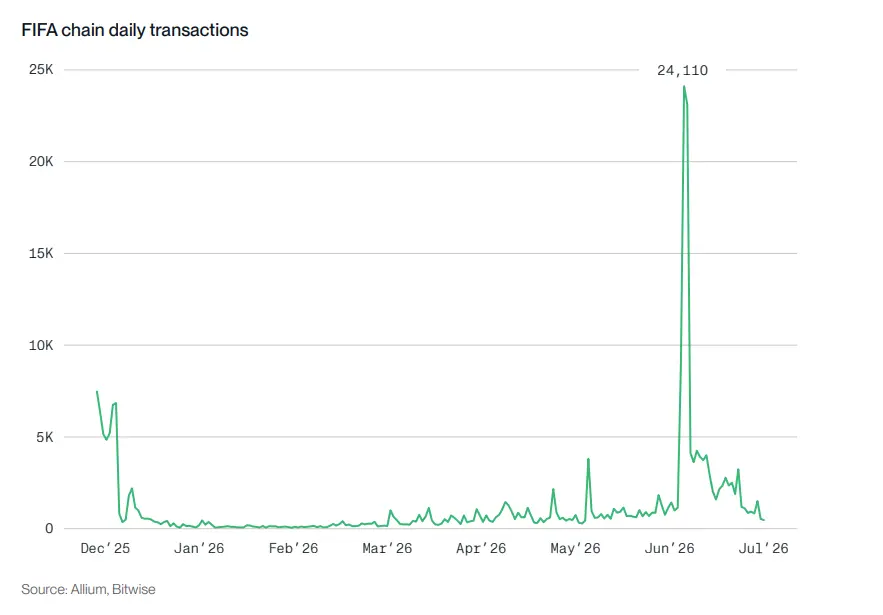
More than 100,000 purchase right tokens have been issued, with a total trading volume exceeding $25 million. In the days leading up to the event, ticketing activity on Avalanche generated over 60,000 transactions, with a single-day peak of 24,110 transactions, several times the usual volume.
Another example is Progmat, Japan's largest tokenized securities platform, initiated by Mitsubishi UFJ Financial Group, with major Japanese banks, exchanges, and technology companies as shareholders, accounting for 63% of Japan's cumulative issuance of security tokens, covering real estate, corporate bonds, and other institutional assets. The platform's advantages are operational: settlements are completed in real-time rather than taking several days, assets can be traded around the clock, and ownership is automatically verified without the need for manual reconciliation between intermediaries.
Progmat previously operated on Corda, a private ledger used by financial institutions but closed to the outside. In February 2026, it announced its migration to a dedicated Avalanche L1, making its tokens EVM-compatible and allowing interaction with a broader public chain ecosystem while obtaining a compliant licensing environment with its own validator set, which is essential for regulated securities issuance. The migration involves over $2 billion in tokenized assets and is still ongoing.
Upcoming Upgrades
Four developments define Avalanche's recent direction, one of which has already taken effect, two are in the proposal process, and one is in development with no set timeline.
ACP-267, concerning validator online rates, took effect on April 1, 2026, raising the minimum online rate requirement for all staking periods starting from that date from 80% to 90%, with validators below the threshold receiving no rewards for that period. This change will gradually take effect as existing staking periods expire and validators rebind.
ACP-236, regarding continuous staking, has not yet launched. Currently, stakers must set an end date when delegating, and after expiration, they must manually initiate a new staking transaction to rebind; this proposal eliminates that requirement, allowing staking to automatically renew at the end of each period.
ACP-194, concerning streaming asynchronous execution, has not yet launched. Currently, a block must be fully executed before being accepted by consensus; this proposal decouples the two, allowing consensus and execution to run in parallel, with the network accepting blocks as valid once deemed so, while execution completes separately. The effect is higher throughput and lower latency under load, without changing how validators and users interact with the network.
FIREWOOD is a new state database written in Rust by Ava Labs, providing more efficient access to blockchain state than existing solutions, with the mainnet launch date yet to be determined, primarily targeting high-throughput L1s where state access has become a bottleneck.
After the past year's fee reductions, the C chain's burn relative to inflation has become quite small. Moving forward, a more significant driver will be the expansion of L1 numbers, with each sovereign L1 paying about 1.33 AVAX per validator per month to the P chain, which is burned; the more networks there are, the larger this fee flow becomes. The actual yield is currently around 5.7% and is gradually declining as the circulating supply approaches the 720 million cap. The optimistic scenario depends on whether the scale of L1 fees can be substantial enough to materially offset this decline.
NEAR
Staking Rewards
NEAR's staking rewards are provided by protocol inflation. In Q4 25, NEAR reduced its target inflation rate from 5% to 2.5%, with 10% allocated to the protocol treasury operated by the NEAR Foundation, and the remaining 90% distributed to validators and delegators. This 2.5% rate remains unchanged unless modified again through a protocol upgrade.
The total supply is approximately 1.3 billion, with about 588 million staked, resulting in a staking rate of about 45%. Since rewards are only distributed to staked NEAR, the current comprehensive annualized staking yield is approximately 4.9%.
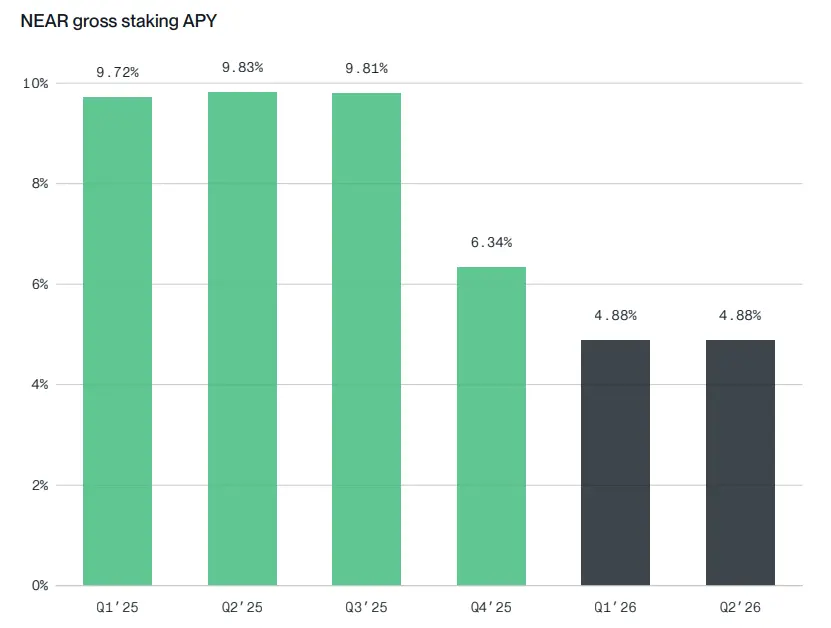
Figure Caption: Comprehensive annualized staking yield: 25Q1 9.72%, 25Q2 9.83%, 25Q3 9.81%, 25Q4 6.34%, 26Q1 and 26Q2 both 4.88%
Reducing inflation has not led to a decline in staking participation. The staking rate has remained stable at around 45% since the change, and the nominal yield reduction has not altered staking behavior.
A key point for validators and delegators is that NEAR's staking rewards are not driven by transaction fees. Users pay transaction fees in NEAR, determined by consumed gas and the network gas price. During smart contract execution, about 30% of the execution fee is returned to the contract account as developer compensation, while the remaining 70% is burned. Increased activity will thus raise both the burn amount and contract revenue, but will not directly increase rewards for validators or delegators.
On-Chain Activity
Total gas consumption dropped from 419,000 in Q1 25 to 308,000 in Q4 25, with the decline accelerating in 2026, estimated at 246,000 in Q1 26 and 82,000 in Q2 26, an 81% decrease compared to Q1 25.
The significant drop in Q2 was primarily due to the collapse of Kai-Ching activity. Kai-Ching is the rewards and payment layer behind KaiKai, a shopping and loyalty application developed by Cosmose AI in Singapore. Until March 2026, Kai-Ching was one of the largest sources of activity on NEAR, often accounting for about half of total gas consumption.
Public information does not clearly disclose the specific business reasons for the activity collapse. Public materials indicate that KaiKai and Kai-Ching are built around rewards, cashback, payments, and in-app user interactions, with transaction costs hidden from end users.
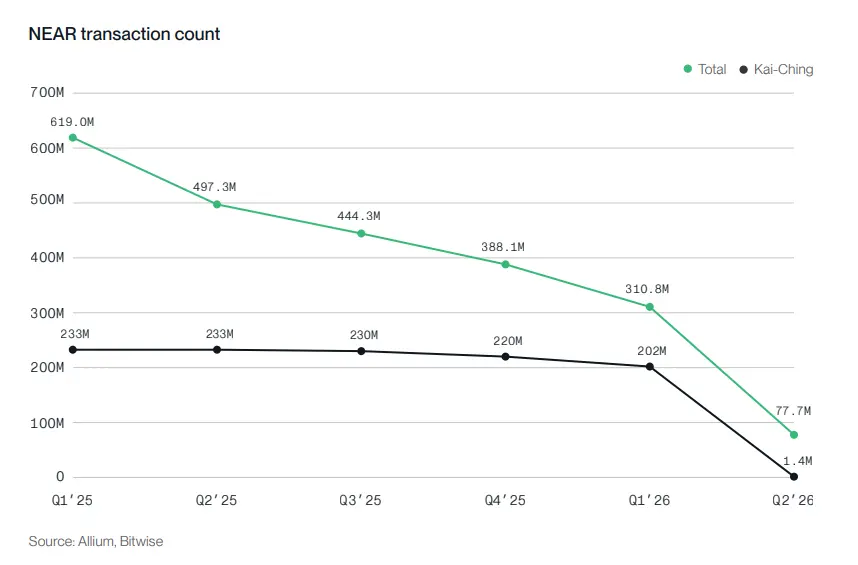
Figure Caption: Total transaction count and Kai-Ching transaction count: 25Q1 619 million (of which 233 million), 26Q1 310.8 million (of which 202 million), 26Q2 77.7 million (of which 1.4 million)
Transaction numbers show a similar pattern. Total transactions dropped from 619 million in Q1 25 to 310.8 million in Q1 26, further declining to 77.7 million in Q2 26, a 75% quarter-on-quarter decrease. Kai-Ching transactions fell from about 202 million in Q1 26 to only 1.4 million in Q2 26, explaining the vast majority of the decline.
Since NEAR's fees are a function of gas consumption, on-chain revenue has declined alongside activity. Comprehensive fee revenue dropped from approximately $1.4 million in Q1 25 to $306,000 in Q1 26 and $137,000 in Q2 26. The decrease in gas usage remains the primary reason for the fee decline in Q2, although NEAR's price rebounded from about $1 to about $2.8, partially cushioning the impact in dollar terms.
Intents
Intents have become a key new growth point for NEAR. It is an execution layer where users specify the desired outcome, such as exchanging or transferring an asset across chains, and specialized entities called solvers compete to execute and provide the best price.

After launching, transaction volume grew rapidly, rising from $332 million in August 2025 to a peak of $3.7 billion in November. Monthly transaction volume stabilized between $1.9 billion and $2.7 billion in the first half of 2026. Ethereum is the largest source of transaction volume, with June 2026 rebounding to $2.4 billion, and the chain's composition becoming more diversified, with significant contributions from Zcash, NEAR, TRON, Solana, and BSC.
Fees generally follow transaction volume but are not completely synchronized. The most notable divergence occurred in December 2025, when transaction volume dropped from $3.65 billion to $2.01 billion, yet fees remained high at $4.12 million. A smaller divergence occurred in June 2026, when transaction volume rose to $2.35 billion, but fees remained roughly flat at $3.11 million, still below early-year levels. The differences mainly stem from the combination of routing and fee mechanisms, as different Intents routes touch different fee structures, so total fees do not correlate one-to-one with transaction volume.
In February 2026, NEAR introduced a buyback mechanism for Intents, using the retained Intents revenue after deducting shares for partners and integrators to buy NEAR. From the mechanism's launch until June 2026, Intents generated about $2.26 million in buyback funds.
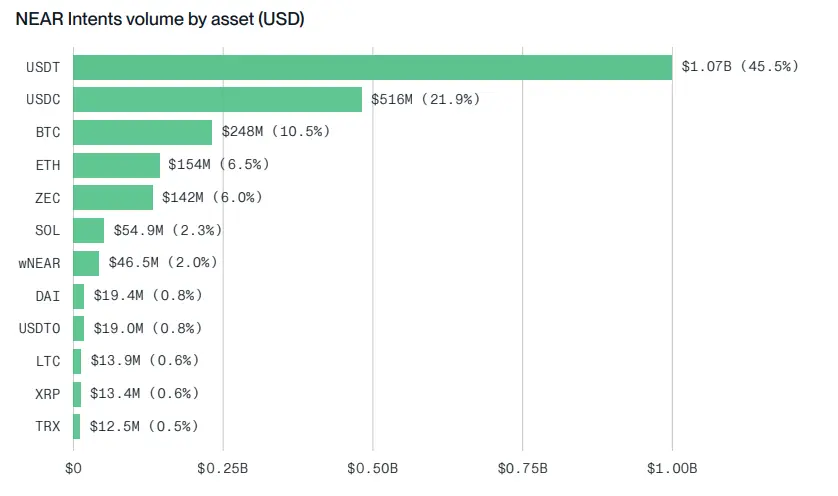
Figure Caption: Distribution of assets in Intents transactions: USDT $1.07 billion (45.5%), USDC $516 million (21.9%), BTC $248 million (10.5%), ETH $154 million (6.5%), ZEC $142 million (6.0%)
Transaction volume is highly concentrated in stablecoins, with USDT and USDC together exceeding 67%. Following them are BTC, ETH, and ZEC, with a longer tail including wNEAR, SOL, etc.
The comparison between Intents and the base chain in terms of REV is now quite wide. In Q2 26, Intents generated comprehensive fees of $9.3 million, while the NEAR chain itself generated comprehensive fees of $137,000. By this measure, the fees generated by Intents are approximately 68 times that of the base chain.
Confidential Execution and AI Infrastructure
Privacy is one of the main pillars of NEAR's current roadmap. Confidential Intents (CIs) add a layer of privacy to Intents, with a model similar to regular Intents, but execution is routed to a restricted environment, where details such as assets, amounts, routes, or counterparties are not fully exposed until settlement.
It should be noted that this is not complete cryptographic privacy. The current design relies on a private NEAR shard, permissioned validators, and TEE-based infrastructure, so it is more accurately described as confidential execution rather than complete privacy.
By the end of June, the total TVL of Intents rose to $78.7 million, with confidential Intents reaching $28.5 million, accounting for about 36%. Confidential execution is becoming a significant part of the Intents stack.
At NEARCON 2026, NEAR AI launched IronClaw, a secure runtime for autonomous agents. It is an open-source Rust implementation inspired by OpenClaw, designed around privacy, tool isolation, and credential protection.
The main feature is sandbox execution. IronClaw runs untrusted tools in isolated containers, limiting the scope of access for agent tools, and reducing the impact when tool behavior is abnormal or manipulated. Its design also ensures that credentials are not exposed to large models.
Another aspect is infrastructure integration. NEAR AI positions IronClaw as part of a broader confidential computing stack, which includes NEAR AI Cloud, cryptographic enclaves, private inference, and confidential GPU markets. In this setup, IronClaw provides the agent runtime, the market provides private computing power, and Intents provide the transaction and settlement layer.
The AI product roadmap is still in its early stages. IronClaw's public repository remains active, but currently, there is limited visible evidence of adoption.
Tempo
Transaction Volume, Annualized Scale, and Fees
Tempo is an EVM-compatible L1 incubated by Stripe and Paradigm, built for one purpose: fast, low-cost stablecoin payments. Transaction fees are paid directly in stablecoins, with the protocol automatically converting them to the validators' preferred tokens. The mainnet launched on March 18, 2026.
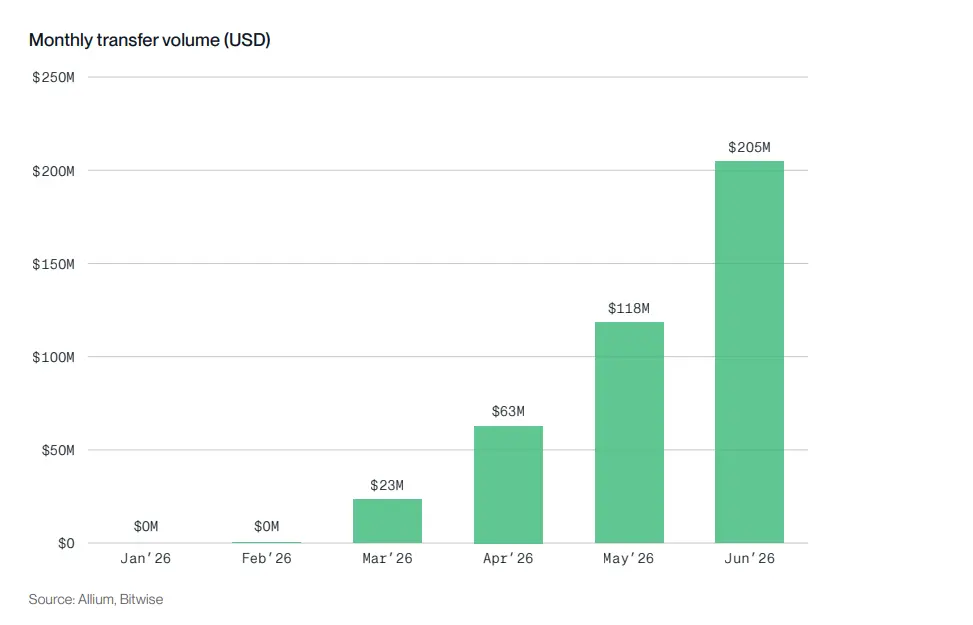
In Q2 26, Tempo processed approximately $386 million in stablecoin transfers (excluding minting, treasury, and fee system addresses). Transaction volume grew from $23 million in March (the first incomplete month of the mainnet) to $63 million in April, $118 million in May, and $205 million in June. At June's pace, the chain's annualized stablecoin payment volume is about $2.5 billion.
Transaction fees have been intentionally kept very low. Total fees in Q2 were approximately $39,800, with a median fee of $0.0012, almost entirely paid in pathUSD and USDC.e.
April was particularly notable, accounting for $28,900 of the total. Throughout the quarter, gas prices remained stable at 20 to 21 gwei, so the difference was not due to price changes but rather changes in transaction types. April saw a concentration of computationally intensive activities: cross-chain bridging, NFT market transactions, token authorizations, and new contract deployments. These operations consumed about 276,000 gas, while standard stablecoin transfers only required 52,000 gas, directly reflecting higher fees under unchanged gas prices. In May and June, the chain returned to lightweight stablecoin transfers, with median fees dropping to about $0.001.
Stablecoin Structure
The stablecoin TVL at the end of Q2 was approximately $40.2 million, growing about sevenfold from $6.3 million at the beginning of the quarter. The gap between TVL and transaction volume reflects the nature of the payment chain: the same batch of stablecoins is repeatedly transferred rather than sitting idle on-chain.
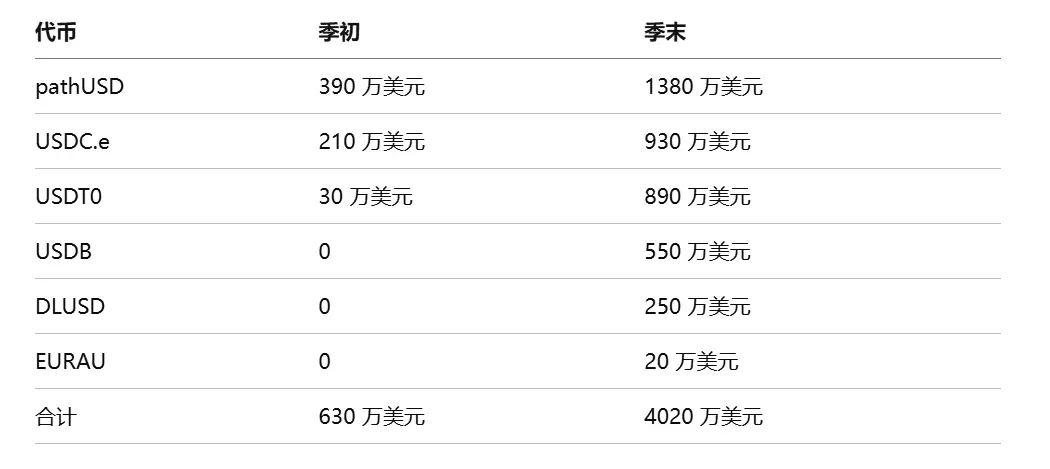
The two largest stablecoins on Tempo, USDT0 and USDC.e, were brought in through cross-chain bridges, rather than being natively issued on this network. USDT0 uses LayerZero's burn-mint standard, where USDT is locked on Ethereum, and when funds arrive, USDT0 is minted on Tempo, and destroyed when leaving. USDC.e comes in through Stargate, which is also a LayerZero-based liquidity pool bridge. Since both are brought in via bridges, most of their transaction volume flows through a few bridging contracts and routers, rather than directly between end users.
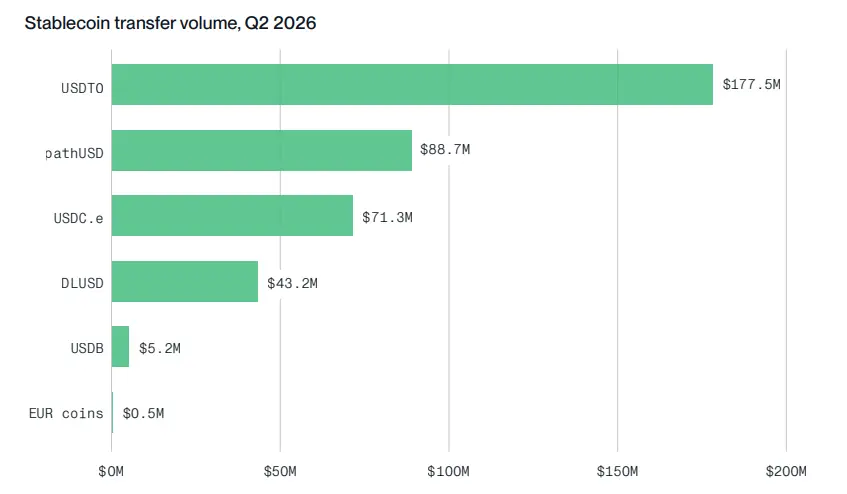
Figure Caption: Q2 26 transaction volume: USDT0 $177.5 million, pathUSD $88.7 million, USDC.e $71.3 million, DLUSD $43.2 million, USDB $5.2 million
The difference lies in the breadth of usage. USDC.e was completed through about 146,000 different senders via 2.3 million transactions, with identifiable payers including Deel. USDT0 had only about 2,100 senders and 90,000 transactions, with the largest senders being automated LayerZero bridges and routing contracts.
PathUSD is another case. Issued by Stripe's Bridge, it is minted directly on Tempo, recording 800,000 transactions and about 49,000 senders, without bridging intermediaries.
Accordingly, pathUSD and USDC.e reflect genuine multi-user payment activity, while USDT0's transaction volume primarily consists of bridging and operator circulation. This portion is still counted, as it flows through bridges and routing contracts rather than system addresses.
Deel's Stablecoin Salary Distribution
The most explicit corporate use case on the network is the global payroll platform Deel. Its payment wallet distributed approximately $30 million to about 7,200 contractors in Q2 26.
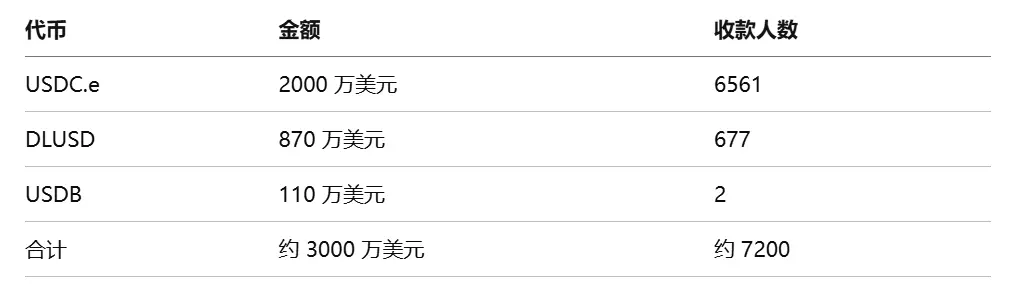
Global contractor salaries are settled in stablecoins with nearly zero fees, which is precisely what Tempo was designed to do. In the first 100 days since the mainnet launch, the annualized transfer volume of this network has already exceeded $2.5 billion, with confirmed corporate users like Deel, making pathUSD the leading natively issued stablecoin on-chain.
 Risk warning