CICC: The Financial Moment of AI
 Core Viewpoint

 CICC Report: The external financing demand for AI infrastructure will reach $3.5 trillion in the next five years, and annual revenue from AI applications must reach $1 trillion to support returns, with risks depending on commercialization progress.
AI capital expenditure is at a turning point, shifting from being driven by internal cash flow to balance sheet expansion. As investment scales exceed the capacity of internal cash flow, marginal funding will increasingly come from the financial system. This report, as the first in the "AI Financing Tracking" series, attempts to answer three questions: How will the financial system accommodate the $3.5 trillion AI financing demand? Can AI investments meet debt repayment and equity returns? What opportunities will this round of AI financing cycles bring to financial institutions, and what risks will accumulate and transmit?
Abstract
Abstract
AI Infrastructure Capital Expenditure: From Cash Flow to Debt. The capital expenditure of large cloud providers is expected to rise from about 12% of revenue in 2023 to about 23% in 2025, with market consensus predicting that this ratio may further increase to over 40% by 2027, approaching or even exceeding the historical peaks of capital expenditure cycles in the internet and energy sectors. Under the pressure of AI capital expenditure, cloud providers may shift their AI investments from operational cash flow to more reliance on external financing. Based on the market consensus expectations for the operating cash flow and capital expenditure of large cloud providers, AI capital expenditure is expected to create approximately $3.5 trillion in external financing demand over the next five years.
Where will the $3.5 trillion come from? In the baseline scenario, we estimate that the $3.5 trillion in external financing for AI capital expenditure will be sourced from public market equity ($0.4 trillion), investment-grade bonds ($1.5 trillion), leveraged financing ($0.3 trillion), asset-backed securities ($0.3 trillion), and private equity ($1.1 trillion). Among these, investment-grade bonds and private equity serve as the ballast for financing; the former relies on the balance sheet expansion and cash flow repayment capacity of cloud providers, while the latter can meet the financing needs of higher-risk, larger-scale projects and can reduce the capital input of cloud providers through off-balance-sheet financing structures, flexibly filling financing gaps.
A trillion-dollar question: How will AI debt be repaid? To meet repayment needs and shareholder returns, assuming a ROIC of 10%, we estimate that AI applications will ultimately need to generate approximately $1 trillion in sustainable revenue annually. Assuming this revenue scale is reached by 2030, it implies that AI application revenue needs to nearly double each year over the next five years. More important than revenue scale are profit margins and asset lifespan: with an EBITDA profit margin of about 50% during the maturity period and an infrastructure depreciation period of about five years, investments are expected to yield positive returns; if the profit margin is below 20%, even with a longer asset lifespan, it will be difficult to cover capital costs.
Can refinancing replace cash flow? Long-term bonds issued by large cloud providers typically have maturities of 10-30 years, and infrastructure funds also usually have investment periods of over 10 years; after data centers are operational, financing can also be replaced with project bonds and securitization. However, refinancing can only buy time and cannot replace cash flow: if project utilization, profit margins, and asset lifespan remain below expectations for an extended period, continuous rolling financing will instead increase leverage and financing costs. We estimate that from 2027 to 2032, the maturity of bonds from large cloud providers will peak, with an annual maturity scale of about $28 billion, a 60% increase compared to 2024-2026, leading to increased refinancing pressure.
Opportunities and risks for financial institutions. Banks can earn revenue from underwriting, trading, mergers and acquisitions advisory, and project financing, while private equity and insurance institutions gain new long-term assets. In the second quarter of 2026, the non-interest income of the six largest U.S. banks grew by 32% year-on-year; as of June 2026, loans from banks to non-bank financial institutions increased by about 25% year-on-year, with AI financing being a significant contributor. Bank revenues are often recognized during the financing and construction phases, while credit risks only manifest during project production and refinancing phases, showing a characteristic of "revenue front-loaded, risk back-loaded."
Is AI a financial "bubble"? Currently, the main investors in AI are still large cloud providers with strong cash flows, and equity and subordinated capital can absorb losses before bank priority loans. Therefore, even if some projects underperform, risks are more likely to first manifest as adjustments in the valuations of related companies, a slowdown in capital expenditure, and localized credit losses, rather than immediately transforming into a financial system crisis. On the other hand, the rapid growth of external financing, especially private equity and leveraged financing, has also created financial spillover effects. If commercial growth continues to lag behind capital expenditure, risks will gradually shift from valuation corrections to deteriorating credit quality, transmitted through channels such as rolling financing, private credit, and securitization in the financial system. The scale of financing itself is not the problem; the real test is whether cash flow can be generated before financing costs rise and asset values depreciate.
【Chart 1】Where does the $3.5 trillion AI financing come from?
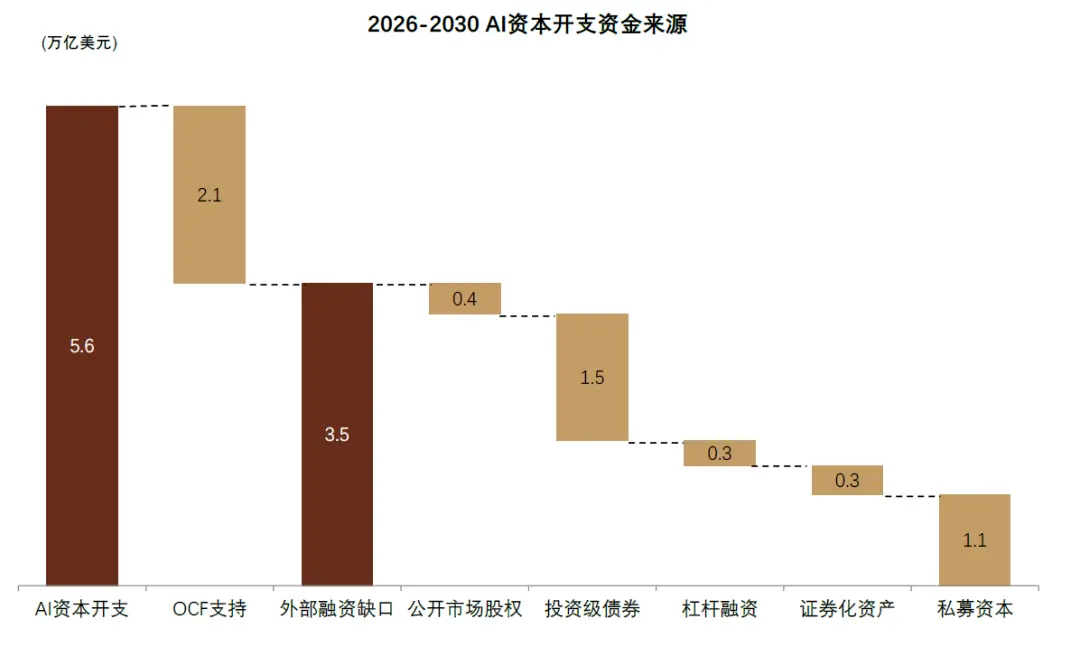
Note: AI capital expenditure and OCF support portions are based on market consensus expectations; assuming a public market equity ratio of 10%; the issuance scale of investment-grade bonds is calculated based on the debt ratings, leverage ratios, and bond concentration constraints of large cloud providers; leveraged financing includes high-yield debt and leveraged loans, and securitized assets include ABS and CMBS, estimated considering market capacity and acceptance; the gap beyond the above financing forms is assumed to be covered by private equity, including infrastructure funds, private equity funds, private credit, real estate funds, etc. Demonstrative calculations do not represent actual forecasts.
Source: Public company announcements, Bloomberg, CICC Research Department
Risks
AI commercialization progress is below expectations
AI capital expenditure and financing demand are below expectations
Capital market financing conditions tighten
AI Infrastructure Capital Expenditure: From Cash Flow to Debt
New Cycle of AI Capital Expenditure Creates Financing Demand
Market predictions for AI capital expenditure over the next five years mostly range between $4 trillion and $8 trillion, with significant differences in calculation criteria and logic. We select the market consensus expectation of about $5.6 trillion as the assumption for AI capital expenditure from 2026 to 2030, providing a basis for subsequent calculations of financing gaps. Specifically, we use the capital expenditure of five large cloud providers as the base for 2025 and use the market consensus expectations for AI-related revenues of NVIDIA and AMD as proxy indicators to backtrack the future investment growth rate of the AI industry chain. The market consensus for the five-year compound growth rate of AI-related revenues for NVIDIA and AMD is about 44%, significantly higher than the market consensus expectation of about 21% growth for capital expenditure supported by the operating cash flow of cloud providers by the end of 2025. The difference between the two indicates that relying solely on the operating cash flow of cloud providers may struggle to support AI capital expenditure, necessitating more external financing support in the future.
【Chart 2】Chip manufacturers' expected growth rate of AI-related revenues exceeds the growth rate of cloud providers' capital expenditure
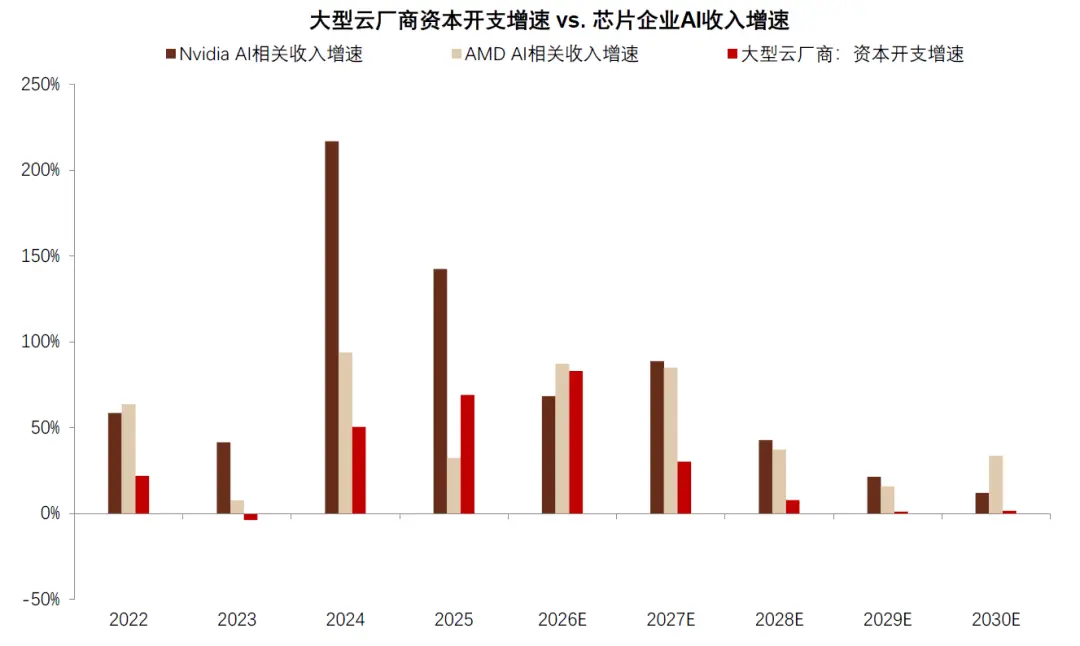
Note: Data for 2026-2030 is based on Bloomberg consensus estimates; demonstrative calculations do not represent actual forecasts.
Source: Public company announcements, Bloomberg, CICC Research Department
Large Cloud Providers: From Cash Flow to Debt
As of the end of 2025, Microsoft, Amazon, Alphabet, Meta, and Oracle collectively have assets of about $2.6 trillion, with a debt-to-asset ratio of about 45% and a net debt/EBITDA of only about 0.3 times; the five companies generate approximately $580 billion in operating cash flow annually. However, under the pressure of AI capital expenditure, some cloud providers are experiencing rising leverage. The ratio of capital expenditure to revenue for the five companies is expected to rise from about 12% in 2023 to about 23% in 2025, with market consensus predicting that this ratio may further increase to over 40% by 2027, approaching or even exceeding the historical peaks of capital expenditure cycles in the internet and energy sectors. Market expectations suggest that the combined free cash flow of large cloud providers may decrease from about $200 billion in 2025 to about $24 billion in 2027, leading to a corresponding reduction in funds available for stock buybacks, dividends, and other uses. Therefore, AI investments by large cloud providers may shift from operational cash flow to more reliance on external financing.
【Chart 3】AI suppliers benefit from cloud providers' capital expenditure, but the decline in cloud providers' free cash flow puts pressure on stock prices
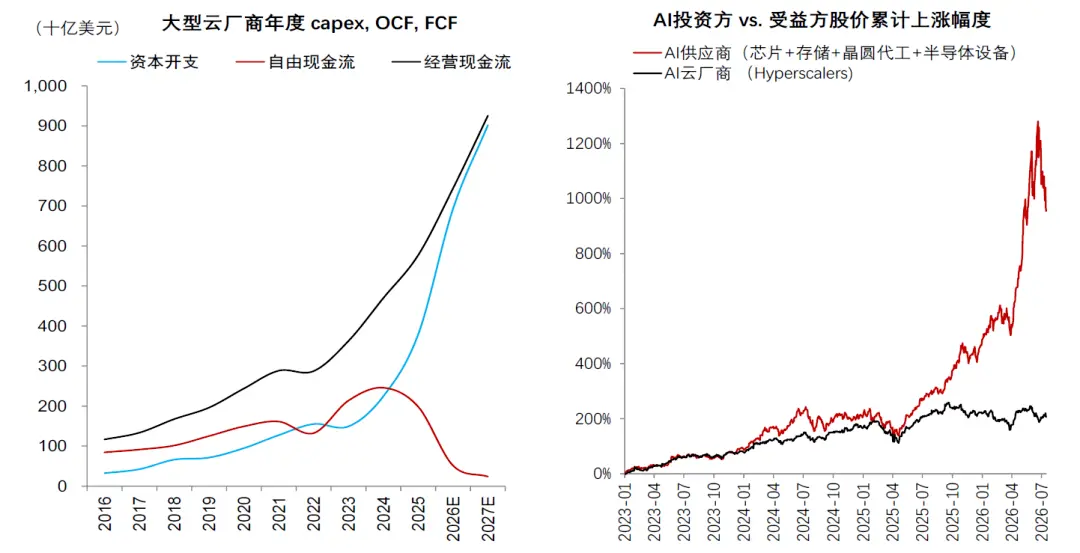
Note: 2026-2027 uses Bloomberg consensus expectations; the AI suppliers stock price index includes NVIDIA, AMD, Broadcom, SK Hynix, Samsung Electronics, Micron Technology, ASML; the AI cloud providers stock price index includes Meta, Amazon, Microsoft, Alphabet, and Oracle.
Source: Factset, Bloomberg, public company announcements, CICC Research Department
【Chart 4】Cloud providers' capital expenditure intensity is rising, expected to exceed the internet and energy bubbles
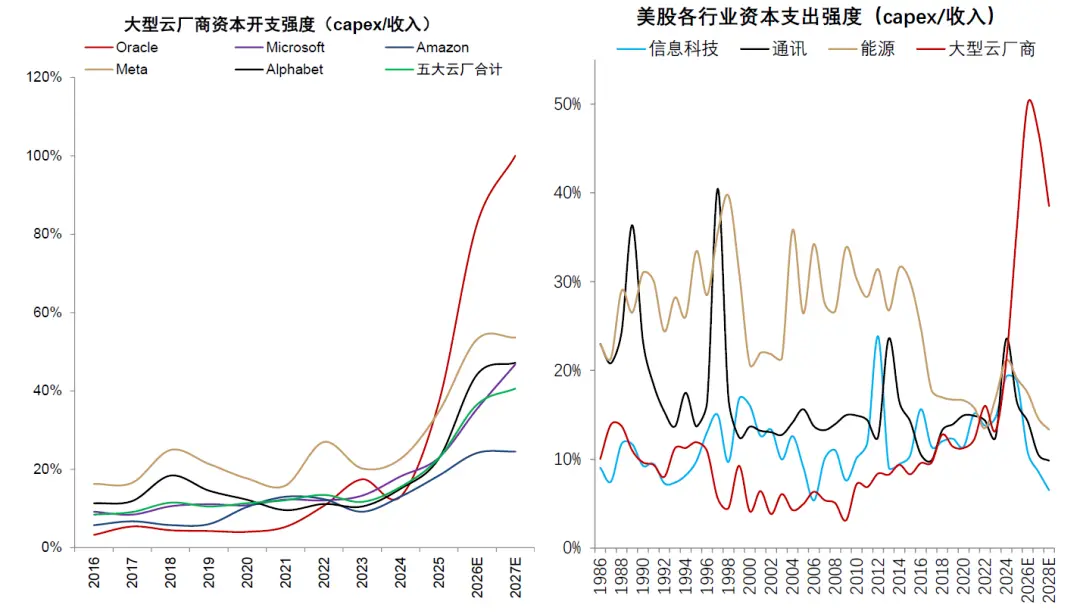
Note: 2026-2028 uses Bloomberg consensus expectations.
Source: Factset, Bloomberg, public company announcements, CICC Research Department
$3.5 Trillion: The Financing Gap for AI Capital Expenditure
We take the market consensus expectation for the capital expenditure of large cloud providers at the end of 2025 as the assumption for capital expenditure supported by operating cash flow (approximately $2.1 trillion), at which point cloud providers have not yet initiated large-scale external financing. The market expects that the operating cash flow and capital expenditure at this time can meet dividend, buyback, and necessary liquidity needs under limited external financing; deducting this portion from the industry capital expenditure expectation gives us the scale of external financing (approximately $3.5 trillion).
【Chart 5】AI capital expenditure brings a $3.5 trillion financing gap
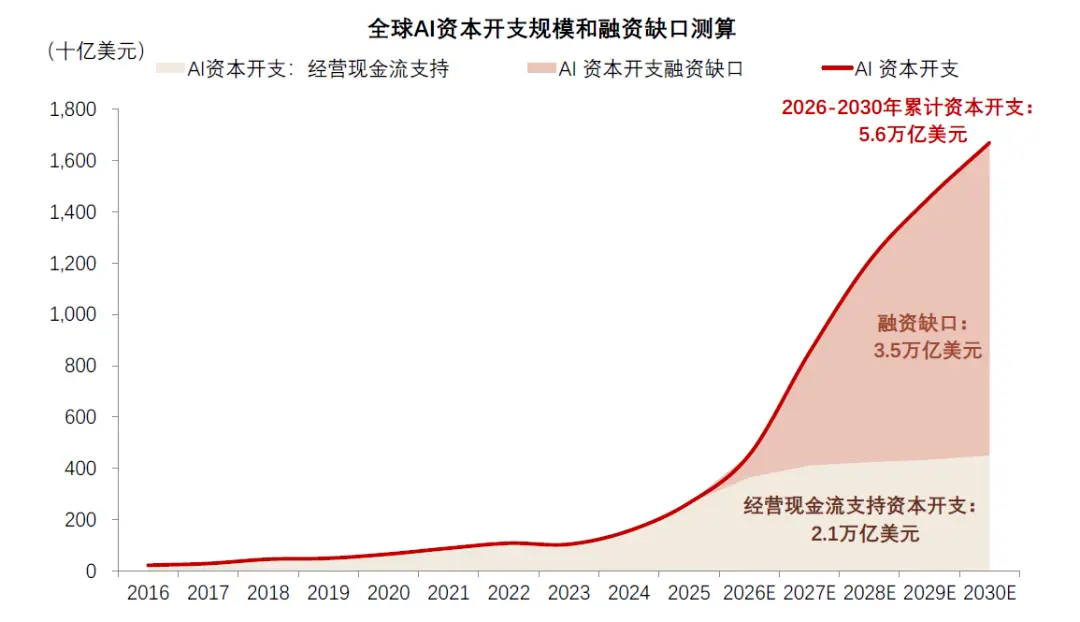
Note: Demonstrative calculations do not represent actual forecasts. The scale of industry AI capital expenditure is based on the growth rates of AI-related revenues for NVIDIA and AMD and the back-calculation of capital expenditure for large cloud providers in 2025; capital expenditure supported by operating cash flow is estimated based on Bloomberg consensus expectations for the internal capital expenditure of large cloud providers at the end of 2025, considering the capital expenditure space beyond the needs for dividends and buybacks.
Source: Public company announcements, Bloomberg, CICC Research Department
Where does the $3.5 trillion come from: The Financing Structure of AI
Investment-Grade Bonds: The Ballast for AI Financing
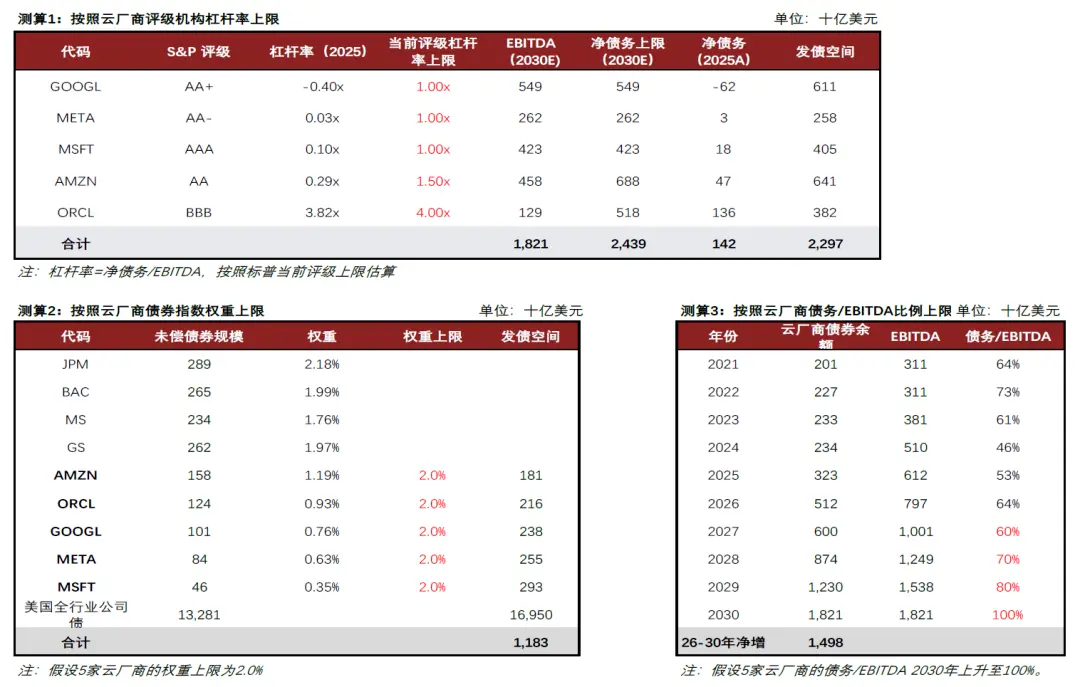
We estimate that investment-grade bonds can provide about $1.5 trillion in funding for AI investments from 2026 to 2030, accounting for about 42% of external financing needs, making it the largest single financing channel. Large cloud providers have strong operating cash flows, low initial leverage, and investment-grade credit ratings, allowing them to access larger, longer-term, and relatively lower-cost funding in the global bond market. We calculate their bond issuance capacity based on rating agency leverage constraints, bond index concentration, and target debt/EBITDA, yielding a capacity range of approximately $1.2 trillion to $2.3 trillion.
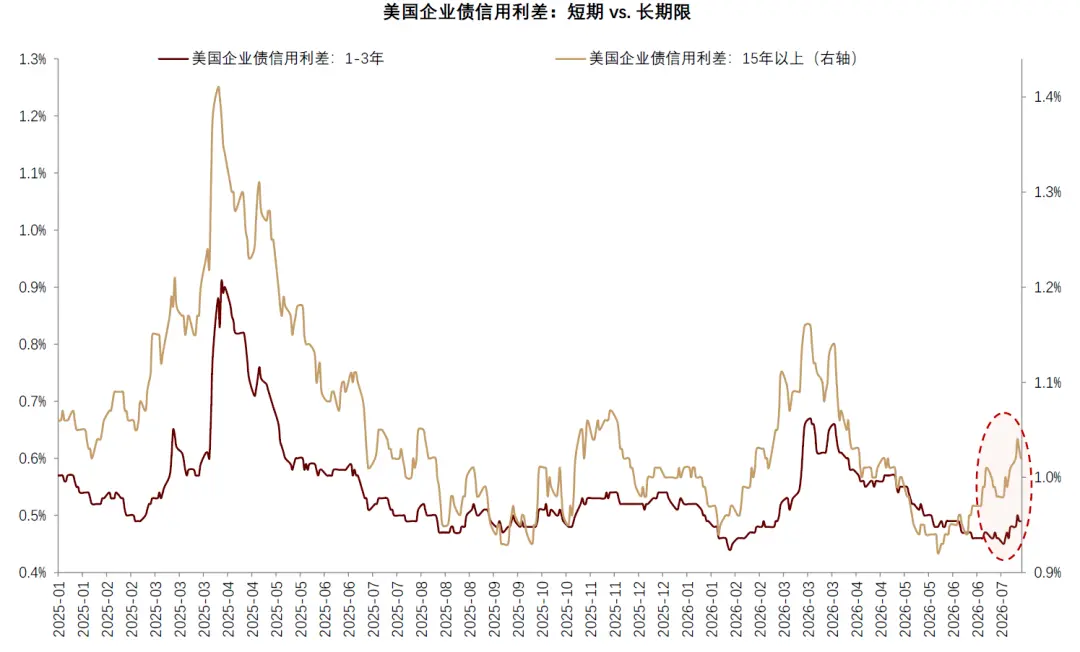
From early 2026 to the present, the bond issuance scale of the five large cloud providers has reached approximately $190 billion, setting a historical high, with the issuance currencies further expanding from dollars to euros, pounds, and Canadian dollars, diversifying bond financing to alleviate issuance pressure. The investment-grade bond market has the capacity to bear the bulk of AI financing, but sustained large-scale, long-term bond supply may also increase the concentration of the tech sector in credit indices, leading to issues such as widening long-end credit spreads, rising financing costs, and enhanced rating constraints.
【Chart 6】Large cloud providers' bond issuance reaches historical highs, with currency diversification
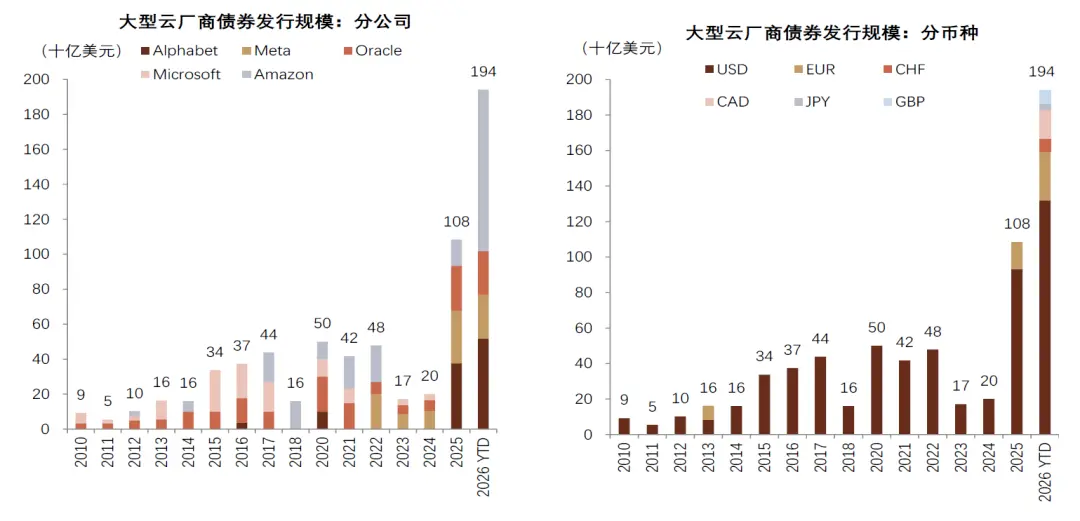
Note: As of July 14, 2026.
Source: Bloomberg, CICC Research Department
【Chart 7】Estimation of the upper limit for investment-grade bond issuance by cloud providers
Note: Data as of July 14, 2026.
Source: Bloomberg, S&P Global, CICC Research Department
【Chart 8】Issuance of ultra-long bonds for AI may lead to widening long-end credit spreads
Source: Wind, CICC Research Department
Leveraged Financing: Transitional Capital for High-Growth Enterprises
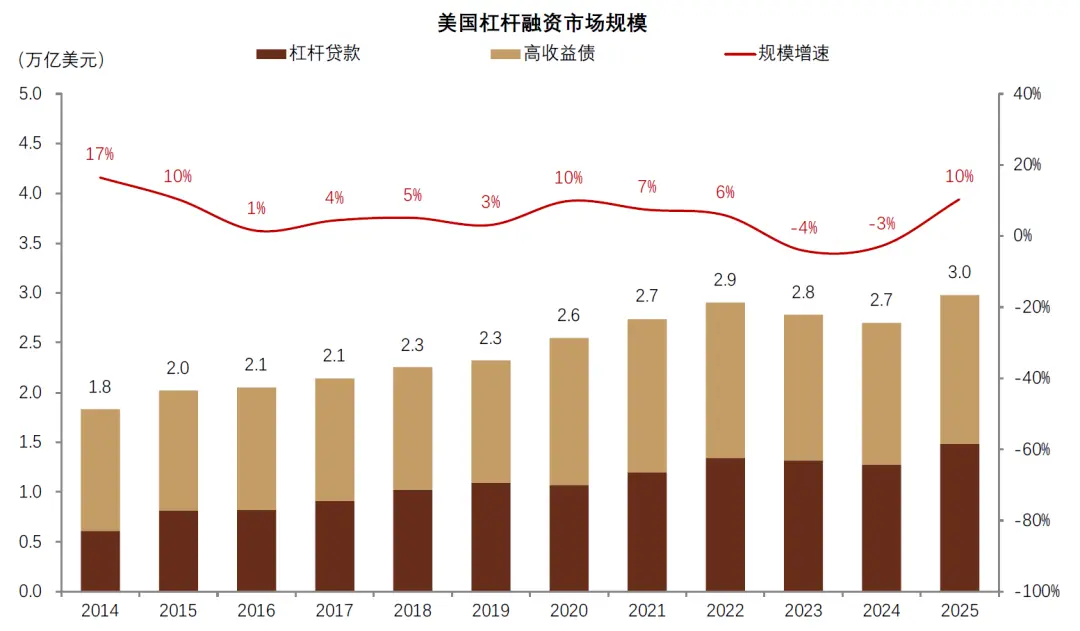
We estimate that high-yield bonds and leveraged loans can provide about $0.3 trillion in funding for AI investments, accounting for about 8% of external financing needs, based on the market capacity ratio of leveraged financing to investment-grade bonds (about 20%). This market primarily serves Neocloud, HPC operators, and data center companies that have not yet obtained investment-grade ratings but have a certain revenue and asset base.
【Chart 9】The U.S. leveraged financing market is approximately $3 trillion
Note: Data as of July 14, 2026.
Source: Bloomberg, CICC Research Department
Public Market Equity: From "De-equitization" to "Re-equitization"
We assume a project equity ratio of 20% (typically 10%-30% in the industry), with 50% provided by public equity, estimating that public market equity can provide about $0.4 trillion in funding for AI investments from 2026 to 2030. Equity capital does not require fixed principal and interest repayments, allowing it to first bear the risks of technological iteration, commercialization, and asset residual value, making it more suitable for AI model companies, Neocloud, and data center operators that have not yet formed stable cash flows.
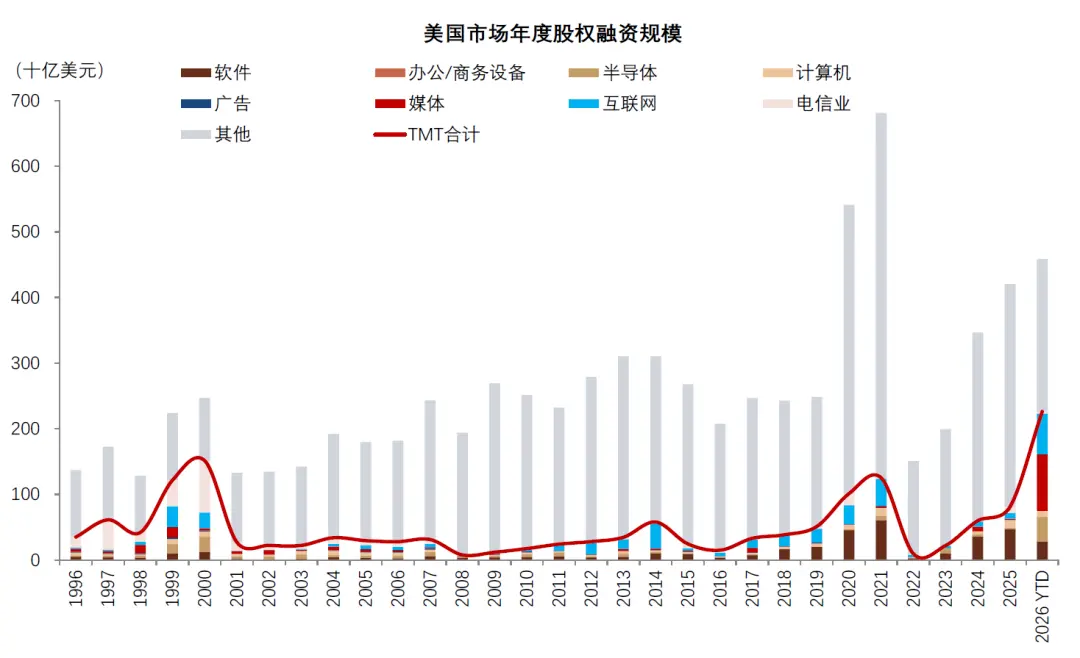
In the past decade, U.S. and Chinese publicly listed companies have tended to repurchase shares and increase dividends, thereby reducing circulating capital and enhancing earnings per share, overall weakening the function of the equity market as a financing channel, known as "de-equitization." "Re-equitization" means a reversal of this trend, with companies increasingly relying on new issuances to raise funds. Equity financing is highly dependent on market valuation levels and issuance windows; once market volatility increases or valuations decline, the pace of financing may significantly slow.
【Chart 10】This year's U.S. TMT equity financing scale is expected to reach a historical high
Note: Includes U.S. IPOs, private placements, public offerings, rights issues, etc.; data as of July 14, 2026.
Source: Bloomberg, CICC Research Department
Securitized Products: From Corporate Credit to Asset Credit
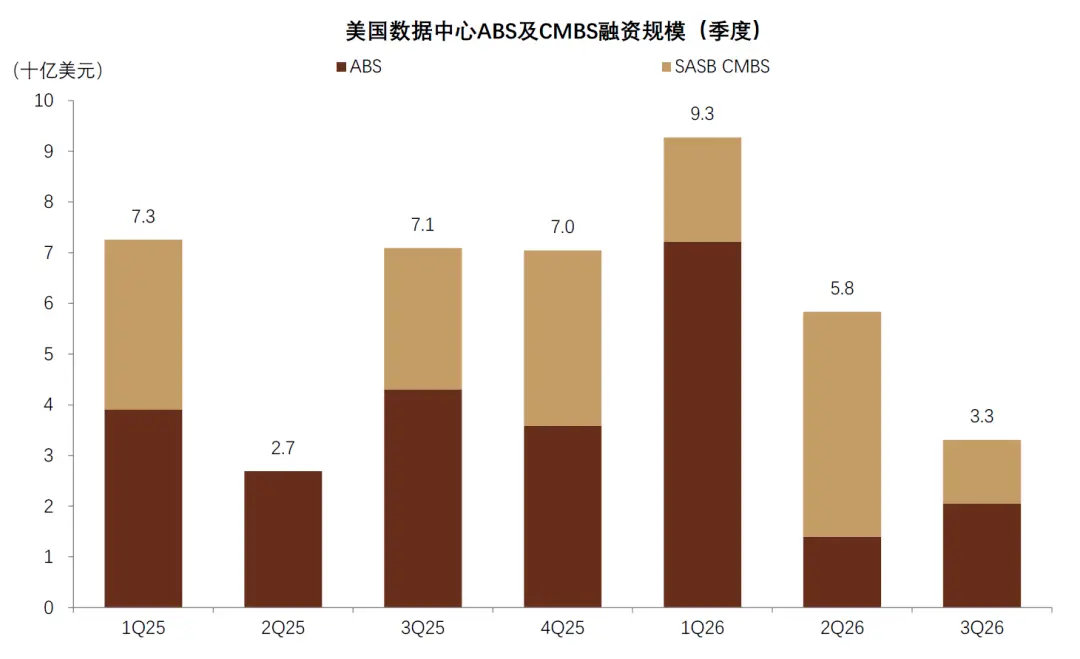
We assume that the scale of AI financing through securitized products from 2026 to 2030 will double compared to 2025 levels, estimating that ABS, CMBS, and other asset-backed financing can provide about $0.3 trillion in funding from 2026 to 2030, accounting for about 9% of external financing needs. Securitized financing is primarily applicable to data centers and computing assets that are already operational and have long-term leases or identifiable cash flows, shifting the financing basis from overall corporate credit to specific assets, leases, and cash flows.
Securitization helps to release construction loans and private capital and provides long-term assets for insurance, pension, and fixed-income funds, but its expansion still depends on lease stability, tenant credit, asset residual value, and standardization. Especially for rapidly iterating technologies like GPUs, depreciation rates and second-hand market values may become significant constraints on ratings and structural design.
【Chart 11】In 2025, U.S. data center securitized product financing is approximately $30 billion
Note: Data as of July 14, 2026.
Source: Bloomberg, CICC Research Department
Private Equity: Flexible Supplement to Financing Gaps
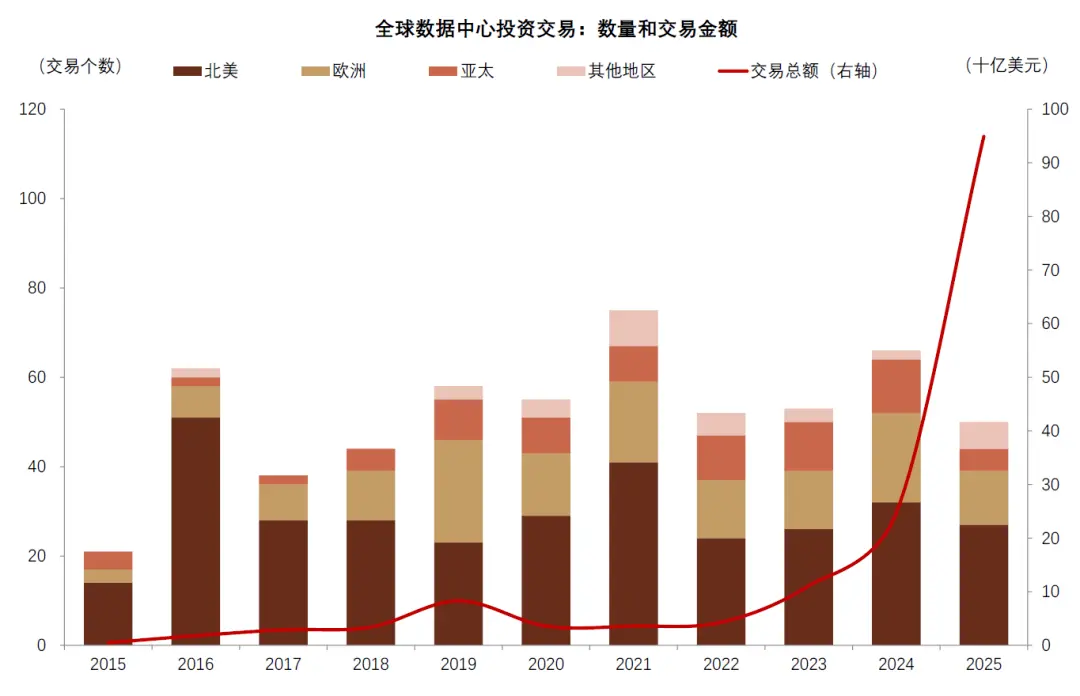
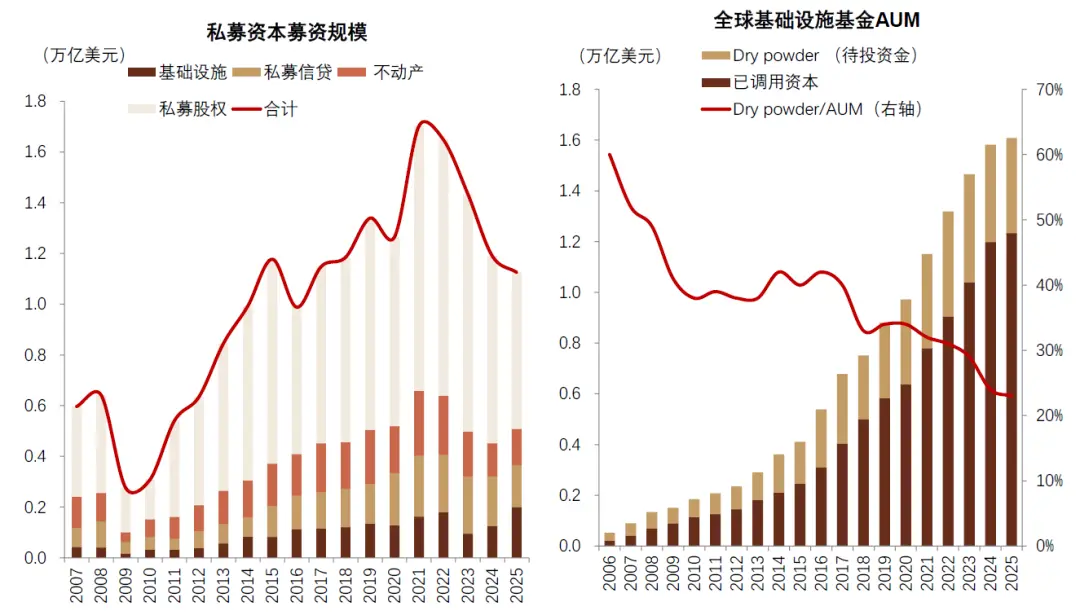
We estimate that private equity (including infrastructure funds, private equity, private credit, and real estate funds) can absorb about $1.1 trillion in funding, accounting for about 30% of external financing needs, second only to investment-grade bonds. The advantage of private equity lies in its structural flexibility, allowing for the combination of equity, preferred stock, mezzanine financing, and project loans to bear construction period and non-standard risks that are difficult to price in the public market. Private equity funds can also establish project JVs or SPVs with cloud providers, introducing equity and debt funding at the project level; under conditions that meet accounting treatment requirements, such arrangements can create off-balance-sheet financing effects, reducing the upfront capital input and consolidation burden for cloud providers while distributing risks to external capital.
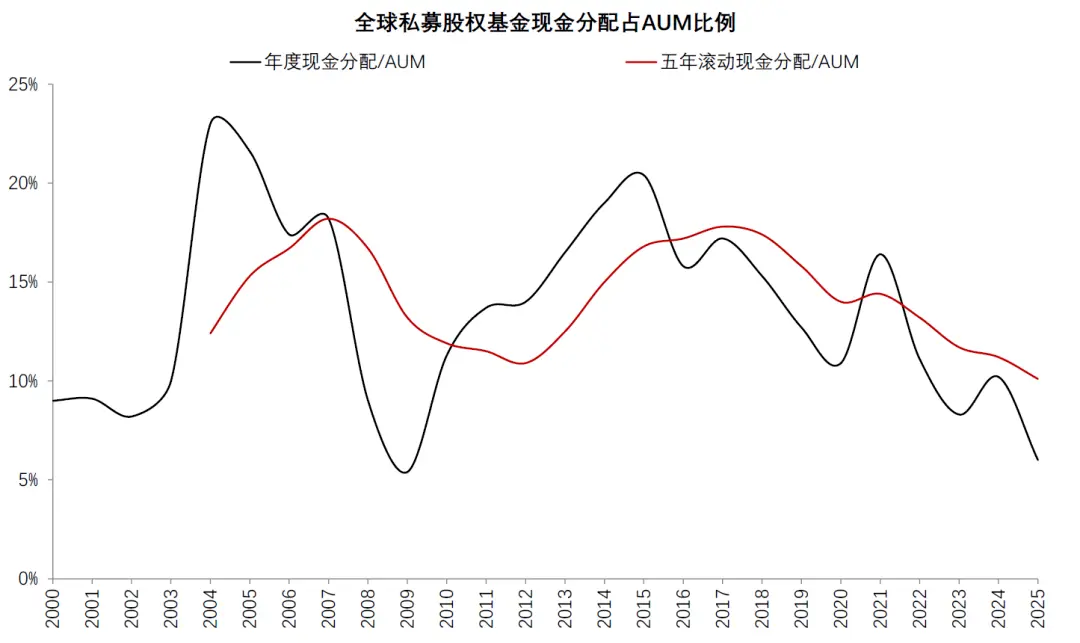
However, there are certain liability constraints on the supply of private equity. According to Preqin and McKinsey data, as of June 2025, the cash distribution ratio of private equity funds to AUM was about 6%, dropping to a near-term low; in 2026, some private credit semi-liquid products also faced increased redemption pressure. Therefore, private equity is expected to become an important incremental source of AI financing, but its actual absorption capacity still depends on fund raising and product liquidity.
【Chart 12】Data center investments have significantly increased
Source: Preqin, Bloomberg, CICC Research Department
【Chart 13】Private equity fundraising has declined, but infrastructure funds are growing rapidly
Source: Preqin, McKinsey, CICC Research Department
【Chart 14】The cash distribution ratio of private equity funds has reached a near-term low
Source: Preqin, McKinsey, CICC Research Department
A Trillion-Dollar Question: How Will AI Debt Be Repaid?
$1 Trillion: How Much Revenue is Needed for AI Financing "Payback"?
In the baseline scenario, we estimate that to meet repayment requirements and shareholder returns, under the assumption of a 10% ROIC, AI applications will ultimately need to generate approximately $1 trillion (in the baseline scenario, $958 billion) in sustainable commercial revenue annually. The calculation comprehensively considers assumptions such as leverage ratios, economic lifespan of infrastructure, and maturity profit margins; we assume that about 70% of the economic value is reflected through application revenue, with the remaining approximately 30% coming from corporate cost savings and efficiency improvements.
Market institutions estimate the long-term revenue required for AI to be between $600 billion and $2 trillion, with significant differences in calculation assumptions, logic, and criteria. Our $1 trillion estimate is positioned in the middle of the market prediction range, but it still implies that AI commercialization needs to achieve a magnitude of expansion in the coming years: assuming this revenue scale is reached by 2030, it means that AI application revenue needs to nearly double each year over the next five years.
【Chart 15】AI financing capital return estimation
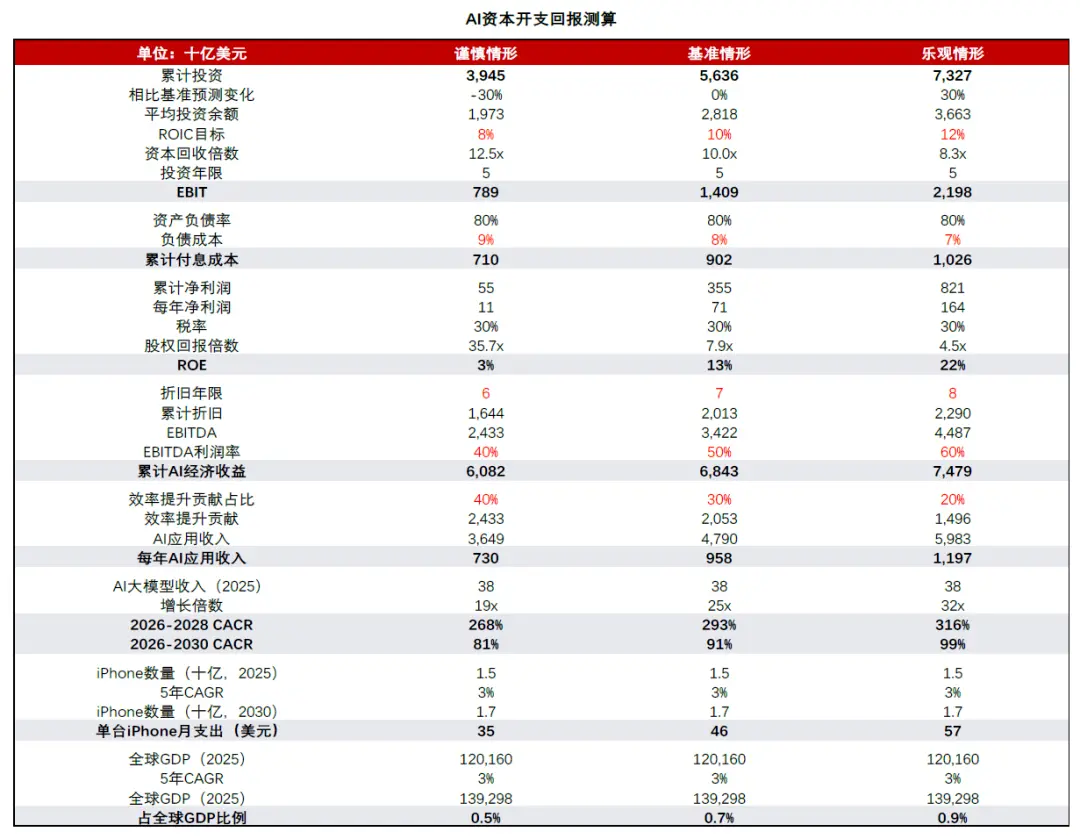
Note: For demonstration calculations only, not representing actual forecasts; the revenue assumption for the AI large model industry is 90% of the total for OpenAI, Anthropic, Zhizhu and Minimax; assuming a project debt-to-equity ratio of 85%; ROIC is the pre-tax capital return rate; profit margins have considered maintenance expenses.
Source: Public company announcements, IMF, Counterpoint Research, CICC Research Department
An annual revenue of $1 trillion is equivalent to 0.7% of global GDP or $46 per month per iPhone, but AI commercialization does not equate to personal payments; its revenue can come from various channels such as corporate spending, advertising, e-commerce, and government procurement. According to Gartner, global SaaS end-user spending is expected to be $300 billion in 2025, and global public cloud service spending is $700 billion. In comparison, $1 trillion in annual AI revenue is approximately 3.2 times the global SaaS market in 2025 and 1.4 times the global public cloud service market. Therefore, from an industry scale perspective, $1 trillion may be a challenging but not unrealistic revenue target, making debt repayment and shareholder returns from AI financing achievable.
Sensitivity Analysis of Key Assumptions
In the above calculations, the assumptions regarding profit margins and depreciation periods have significant uncertainty. We base our baseline scenario on an EBITDA profit margin of about 50% during the maturity period, but whether this level can be achieved currently lacks sufficient financial data support. Major large model companies are still in the investment phase, with some companies experiencing adjusted net loss rates of 300%-500%.
Another key variable is the depreciation period of the infrastructure. Data center buildings and infrastructure can typically be used for over ten years, while chips and electronic devices face faster technological iterations, leading to older equipment potentially facing faster depreciation, shortening the overall depreciation period of data centers.
Therefore, we conduct a sensitivity analysis on these two variables, and the results indicate:
In a scenario with a depreciation period of about 7 years, if the EBITDA profit margin reaches about 30%, it can achieve a capital return rate close to breakeven; if the profit margin is below 20%, even with a longer asset lifespan, it will be difficult to cover capital costs.
Under the assumption of an EBITDA profit margin of about 50%, as long as the depreciation period reaches about 5 years, positive investment returns can be achieved; if the asset lifespan is further extended, the return rate will significantly increase.
Thus, determining whether AI investments can "pay back" cannot be based solely on revenue scale; more importantly, factors such as profit margins and depreciation must be considered. Profit margins below expectations or early depreciation of equipment will significantly raise the required revenue threshold.
【Chart 16】AI investment returns vary significantly under different profit margins and economic lifespans of infrastructure
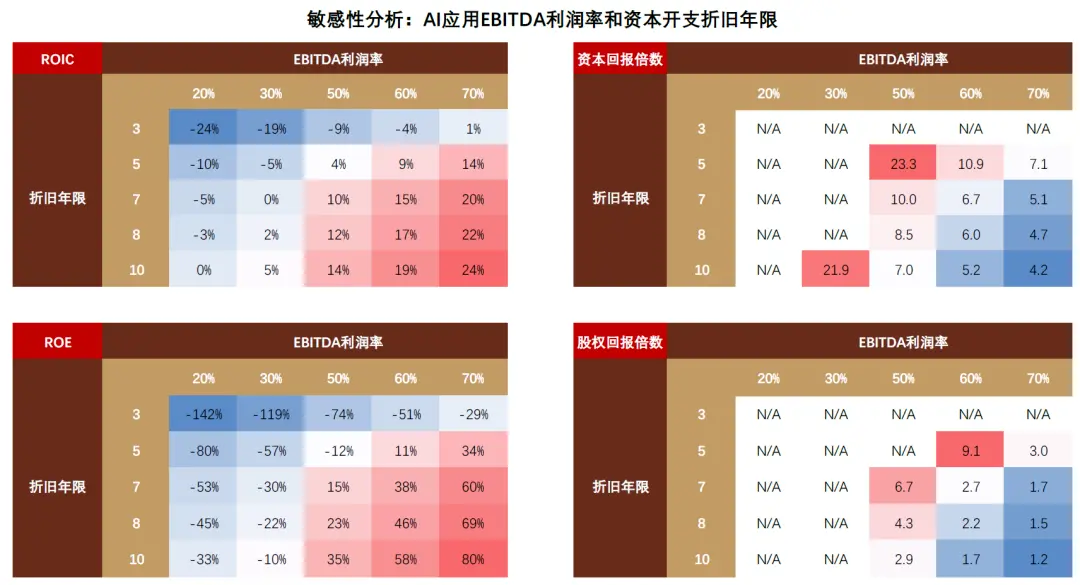
Note: Calculated based on the AI application revenue in the baseline scenario (approximately $1 trillion annually).
Source: CICC Research Department
【Chart 17】Some AI large model companies are still in a high-loss phase
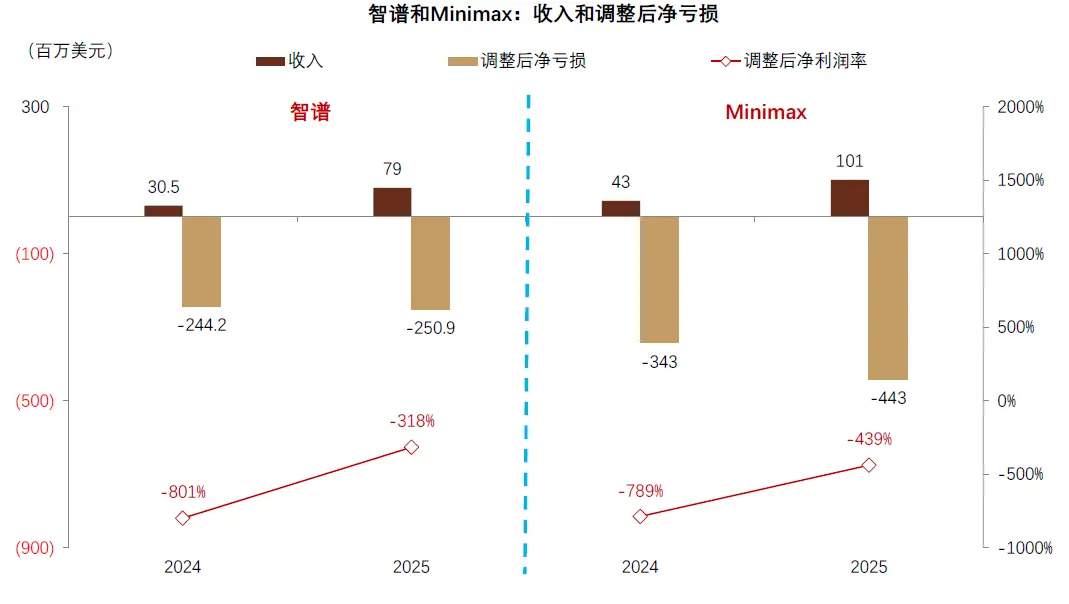
Note: Adjusted net loss is a non-IFRS metric disclosed by the company, mainly excluding share-based payments, fair value or book value changes of pre-IPO financial instruments, and listing expenses.
Source: Public company announcements, Bloomberg, CICC Research Department
Opportunities and Risks for Financial Institutions
AI Investment Drives Bank Balance Sheet Expansion
Data center projects typically require banks to provide loans during the construction phase due to a lack of stable cash flow; after the project is operational and forms leases, long-term bonds, private credit, and other products can be used for replacement. Banks thus play an increasingly important bridging role between the construction phase and capital markets.
Financing for non-bank financial institutions is also driving bank credit expansion. Banks can provide leverage to non-bank institutions through fund subscriptions, NAV loans, and other forms. Private equity bears the long-term risks of underlying projects, while banks provide relatively shorter-term, higher-priority financing. As of June 2026, U.S. banks' loans to non-bank financial institutions increased by about 25% year-on-year, significantly outpacing general loans. This growth reflects the pull of private equity investments on bank loans, with the AI infrastructure sector being a significant target.
【Chart 18】Non-bank loans drive the upward cycle of U.S. credit
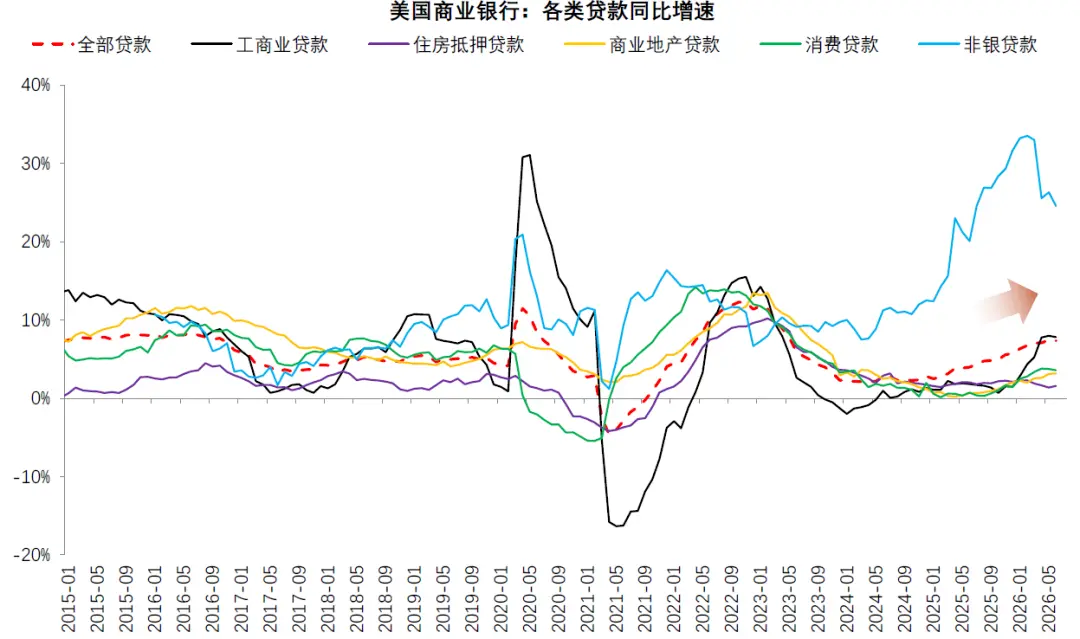
Note: Non-bank loans, commercial loans, and consumer loans have had statistical adjustment impacts removed.
Source: Federal Reserve, Wind, CICC Research Department
AI Financing Brings Capital Market Revenue
The more direct impact of AI financing on banks is reflected in the growth of non-interest income. In Q2 2026, the combined net profit of the six largest U.S. banks grew by 40% year-on-year, with operating revenue increasing by 22%, and non-interest income growing by 32% year-on-year. The increase in corporate IPOs, mergers and acquisitions, and bond issuances driven by AI financing is a significant driver of this revenue growth.
Large integrated banks have stronger capital market service capabilities, allowing them to earn fee income from AI financing while reducing long-term asset-liability balance sheet occupation. In contrast, small and medium-sized banks can achieve higher spreads through project loans but also face higher capital pressures and credit risks.
It is worth noting that bank revenues are often recognized during the financing phase, while credit risks only manifest during the project repayment phase, showing a characteristic of "revenue front-loaded, risk back-loaded."
【Chart 19】This round of U.S. bank performance upcycle is driven by capital market-related revenues
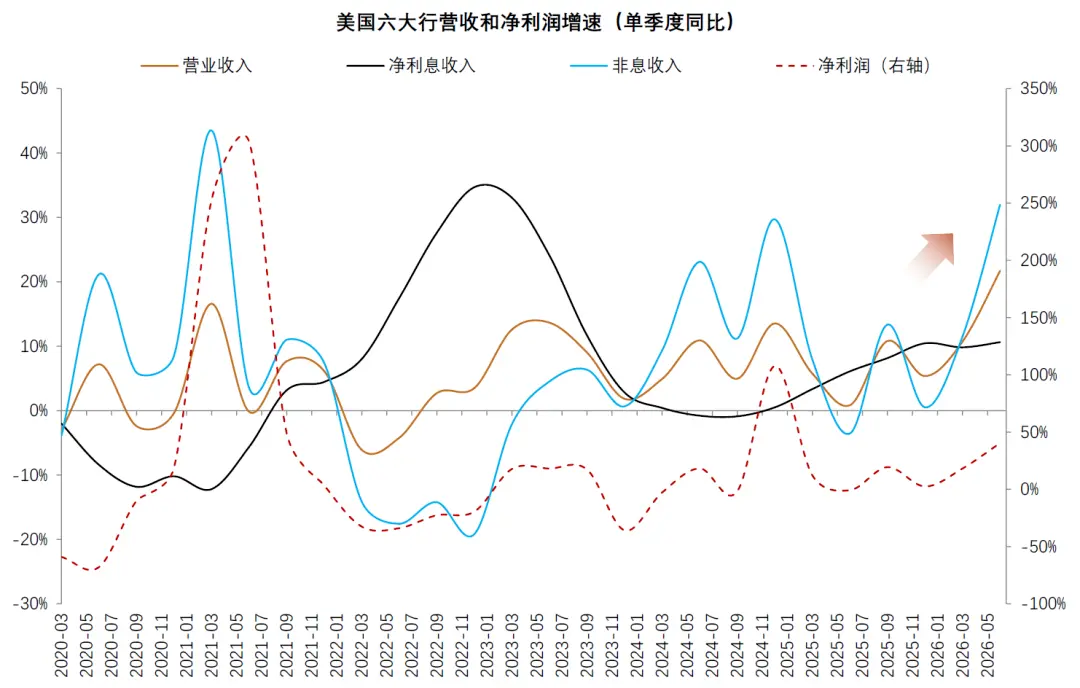
Note: The six largest U.S. banks include JPMorgan Chase, Bank of America, Citigroup, Wells Fargo, Goldman Sachs, and Morgan Stanley.
Source: Public company announcements, Bloomberg, CICC Research Department
From AI Risks to Financial Risks
Can refinancing replace cash flow? Long-term bonds issued by large cloud providers typically have maturities of 10-30 years, and infrastructure funds also usually have investment periods of over 10 years; after data centers are operational, financing can also be replaced with project bonds and securitization. These arrangements can reduce short-term repayment pressure and allow time for AI commercialization. If revenue realization is slower than expected, companies can also extend debt maturities through refinancing. However, refinancing can only buy time and cannot replace cash flow: if project utilization, profit margins, and asset lifespan remain below expectations for an extended period, continuous rolling financing will instead increase leverage and financing costs. We estimate that from 2027, the maturity of bonds from large cloud providers will peak, with an annual maturity scale of about $28 billion, a 60% increase compared to 2024-2026, leading to increased refinancing pressure.
【Chart 20】From 2027, the maturity of bonds from large cloud providers will peak
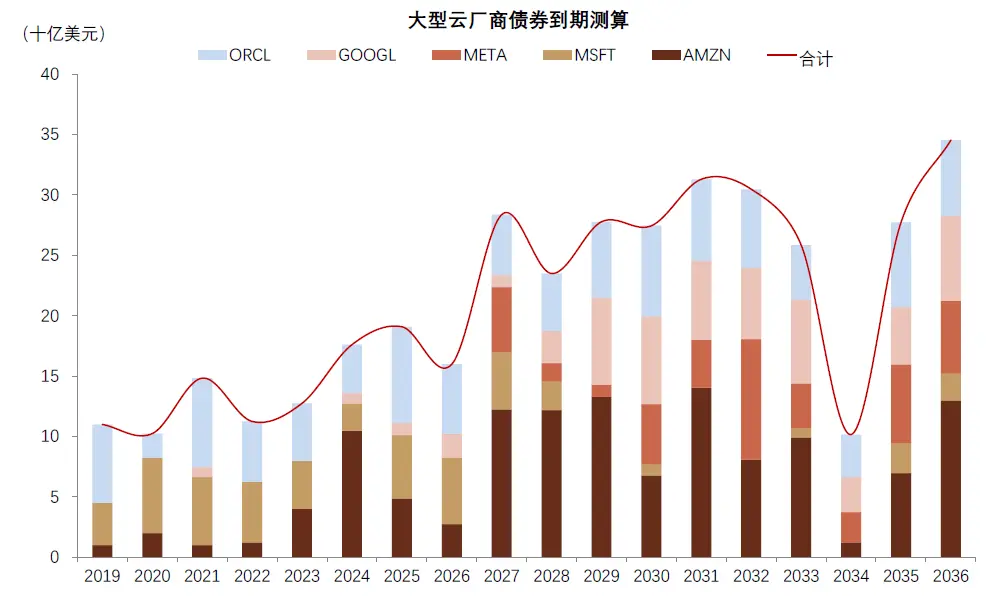
Source: Bloomberg, CICC Research Department
Cloud provider credit is the core risk anchor. Large cloud providers are the main bearers of AI capital expenditure and are also bond issuers, data center tenants, Neocloud customers, and the ultimate counterparties of project SPVs. Their credit status determines whether most cash flows in the industry chain can be sustained. The CDS spreads of cloud providers can serve as high-frequency indicators of credit risk. Since the end of 2025, the CDS spreads of major cloud providers have generally widened, but significant differentiation has emerged between different entities. As of July 2026, the five-year CDS spreads of Microsoft, Amazon, Alphabet, and Meta are roughly still in the range of 45-80 basis points, while Oracle and CoreWeave have spreads exceeding 180 and 600 basis points, respectively, indicating that the market is pricing in risks associated with higher leverage, weaker free cash flow, and greater reliance on refinancing.
【Chart 21】The pricing spread for debt default risk of AI cloud providers is rising
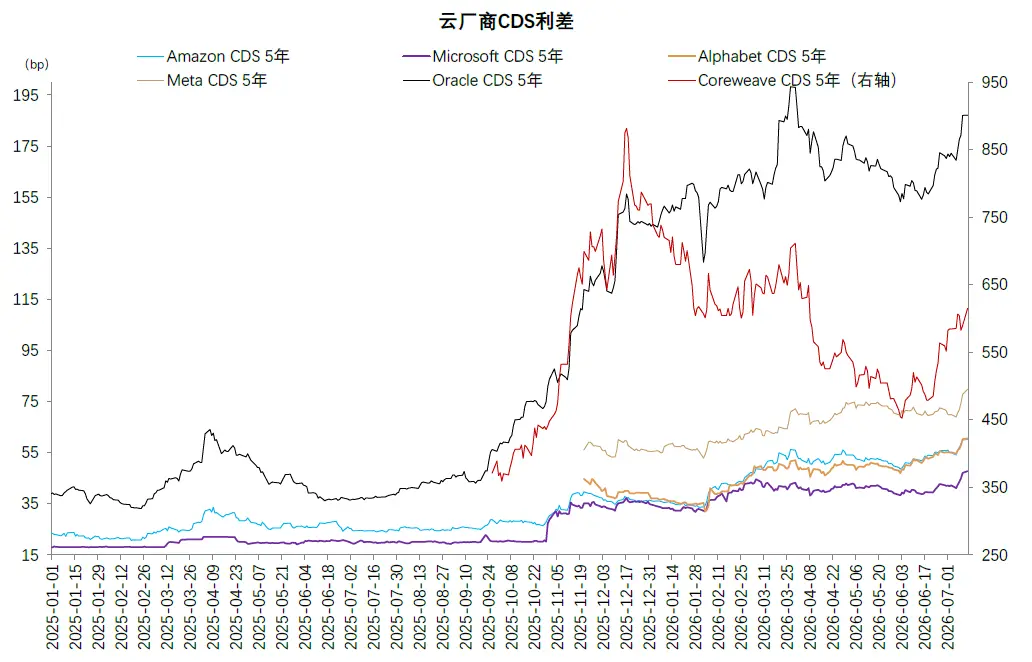
Source: Bloomberg, CICC Research Department
Financial risk transmission pathways. If AI commercialization falls short of expectations, risks will first manifest as declines in data center utilization, revenue, and profit margins, further depressing asset residual values. Losses are typically first borne by the shareholders of cloud providers, Neocloud, and project SPVs, reflecting in stock markets through market capitalization revaluation; if operating cash flows continue to deteriorate and exhaust equity buffers, risks will then further transmit to credit bonds, leveraged financing, securitized products, and private credit. Bank loans typically have higher priority, thus generally positioned at the end of the loss absorption chain.
Is AI a "bubble"? A Perspective from the Financial System
The scale of financing itself does not equate to a bubble; the key lies in whether the new capital can generate sufficiently stable final demand and cash flows. The capital market can address the question of "whether AI infrastructure can be built," but it cannot resolve the question of "whether investments can be recouped." We estimate that related investments ultimately need to support approximately $1 trillion in annual AI application revenue, a goal that is not unattainable but places high demands on capacity utilization, profit margins, and equipment economic lifespan. If commercial growth continues to lag behind capital expenditure, risks will gradually shift from valuation corrections to overcapacity, declining asset residual values, and deteriorating credit quality, transmitted through channels such as rolling financing, private credit, and securitization in the financial system. The scale of financing itself is not the issue; the real test is whether cash flow can be generated before financing costs rise and asset values depreciate.
【Chart 22】The transmission chain of AI financial risks
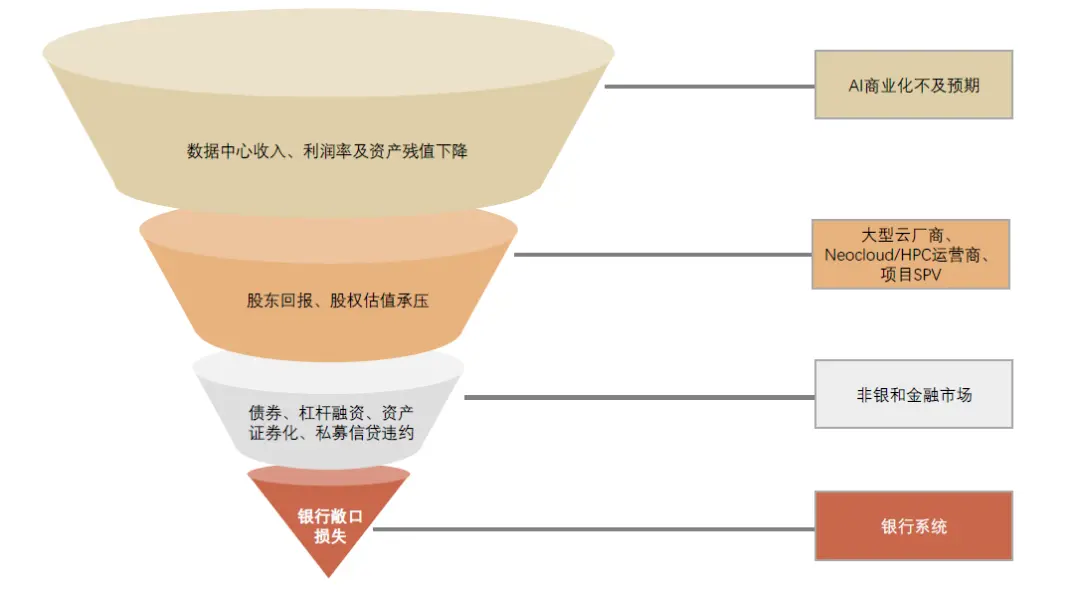
Source: CICC Research Department
Risk Warning
AI commercialization progress is below expectations: If the willingness of enterprises and consumers to pay, application penetration rates, or AI service prices are lower than expected, computing power demand and data center utilization may decline, making it difficult for AI infrastructure to achieve expected investment returns.
AI capital expenditure and financing demand are below expectations: If large cloud providers cut capital expenditure due to free cash flow pressures or changes in demand, the actual financing scale may be lower than estimated in this report.
Capital market financing conditions tighten: Rising interest rates, widening credit spreads, or stock market volatility may lead to a slowdown in bond, equity, and securitization issuances, increasing refinancing pressure on Neocloud and project SPVs.
[1] Large cloud providers (Hyperscalers) include Microsoft, Amazon, Google, Meta, and Oracle, as mentioned.
[2] Assuming that 70% of this is AI-related capital expenditure.
[3] Unless otherwise mentioned, this report uses Bloomberg consensus expectations for publicly listed company forecast data.
Source
This article is excerpted from "The Financial Moment of AI ------ AI Financing Tracking (1)" published on July 23, 2026.
Lin Yingqi, Analyst, Banking + SAC License No.: S0080521090006 SFC CE Ref: BGP853
Che Shuyun, Analyst, Telecom Software Education SAC License No.: S0080523050005 SFC CE Ref: BTM272
Li Peifeng, Analyst, Global Research SAC License No.: S0080521070004 SFC CE Ref: BTO526
Xu Hongming, Analyst, Banking + SAC License No.: S0080523080007 SFC CE Ref: BUX153
Zhang Jingya, Contact, Banking + SAC License No.: S0080126050022
Zhang Shuai, Analyst, Banking + SAC License No.: S0080516060001 SFC CE Ref: BHQ055
 Risk warning