Tokenized assets enter the second half: the number of products is no longer king, liquidity determines victory
 Core Viewpoint

 The top three issuers in the tokenized asset market account for 72%, with trading volume concentrated in a few venues such as Binance, and competition is shifting from the number of products to real liquidity and repeat trading.
Author: Heechang Kang
I believe that 2027 will be a decisive year for tokenized assets, and signals have already appeared in this year's data. Currently, thousands of stocks, commodities, private companies, and index products are on-chain, but trading volume is concentrated in a few venues.

RootData shows that the competition is no longer about who can issue the most products, but rather who can truly complete distribution and execution. The winning companies will be those that can convert a wide product catalog into concentrated liquidity, repeat trades, and a continuous influx of users.
Let’s walk through the chain from issuers to trading venues to the assets themselves and see where the market currently stands.
Main Source: RootData Tokenized Asset Dashboard. The analysis uses indicators such as trading volume, open interest, market share, spreads, depth, and asset coverage. Issuer comparisons use supplementary public data; the extended comparison of centralized and on-chain venues uses CoinMarketCap Research's dataset of 19 venues for RWA perpetual contracts.
1. Issuers: The Top Three Hold 72%

Source: rwa.xyz
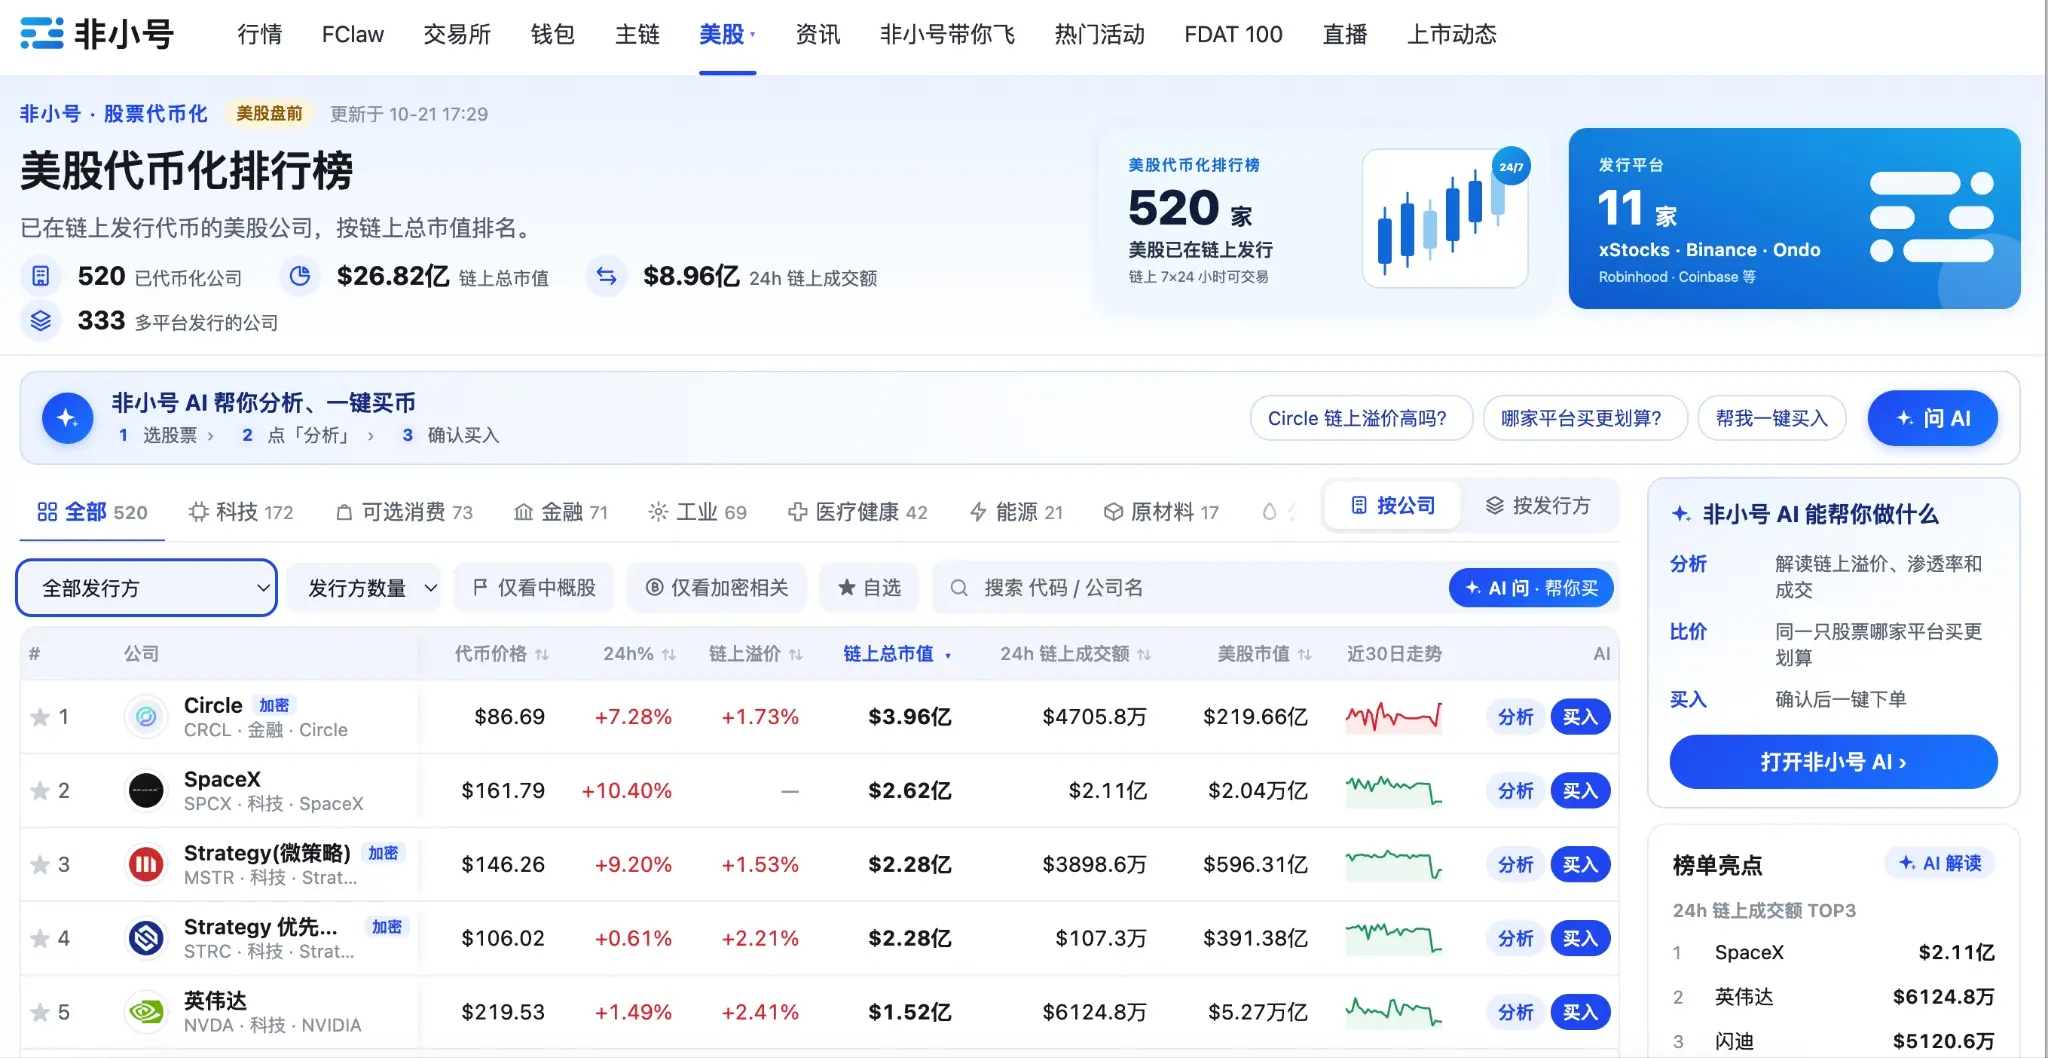
The current circulating value of tokenized stocks is $2.91 billion, held by 3.17 million holders. Here, circulating value refers to the market value of tokens that can leave the issuance platform and be transferred between wallets (definition found here). Over the past thirty days, this value has grown by 7.43%, while the number of holders has increased by 174.29%, indicating that the expansion of the crowd is far outpacing the underlying capital.
Currently, the average holder possesses about $918. This does not appear to be institutional allocation but rather a wave of small wallets trying the product for the first time. The monthly transfer volume is $13.31 billion, approximately 4.6 times the circulating value; however, it has decreased by 52.65% during the same period, while new holders continue to flood in. The speed of access expansion is far outpacing the formation of usage habits. The next number to watch is: how many of these holders will return for a second and third trade.
Ondo, bStocks, and xStocks together control about 72% of the reported tokenized stock value. This gives the three companies real influence over custody, redemption, network selection, and the ultimate accumulation of liquidity.
For other competitors, rather than issuing hundreds of tokens that hardly trade, it is better to create a smaller product range with clear legal rights, capable of redeeming during tough times, and with ledger depth sufficient to absorb real orders, thus establishing a more solid business.
2. Trading Venues: Binance Leads, Hyperliquid Anchors On-Chain Liquidity

Source: Coinmarketcap, Rootdata
The cumulative trading volume of RWA perpetual contracts in 2026 is concentrated in a few venues: Binance processed $1.59 trillion, Hyperliquid HIP-3 $542.8 billion, OKX $345.1 billion, and Bitget $238.2 billion. This accounts for approximately 86% of the $3.16 trillion market. Hyperliquid is the only on-chain venue in this group, accounting for 17.2% of total trading volume.
Throughout this year, the balance between the two sides has also changed. With the rise of stock perpetual contracts, traders have flowed back to centralized order books. The market share of on-chain venues has dropped from about 45% in December to 13% in August, while Binance's monthly share has climbed to 54.1%.
When these numbers are compared with the number of listings, the mismatch becomes evident. Gate operates the widest product shelf in the market, with 405 trading codes, but only cleared $148.5 billion, about 4.7% of the trading volume; while Binance cleared $1.59 trillion with just 179 trading codes. Bitget's 302 listings brought in $238.2 billion, Bybit's 224 brought in $105.2 billion, OKX's 168 brought in $345.1 billion, and Hyperliquid's 161 brought in $542.8 billion.
3. Assets: Trading Volume Follows Scarce Access Assets

Source: Rootdata
Looking at what people are actually trading, a consistent pattern emerges: around semiconductors, leveraged tech products, crypto-sensitive stocks, commodities, and private companies. SanDisk, SOXL ETF, SK Hynix, Micron, and SpaceX top the expanded snapshot.
An earlier Binance snapshot from RootData shows that the daily trading volume for gold is $1.79 billion, SK Hynix $1.61 billion, and SpaceX $1.17 billion. Each meets different needs: gold provides continuous macro exposure, SK Hynix is the cleanest way to trade the AI memory cycle around the clock, while SpaceX opens a door that most investors cannot access through traditional channels.
The clearest signal in the data is that when the tokenized market solves an access issue or opens a trading window that previously did not exist, it gains traction. For example, SK Hynix could only be traded in the Korean market before being listed in the U.S. through ADR. Replicating highly liquid U.S. stocks has little effect because traditional brokers have already met this demand in a low-cost and high-quality manner.
This points to the best opportunities in private companies, Asian stocks, commodities, and thematic baskets, where access gaps are real. The structure remains worth noting, as perpetual contracts, synthetic tokens, and legally supported stock tokens confer very different rights to holders.
The standout leaders will combine access that others cannot provide with credible legal claims and liquidity deep enough to be trusted.
4. Next Steps
Overall, the data from issuers, trading venues, and assets indicates that the competition in the tokenized asset market is shifting from expanding product catalogs to demonstrating real usage and liquidity.
Therefore, when assessing issuer performance, it should be based on metrics such as the number of repeat trading holders, redemption activity, and transfer volume per holder, rather than the cumulative number of issued assets. These metrics reveal whether users are merely trying the product once or continuing to hold and trade it, thus painting a clearer picture of the underlying business and its growth sustainability.
Similarly, in terms of assets, those that are difficult to trade in traditional financial markets or are limited by time and geography—such as private companies, Asian stocks, commodities, and thematic products—provide investors with clear reasons to utilize the crypto market. Assets that can already be easily and cheaply obtained through traditional brokers are unlikely to attract sufficient on-chain demand merely by replication.
This year, the industry has expanded the potential of tokenized assets by bringing a wide range of products to market. The coming year will reveal which products and platforms can generate repeat trades and sustainable liquidity. Companies that combine hard-to-access asset entry with credible legal rights, reliable operational structures, and sufficient liquidity to absorb real orders will lead market growth.
 Risk warning Risk warning