Ten-year U.S. Treasury yields have surpassed 5%. What has happened to the U.S. stock market in similar historical situations?

 Looking at history, every time the 10-year U.S. Treasury yield falls below 5%, the "dormant period" shows polarization: either it recovers in a short time of 5 to 10 months (about 110 to 220 trading days), or it sinks for over 1,000 trading days. The former is merely a daily fluctuation of interest rates, while the latter signifies the formation of an entire low interest rate environment.
Last night (September 14, Monday), the yield on the 10-year U.S. Treasury bond briefly surged to 5.014%, marking the first time it has reached this integer level since 2023; although it closed back down to around 4.947%, the pattern that had persisted below 5% for nearly three years since October 2023 was broken for the first time. Historically, every time the 10-year Treasury yield falls below 5%, the subsequent "dormancy period" has shown polarization: either it recovers within a short period of 5 to 10 months (about 110 to 220 trading days), or it sinks for over 1,000 trading days. The former is merely a routine fluctuation in rates, while the latter signifies the formation of an entire low-rate environment. Last night's breakthrough came after more than seven hundred trading days of dormancy below 5%—it measures not how much rates have fluctuated, but rather a paradigm shift in the market's overall perception of the rate center. So, how did the U.S. stock market perform after similar historical occurrences?
1. What Happened in the Market Last Night
A key feature of this breakthrough is that long-term yields are rising faster than short-term yields. Last night, the 30-year yield touched 5.38% during trading and closed at 5.328%; the 2-year yield, on the other hand, slightly fell to 4.628%. This is a typical "bear steepening" pattern, indicating that the market is pricing in not short-term policy rates, but rather longer-term inflation and supply risks. At the beginning of the year, the 10-year Treasury yield was only 4.15%, and it has risen by about 85 basis points this year.
The catalyst was a combination of several clues. On the energy front, Saudi Arabia's east-west oil pipeline was shut down due to an attack, threatening about 4% of global oil supply, with Brent crude briefly surpassing $109 per barrel; on the inflation front, the core inflation rate in August remained high at 3.4%, far from the Federal Reserve's 2% target; on the policy front, the European Central Bank raised interest rates last week, the Bank of Japan is expected to follow suit this Friday, and with the Federal Reserve's meeting on September 16 approaching, the CME FedWatch shows that the probability of a rate hike has exceeded 90%, with the current federal funds target range at 3.50% to 3.75%. Notably, the Treasury has doubled the bond repurchase scale from $3 billion to $6 billion, yet it has still failed to suppress yields—this indicates that selling pressure comes from fundamental pricing rather than liquidity.
2. Historical Reappearance: How Many Times Has the 5% Breakthrough Occurred After Long Dormancy?
Around the internet bubble (late 2001 to early 2002) and just before the subprime mortgage crisis (mid-2007), the 10-year Treasury yield also climbed back above 5%, but those instances only spent 1 to 10 months below 5%, not qualifying as "long-term dormancy." The only comparable situations to last night in history occurred four times.
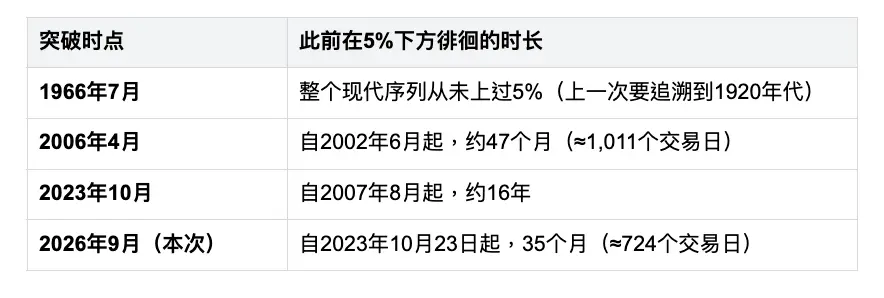
3. Review: How Did the S&P 500 Perform After the Previous Three Long Dormancy Breakthroughs Above 5%?
Sample One: July 1966—Essentially Flat Six Months Later
This was the first time in modern history that the 10-year Treasury yield rose above 5%. The monthly average yield rose to 5.02% in July 1966 and further to 5.22% in August, with the last occurrence dating back to the 1920s. It is worth noting that the S&P 500 had already peaked at 94.06 on February 9 of that year and had fallen about 9% by the time the breakthrough occurred in July— the impact of rising rates had already been priced in before the breakthrough. After the breakthrough, the market fell for about two and a half months, bottoming out at 73.20 on October 7, a cumulative decline of 22.18% from the February peak, constituting the smallest bear market since 1950, known as the "Baby Bear." However, the rebound after the bottom was rapid: it rose back to 80.99 in November, returned to 84.45 in January 1967, and had fully recovered the February peak by May 4, taking only seven months from the breakthrough point. Starting from the July breakthrough point, six months later, the S&P 500 fell from 85.84 to 84.45, a slight decline of 1.6%, essentially flat.
Sample Two: April 2006—Moderate Increase
The rise in the 10-year Treasury yield in 2006 occurred against a backdrop of an overheating economy. The monthly average yield rose to 4.99% in April 2006, 5.11% in May, breaking above 5% for the first time since 2002, and peaked at around 5.25% in June. The S&P 500 rose from 1,302.17 in April to 1,363.38 in October, a 4.7% increase over six months; if calculated from May, it rose from 1,290.01 to 1,388.64 in November, a 7.6% increase. The process also had its ups and downs. From May to mid-June 2006, the S&P experienced a rapid pullback of about 7-8%, but after the yield peaked and fell, it regained upward momentum and reached a historical high in the autumn.
Sample Three: October 2023—Significant Increase
The market sentiment during the last breakthrough was closest to today. From October 19 to 23, 2023, the 10-year yield broke above 5%, peaking at 5.02%, the highest since July 2007. At that time, the market was extremely pessimistic, and the S&P 500 continued to decline after the breakthrough, bottoming out at 4,117 points on October 27, about a 4% drop from October 19. However, that decline laid the groundwork for the subsequent rebound. The S&P 500 then embarked on a sharp upward trend, rising from 4,258.98 in October 2023 to 5,095.46 in April 2024, with a six-month increase of 19.6%.
4. Learning from History: What Common Impact Does Rising U.S. Treasury Yields Have on the U.S. Stock Market?
Looking at the three instances together, the results six months later were -1.6%, +4.7%, and +19.6%, respectively. The worst instance merely returned to the starting point, with no sustained deep declines occurring. However, what is more valuable is not this range, but the differences behind it.
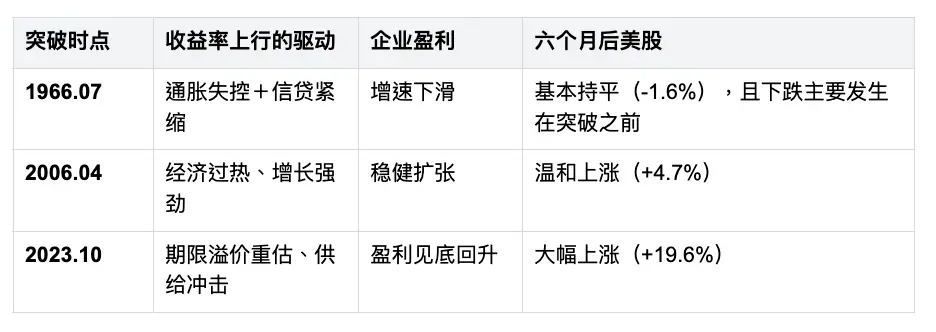
The level of interest rates itself does not determine the direction of the stock market: all three instances involved the same "breaking 5%" action, yet the outcomes differed by 20 percentage points. What truly distinguishes strength from weakness is the "story" behind the rise in yields: in 2006 and 2023, the rise in yields was accompanied by nominal growth and profit expansion, which the stock market could digest; in 1966, the rise in yields was accompanied by credit contraction and profit decline, which the stock market could not digest, so it could only "remain flat" rather than rise. In other words, rate hikes themselves are not a bearish logic; it is the interruption of growth by rate hikes that is.
The market often prices in advance: the decline in 1966 occurred before the breakthrough, while the bottom in 2023 appeared on the sixth trading day after the breakthrough. By the time the integer threshold is widely reported by the media, the most panicked phase has usually passed.
After six months, the overall U.S. stock market remains stable, but it will also experience initial declines: in the weeks to over two months following the three breakthroughs, the stock market mostly experienced a pullback—about -15% to the bottom in 1966, about -8% from May to June 2006, and about -4% in October 2023. The real turning points almost always occurred after yields peaked and fell, rather than on the day of the breakthrough.
5. What Is Different This Time? Three Key Variables to Watch Closely
First, is inflation a one-time shock driven by supply? The direct trigger for this round of increases is the situation in the Middle East and oil prices, with Brent already exceeding $109. If geopolitical tensions ease and oil prices fall, it will be closer to the 2023 scenario; if energy prices remain high and transmit to core inflation, it will lean towards the 1966 scenario.
Second, will central banks sacrifice growth for inflation? The biggest difference this time is that major global central banks are tightening synchronously—the Federal Reserve, European Central Bank, and Bank of Japan are almost simultaneously shifting, unlike the unilateral tightening expectations of 2023. Synchronous tightening has a stronger effect on the withdrawal of global liquidity, which is precisely a characteristic of the 1966 scenario.
Third, are corporate profits still expanding? This is the most explanatory variable among all samples. As long as the upward trend in profits is not interrupted, high interest rates will manifest more as valuation compression rather than a trend reversal.
Disclaimer: The content of this article is for investor education and market information reference only and does not constitute any investment advice or recommendations for specific securities or financial products. The historical statistical comparable sample size is limited (only 3 cases), and past performance does not represent future returns and does not have a necessary repeatability. The market has risks, and investments should be made cautiously; investors should independently assess their risk tolerance and bear the risks themselves.
Data Source: Public market reports (Bloomberg, Yahoo Finance, UPI, Semafor, etc.); historical series from the Robert Shiller database (S&P 500 monthly prices, 10-year Treasury monthly yields); trading days are calculated values after excluding weekends and U.S. stock market holidays.
 Risk warning



Popular articles