Oracle delivered better-than-expected financial results, why did it open up 7.5% but close down? Its suppliers are driving the increase
 AI has shifted the valuation anchor of software companies from "revenue growth" to "capital efficiency," while pushing value to both ends of the industry chain: one end is the infrastructure layer that truly absorbs capital expenditure, and the other end is the workflow layer that cannot be replaced after the model. The portion in the middle, which relies solely on the number of seats and subscription price growth, is seeing its bargaining power weakened.
Last Friday, September 11, the first trading day after Oracle announced its latest financial report, its stock price gapped up 7.5% to $164.43, reaching a high of $165.99 during the day. Almost at the same time, its supply chain collectively took off: HPE rose 12.44%, Dell rose 11.98%, both leading the S&P 500 index; AMD rose 7.28%, Arista rose 5.61%, ON Semiconductor rose 8.51%, and Viavi rose 3.60%, with server hardware becoming the strongest segment of the day.
However, Oracle, which ignited all of this, could not maintain its momentum: the stock price fell back from its intraday high, closing at $150.28, down 1.74% for the day, with an intraday fluctuation of over 10%. Similarly, AI cloud service providers CoreWeave and Nebius, which also require significant capital expenditures, saw their stocks rise about 4% during the day but closed in the red, following a nearly identical intraday curve as Oracle.
1. $90 Billion in Huge Capital Expenditures Guarantees Certainty of Supply Chain Revenue
The first quarter financial report for fiscal year 2027, released after the market closed on September 10, was quite solid, with growth almost entirely coming from cloud business. Revenue for the quarter was $19.345 billion, a year-on-year increase of 30%, exceeding the expected $19.14 billion; adjusted earnings per share were $1.92, higher than the expected $1.74. Cloud business revenue was $11.6 billion, a year-on-year increase of 62%, accounting for about 60% of total revenue, with cloud infrastructure (OCI) revenue at $7.4 billion, a year-on-year increase of 121%, while traditional on-premises software revenue declined by 3%. The delivery side was equally impressive: 850 megawatts of new data center capacity were added during the quarter, over 300,000 GPUs were delivered, and infrastructure utilization reached 97.9%, with expiring GPU contracts renewing or reselling at an average price about 20% higher than the original contracts. The full-year guidance is for revenue of at least $90 billion and adjusted earnings per share of $8.1.
But what truly ignited the supply chain was a capital expenditure guidance mentioned during the earnings call. The earnings call was held at 5 PM Eastern Time on September 10, and the CFO stated: "Full-year capital expenditures are still expected to be between $90 billion and $95 billion, with net cash capital expenditures not exceeding $70 billion." ------ This $90 billion to $95 billion in real cash will ultimately turn into racks, switches, liquid cooling systems, and power equipment. This money appears as costs on Oracle's balance sheet but as revenue on the suppliers' balance sheets, and the market immediately provided an answer:
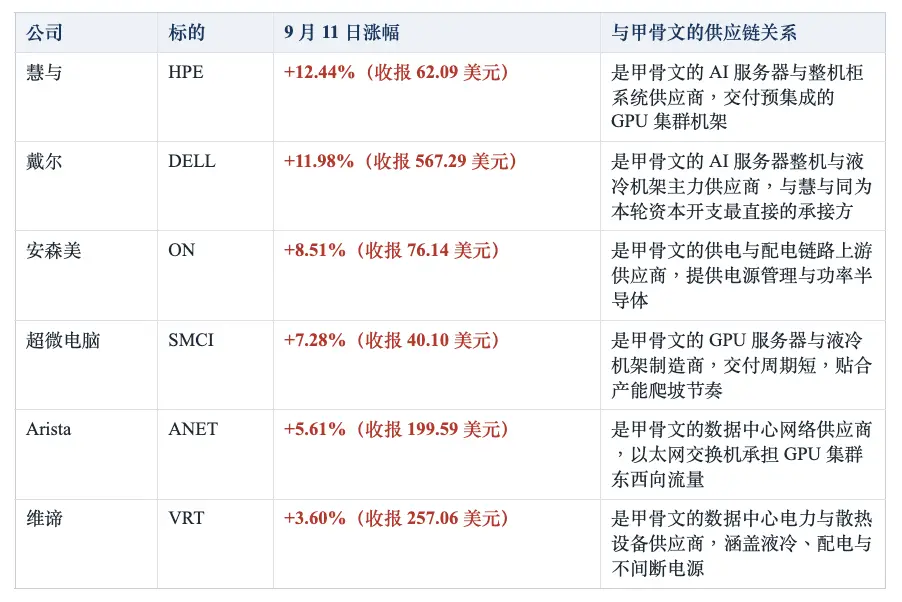
Note: The increase and closing prices are based on the closing price on September 11, 2026. The last entry summarizes the roles in the industry chain according to the public business scope; Oracle did not disclose the list of suppliers, and individual companies may not have confirmed direct supply relationships with Oracle.
2. Why Did Oracle's Stock Price Rise Then Fall? RPO, Free Cash Flow, and Ellison's Share Reduction
Since the financial report exceeded expectations across the board, why did it close down after opening up 7.5%? The answer lies not in the bright numbers at the top of the profit and loss statement but in the details of the later tables and a 10b5-1 document that was exposed alongside the financial report and then retracted over the weekend.
Remaining Performance Obligations (RPO) are the most enticing and easily misread "IOUs": $664 billion in remaining performance obligations refers to the amount of signed contracts that have not yet been recognized as revenue, an increase of $209 billion year-on-year, with new AI cloud contracts exceeding $30 billion in a single quarter. This figure has three layers of meaning that need to be viewed separately: it is a cap on revenue rather than revenue itself, the timing of conversion depends on when capacity is delivered; it does not include any cost information, and there is no direct conversion relationship between order size and shareholder returns; its quality depends on counterparties and terms, and the market generally estimates that nearly half of this $664 billion points to the same customer. In other words, the larger the order, the higher the requirements for delivery capability and customer concentration ------ it is a check that will take several years to cash.
The improvement in free cash flow partly comes from the "embellished" book prosperity from customer prepayments: free cash flow for the first quarter of fiscal year 2027 was negative $5.4 billion, although it was significantly better than the market expectation of negative $9.56 billion, a closer look at the composition of operating cash flow reveals that $11.36 billion came from customer prepayments. Although this money has been received, it is essentially a liability corresponding to future services to be delivered, rather than profits already earned. Accompanying this are arrangements where customers bring some hardware and suppliers participate in financing ------ they do indeed partially transfer the financing pressure, with net cash outflow after deducting these factors at about $18 billion, lower than the $28.5 billion in reported capital expenditures; but this also means that how much cash these rapidly growing AI orders can ultimately leave for shareholders remains an unanswered question.
The 82-year-old chairman's sudden "change of heart" led to a weekend dark market rise of about 2%: Alongside the latest quarterly report on September 10 was a share reduction plan from the company's executive chairman and chief technology officer, 82-year-old Larry Ellison: he had established a 10b5-1 trading plan as early as June 22, allowing for the sale of up to 50 million shares of Oracle stock. In a financial report with negative free cash flow, record capital expenditures, and just completing a $20 billion issuance, combined with the information that "the founder is preparing to reduce his holdings by $7.5 billion," the market's negative interpretation is not hard to imagine.
The turning point occurred over the weekend. On September 12, Oracle's investor relations website released a statement titled "Larry Ellison Cancels His Plan to Sell Oracle Stock," stating: "Larry Ellison, Executive Chairman of the Board and Chief Technology Officer, has canceled his 10b5-1 plan to sell Oracle stock. No Oracle stock was sold under this plan, and he has no other plans to sell any Oracle stock he holds." There was only one day between the exposure and the cancellation. During the weekend's dark market trading period following the announcement, the stock price rose over 2%.
3. Is a 19x Price-to-Earnings Ratio Expensive? PE and EV/EBITDA Analysis
According to Oracle's guidance for fiscal year 2027 ------ revenue of at least $90 billion and adjusted earnings per share of $8.1 ------ the current stock price corresponds to a forward price-to-earnings ratio of about 19 times. If the earnings per share can maintain a growth rate of over 30% thereafter, the multiple will drop to about 14 times in a year and about 11 times in two years; while the market consensus expectation for the next fiscal year's earnings per share is about $10.97, corresponding to about 13.7 times, which is basically consistent with this calculation. This is also why Oracle's PEG is only 0.58, the lowest among its peers: when removing the price-to-earnings ratio for growth rate, it is indeed the cheapest among this group of companies. For a company with cloud infrastructure revenue growing 121% year-on-year and remaining performance obligations increasing by $209 billion in a year, maintaining such a growth rate is not out of reach.
However, the numerator of the price-to-earnings ratio is market capitalization, which does not include debt. Oracle's net debt has reached $132.1 billion, with an enterprise value of $586.5 billion, about 29% higher than the market capitalization of $454.4 billion. When using EV/EBITDA that accounts for debt, Oracle is about 17.0 times, Amazon is about 17.2 times, and Microsoft is about 19.2 times ------ the same set of assets, but with a different numerator, "cheap" becomes much less so. For a company that relies on issuing bonds and increasing shares to expand, ignoring debt in valuation metrics naturally underestimates its true price.
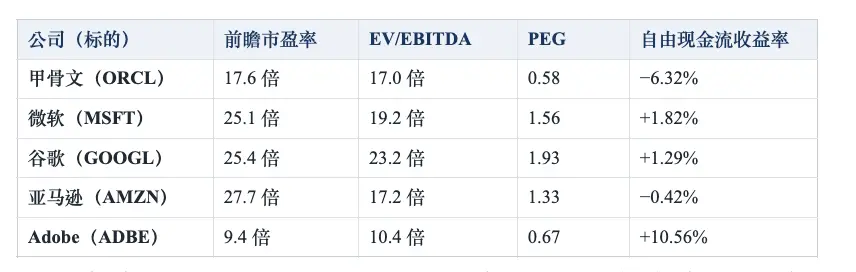
Note: Forward price-to-earnings ratio, EV/EBITDA, and PEG are based on publicly available market data as of September 12, 2026; free cash flow yield is based on the most recent twelve months. Oracle's forward price-to-earnings ratio is calculated based on market consensus expectations, which is about 18.6 times based on the company's guidance of $8.1.
In terms of EV/EBITDA, Oracle's 17.0 times is lower than Microsoft's 19.2 times and Google's 23.2 times, roughly on par with Amazon's 17.2 times, placing it in the lowest tier among this group of companies. Considering its growth rate is far higher than its peers, this position is even somewhat low ------ according to market expectations for fiscal year 2027, its EBITDA is expected to rise from about $36.5 billion in the previous fiscal year to about $52.4 billion, and based on static calculations, the forward EV/EBITDA will quickly drop to just over 11 times.
However, to determine whether the valuation is inflated, one must also look at what EBITDA excludes. The $28.5 billion in capital expenditures for Oracle this quarter will mostly turn into GPU and data center assets, which will continue to depreciate over the next few years; interest expenses for the quarter have also risen from $923 million to $1.428 billion, with a growth rate exceeding 50%. For a company that is becoming asset-heavy and expanding through debt issuance, adding back depreciation and excluding interest effectively removes the two heaviest burdens from view. More critically, both sides of the ratio are moving: the growth of the denominator EBITDA comes from expectations, while the growth of net debt in the numerator comes from the signed capital expenditure plans ------ the market expects its net debt to rise above $160 billion by fiscal year 2028. Even if EBITDA is realized as expected, the decline in forward multiples will be slower than static calculations.
4. Has the Allocation Logic of Software Stocks Changed in the AI Era? Valuation Changes from Oracle and Adobe
September 11 also left behind a phenomenon that is easily overlooked: all the leading stocks were hardware, while the software sector was almost entirely absent. The top-performing sub-industry that day was printed circuit boards and computer wholesale, while Adobe fell, and Cloudflare and Rubrik also closed down. The software company Adobe, which announced its latest financial report on the same day as Oracle, constituted an almost completely opposite sample: third-quarter revenue was $6.76 billion, a year-on-year increase of 13%, with AI-related annual recurring revenue growing over 150%, and platform user scale exceeding 1 billion ------ yet the stock price fell due to the next quarter's guidance not exceeding expectations. The contradiction is quite straightforward: AI revenue is growing at triple-digit rates, user scale is expanding in the billions, yet the company's overall growth rate remains at 13%.
AI has shifted the valuation anchor of software companies from "revenue growth" to "capital efficiency," while pushing value to both ends of the industry chain: one end is the infrastructure layer that truly absorbs capital expenditure, and the other end is the workflow layer that cannot be replaced after the model, while the part in the middle, which relies solely on the number of seats and subscription prices for growth, is seeing its bargaining power weakened.
Oracle and Adobe are perfect samples of these two paths. Oracle has chosen to transform itself into an infrastructure company, with the chain being "orders---capacity---cash." It does not lack demand but lacks proof of converting that demand into free cash flow per share, at the cost of negative free cash flow, rising debt, and ongoing dilution. Adobe has chosen to remain at the software layer, with the chain being "free users---usage habits---willingness to pay." It does not require huge capital expenditures, and its cash flow has always been healthy, but it lacks proof of converting users into revenue. The market's attitude towards the two is therefore opposite: for Oracle, there is belief that demand can be realized; for Adobe, there is growth but skepticism about its sustainability. If AI models ultimately become an increasingly cheap foundational capability, the deciding factor may not be the model itself, but the entire layer of modifications, collaboration, material management, and delivery that occurs after generation—much of which still takes place within Adobe's own software.
For Oracle, the following sets of data take precedence over the total order amount itself: whether capacity utilization can continue to remain high after adding hundreds of megawatts of capacity; if it declines with expansion, it indicates that the pace of expansion has exceeded the speed of demand realization; the proportion of customer prepayments to operating cash flow, as well as the proportion of new contracts that adopt prepayments or customer-provided hardware structures, with an increase indicating that risk sharing is being strengthened; when the ratio of capital expenditure to revenue peaks, this is the most direct leading indicator of free cash flow turning positive; the speed of narrowing the free cash flow gap in a single quarter, and whether management begins to provide guidance on turning positive; the pace of equity dilution and the growth rate of interest expenses, whether it is faster than the growth rate of operating profit; whether the customer concentration of orders declines with new contracts, and whether more detailed delivery and cash flow paths are provided on the investor day in October.
Disclaimer|This article is for reference only and does not constitute any investment advice or product offer. Data is as of September 13, 2026 (Eastern Time), sourced from public information, and the company does not guarantee its accuracy or completeness. The article contains forward-looking statements, and actual results may differ significantly. Investment involves risks, prices can rise or fall, past performance does not represent future performance, and investors may lose all principal. Product availability is subject to local laws and regulatory restrictions. Please evaluate independently and consult independent professional advice.
 Risk warning


Popular articles