Pantera Capital Tokenization Market Report: After Assets Are On-Chain, Where Are the Real Demands and Opportunities?
 Core Viewpoint

 The tokenized market size reached 331.8 billion USD, with non-stablecoin assets growing by 13.3%, but trading remains concentrated on a few products. The next step is to address how assets can truly be utilized after being put on the blockchain.
Author: Pantera Capital
Compiled by: Jiahua, ChainCatcher
Five Key Findings
Tokenization is undergoing a structural transformation: issuing tokens on-chain is no longer difficult, and the next phase focuses on establishing compliant, liquid, and more capital-efficient secondary markets. Although the total value of tokenized assets continues to expand, trading volumes and market participation remain significantly differentiated.
This report combines quantitative data up to June 30, 2026, along with important operational developments in the third quarter, including the performance of Robinhood Chain as of August 31 and key policy updates in September.
Among the 671 assets we track, with a market size of $331.8 billion, growth is expanding from stablecoins to more areas. From the first quarter to the second quarter, the tokenized value of non-stablecoin assets grew by 13.3%, with opportunities across different asset classes and uses becoming more diverse.
Meanwhile, tokenization is expanding along multiple paths. Traders gain exposure to stock prices through on-chain derivatives, platforms like Robinhood bring tokenized assets into new distribution channels for retail users, and the lending market allows tokenized collateral to play a role.
For banks, asset management companies, and wealth management platforms, these changes present opportunities to serve clients through new trading, investment, and financing products.
This report examines where these activities are occurring and what is needed to support them. The five key findings are as follows:
On-chain stock trading shows a strong demand for price exposure. In June, trading volume for perpetual contracts on Hyperliquid and Lighter reached $67.8 billion, approximately 16 times the observable on-chain tokenized stock spot trading volume. These derivatives allow traders to establish positions without holding the underlying tokenized assets.
This comparison illustrates active demand for price exposure, but due to differences in leverage, repeated trading, and statistical coverage, it is not a comparison of actual invested funds or independent user counts.
After the launch of Robinhood Chain, initial success was achieved in expanding the distribution of tokenized stocks and ETFs. Its selected products include well-known companies like Nvidia, Apple, and Tesla, as well as ETFs like SPY and QQQ. In the first month after its launch on July 1, the tracked value of tokenized assets increased to about five times the original.
Trading also increased: the weekly trading volume of RWA rose from $5 million in the first week to $887.5 million in the last week of August, with its share of the DEX trading volume on the chain rising from 0.1% to 12.9%. These data indicate that product launches are translating into actual holdings and growing trading interest, although early wallet balances remain relatively concentrated.
Access conditions determine where public markets can form. Among 110 individual non-stablecoin products with a value of at least $10 million, open-access products accounted for 41% of the total value at the end of June but contributed 99.8% of the observable spot trading volume for that month. Transfer restrictions may narrow the range of eligible buyers and trading venues.
The composition of products also has an impact: licensed assets are primarily concentrated in funds aimed at generating returns, so this comparison cannot solely measure the impact of access conditions.
Secondary market trading activity is not a universal indicator of tokenization success. In addition to access restrictions, low spot trading volumes may also indicate that products are designed for holding rather than frequent trading.
For stock tokens, turnover rates can reflect liquidity conditions, market depth, and transaction quality; for tokenized government bond funds, yield and reliable redemption may be more important than trading frequency; for credit assets used as collateral, borrowing activity and reliable settlement or redemption arrangements are most critical. Evaluating these products requires aligning metrics with their intended uses.
Institutions should focus on market infrastructure that can be built under the current regulatory framework. The CLARITY Act failed to make progress in the Senate proceedings on September 15, and more comprehensive market structure legislation in the U.S. is still undecided.
However, the U.S. Securities and Exchange Commission (SEC) provided a specific path for further development with conditional exemptions for certain tokenized stock trading venues and liquidity providers on September 17. These changes require institutions to develop plans by product: first identifying feasible regulatory paths, then building infrastructure to serve qualified investors within that scope.
For trading assets, this means introducing qualified market makers and trading venues that can meet product transfer requirements; for yield-generating funds, reliable redemption may be prioritized. As the overall framework gradually improves, institutions can enhance customer participation channels and product availability through these specific measures.
Part One: How Are Tokenized Assets Traded, Held, and Used for Financing?
Open-access products contributed 99.8% of observable spot trading volume in June
There are numerous tokenized assets, but just because a token is on-chain does not mean it automatically has a public market. Many tokens are still primarily transferred between wallets or held for yield.
In June, the inter-wallet transfer volume for BUIDL was $441 million, for USTB it was $339 million, and for Spiko's European fund it was $353 million. These transfers may involve subscriptions, redemptions, custody, collateral, yield strategies, and other operational activities. They indicate that tokens are being used on-chain, but do not represent deduplicated investment fund flows or public price discovery.
Public secondary market trading requires eligible buyers and sellers, trading venues supporting the product, and an asset inventory available for participants to trade. Products with zero spot trading volume also have no significant token inventory in their related DEX pools. For licensed products, transfer restrictions may prevent ordinary public funding pools from operating normally. Investors may turn to issuer channels or licensed channels, and these activities are not included in spot trading data. Therefore, the absence of observable spot trading does not prove that investors cannot exit.
This section categorizes products into five asset classes: interest rate, equity, commodity, credit, and private equity funds. Interest rate assets include U.S. and non-U.S. government debt and money market instruments; credit assets cover private credit and corporate credit; private equity funds encompass actively managed strategies and private equity. Synthetic yield-generating dollar tokens like USDe are classified as stablecoins and are not included in this analysis sample.
Products are also divided into open-access and licensed groups based on the rules for token transfer, rather than the eligibility requirements for investor subscriptions.
Open-access products do not impose identity or address restrictions during the transfer phase: any address can receive tokens and trade them in venues supporting the product, even if the issuer still requires KYC identity verification during share creation or redemption. Licensed products impose restrictions on the transfer itself, allowing tokens to circulate only between approved addresses.
The sample from June 2026 includes 110 non-stablecoin products, each with a month-end market value of at least $10 million. Among them, 51 licensed products have a total value of $16.5 billion, while 59 open-access products have a total value of $11.5 billion.
Licensed products account for 59% of the total sample value but only contributed 0.2% of observable spot trading volume; open-access products account for 41% of the total value and contributed 99.8% of the trading volume, or $4.8 billion. Overall, the trading volume of open-access products in June was approximately 41% of their market value, but trading remained concentrated in a small number of products.
BlackRock's BUIDL, Franklin's iBENJI, and Hashnote's USYC all restrict token recipients. Tether Gold, PAX Gold, and Syrup USDC do not have such transfer restrictions. Both groups of products almost always review investors at the time of subscription; the real difference lies in whether the tokens can subsequently enter public trading venues.
Access conditions and asset classes are intertwined to some extent. Licensed products are concentrated in categories primarily intended for holding: 81% of the value of interest rate assets belongs to licensed products, 8% for equities, and zero for commodities. Interest rate assets account for $16.7 billion of the total sample value of $28 billion, so approximately four-fifths of the total value of all licensed assets is concentrated in this category, which is typically bought for yield and redeemed with the issuer.
The gap of "accounting for 59% of value but only 0.2% of trading volume" partly arises from product composition, not just access conditions. 71% of private equity assets are licensed, but the turnover rate in June was 9.4%; 46% of credit assets are licensed, with a turnover rate of 9.5%. Both are about 100 times the 0.1% turnover rate of interest rate assets.
Licensing requirements will limit which trading venues tokens can enter, but the extent of these limitations also depends on whether the product is inherently intended for trading.
Free transfer does not guarantee liquidity
The overall turnover rate for a category is calculated by summing the trading volumes of all products in that category and dividing by their total market value. A few very active tokens can push this value higher even when other tokens have almost no trading. Therefore, a higher category turnover rate does not mean that individual products are generally active.
The equity category illustrates this distinction well. Among the sample of products with a market value exceeding $10 million, 47 equity products had only 12 with turnover rates below 1%. These products collectively valued at $260 million account for about 18% of the total value of $1.5 billion for equities. Most equity assets have reached the threshold, while trading volumes for a few highly active tokens have multiplied their own scale, pushing the overall category turnover rate to 204.6%.
Interest rate products have maintained low turnover rates over the long term. In the observed 42 months, the monthly turnover rate was below 1% for 38 months, with only 0.1% in June. Government bond funds are typically held for yield and redeemed through the issuer; equities and commodities may trade more frequently around market prices.
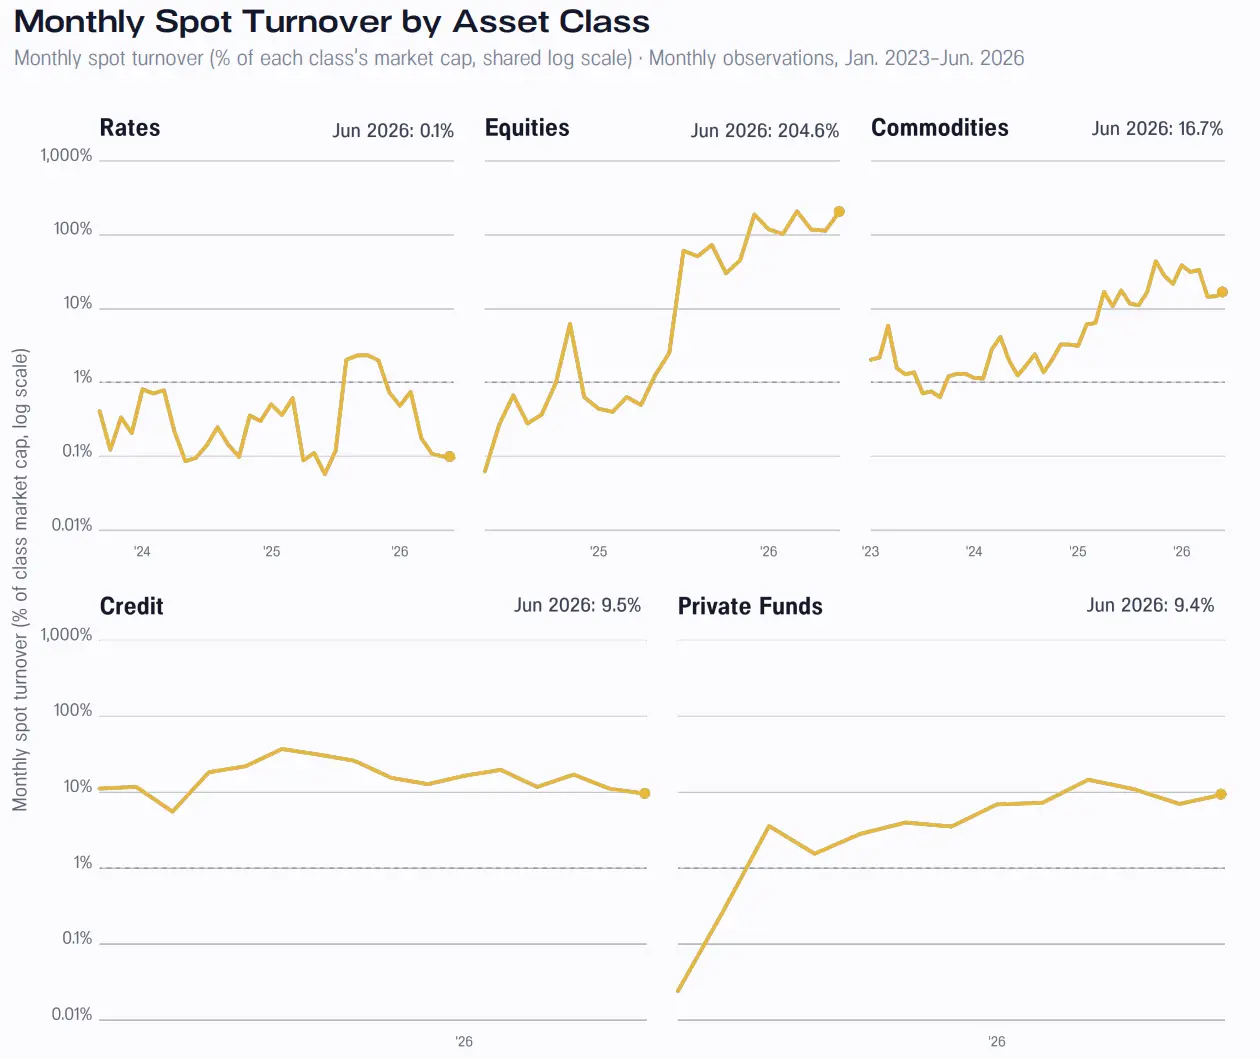
Figure: Monthly spot turnover rates by asset class. In June 2026, equities were at 204.6%, interest rates at 0.1%, and commodities, credit, and private equity were at 16.7%, 9.5%, and 9.4%, respectively.
There are also products in the open-access group that lack trading. Products valued at $3.4 billion, accounting for 29.5% of the total value of that group, had observable spot turnover rates below 1% in June. About $3 billion of this came from two products: Ondo's USDY, with a market value of $2.1 billion and a turnover rate of 0.1%; and Spiko's European fund, with a size of about $900 million, which had no observable spot trading.
The 1% threshold is a unified standard for measuring the activity of the public secondary market, not a definition of liquidity.
Classifying U.S. and non-U.S. government debt as a single category will obscure the actual differences in usage that exist. The U.S. dollar is the common pricing unit in the on-chain market, with pricing, quoting, and collateral practices built around the dollar. Therefore, tokenized U.S. Treasury bills can be held, used as collateral, and redeemed without the need for additional currency selection.
The situation is different for euro, Brazilian real, and Mexican peso products: the natural holder population for the local currency is smaller, local currency quotes are fewer, and for most on-chain trading counterparts, there is also an implicit foreign exchange conversion. Even instruments with similar credit levels and structures may exhibit different turnover rates as a result. Non-U.S. government debt currently accounts for only about 7% of interest rate assets, and aggregated data cannot clearly show this difference.
Turnover Rate of Interest Rate Assets at 0.1%, Stocks at 204.6%
Trading infrastructure faces a "which came first, the chicken or the egg" problem. Only with the growth of trading volume and liquidity providers' fee income can market depth accumulate. Assets with high volatility and active trading are more likely to kickstart the market because turnover can generate sufficient fees to attract liquidity providers.
Low turnover rate instruments cannot achieve this. Tokenized Treasury bills that trade only a few times a month can hardly bring any income to liquidity providers, causing funds to leave or never enter. Less trading leads to fewer fees; fewer fees result in thinner market depth; and thin depth suppresses the next trade.
This explains why an instrument may have high liquidity in traditional markets but still appear illiquid on-chain. The main constraint lies not in the quality of the underlying assets but in the design of the trading venue. Automated market makers rely on turnover to generate income, while hold-centric instruments cannot provide sufficient trading. Price inquiry transactions, market-making incentives, and issuer-supported redemptions are more suitable for such products than liquidity pools reliant on fee income.
For example, selling $10 million in assets would require approximately 126.5 days for interest rate products if the daily trading volume is controlled at 15% of the observable average spot trading volume in June, while stock products would require about 0.5 days. Private equity funds would take 11.2 days, credit would take 4.9 days, and commodities would take 2.8 days.
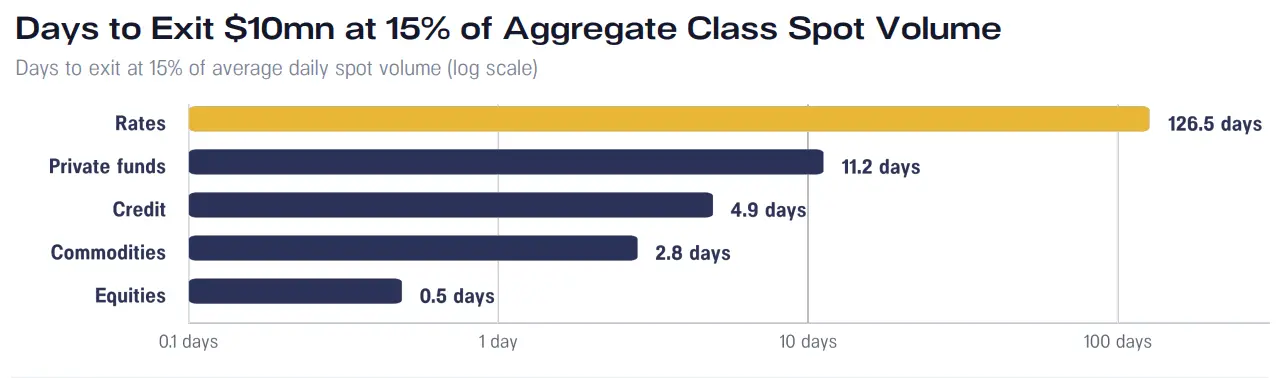
Figure: Estimated days required to sell $10 million in assets at 15% of the average daily spot trading volume by category. This estimate does not include issuer redemption channels and does not account for price impacts of large trades.
This estimate does not include issuer subscription and redemption channels. Eligible investors can redeem directly from the issuer, applicable to different time arrangements. Therefore, even if fund tokens trade infrequently, the fund may still provide a viable exit strategy.
Trading volume tells us how quickly asset value has circulated in the past but does not indicate how many assets can be traded at a given quote. Among the observed products, the largest pool of RWA assets is Tether Gold, distributed across 109 pool addresses, totaling about $24 million. However, the dataset does not include the state of price levels needed to estimate large trade price impacts or the internal order book of centralized exchanges.
Asset Coverage Across More Blockchains, Wallet Holdings Still Uneven
Asset distribution needs to be measured from three levels: which chains the assets are deployed on, how many addresses hold them, and how much value is controlled by the largest holdings.
At the infrastructure level, tracked non-stablecoin assets expanded from being distributed across 3 chains in January 2023 to 23 chains by June 2026. During the same period, the share of the largest chain dropped from 87.8% to 53.8%, a decrease of 34 percentage points; the Herfindahl-Hirschman Index, which measures market concentration, fell from 0.8 to 0.3, with lower values indicating more dispersed distribution.
Multi-chain deployment has shifted from being a rare occurrence to a fundamental characteristic of the market. At the end of the quarter, Ethereum still accounted for 53.8% of the tracked asset value; Solana's asset value is less than one-fifth of Ethereum's but recorded more holder addresses.
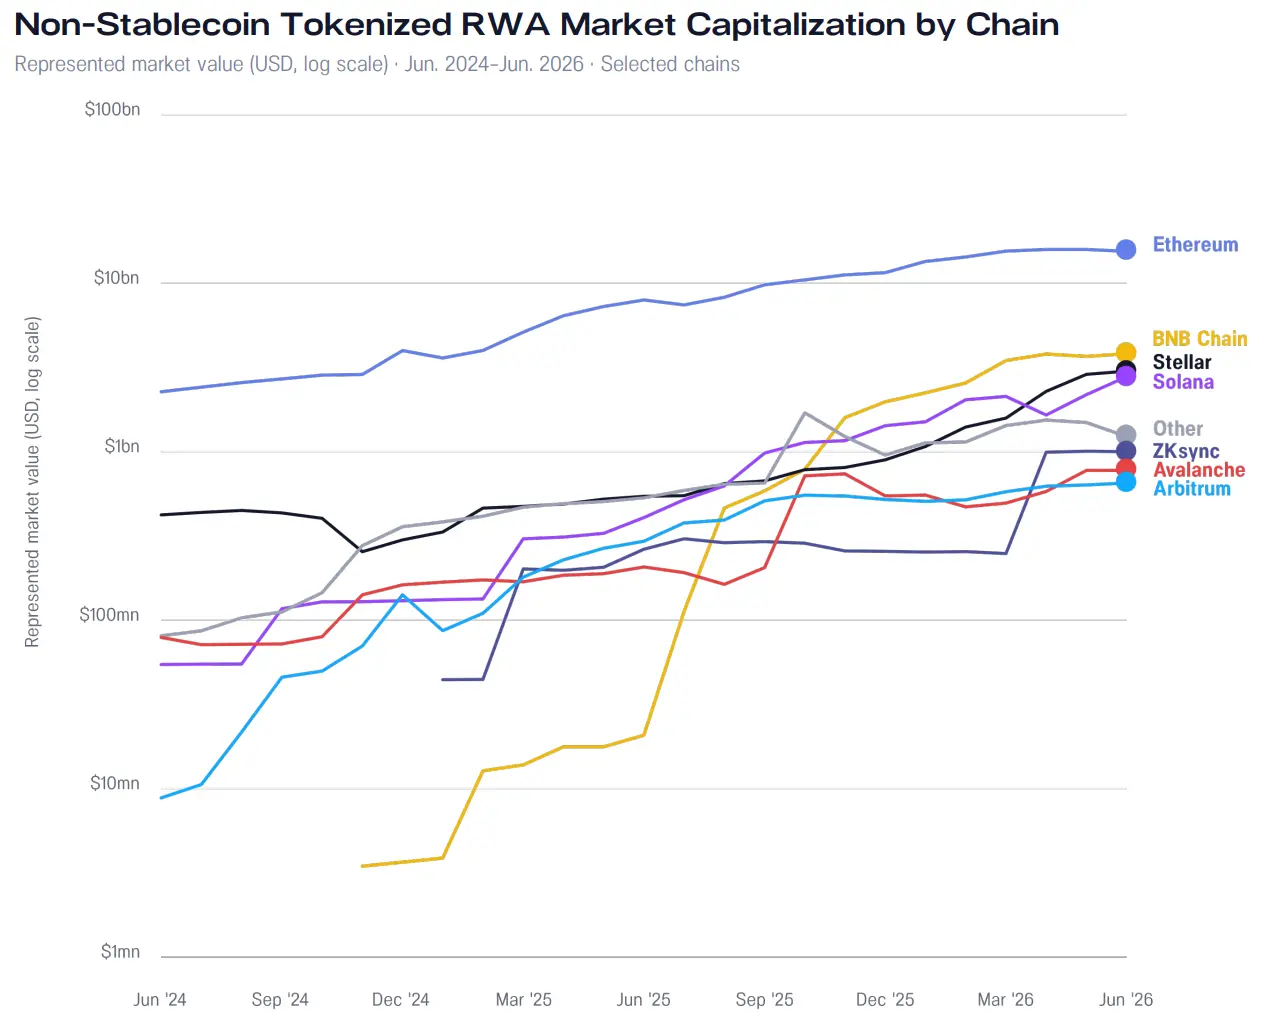
Figure: Changes in market capitalization of non-stablecoin RWA on some chains. Asset deployment is gradually expanding to more networks, with Ethereum still holding the largest asset share.
The number of holders needs to be interpreted alongside balance concentration. A large address may represent a single investor, issuer, fund management wallet, vault, or collective custody account. On-chain balance concentration may not correspond to the actual beneficial ownership distribution.
In interest rate assets, the proportion of the largest holdings relative to the category's value dropped from 89.3% to 18.6%; private equity funds fell from 74.9% to 27.0%. At the end of the period, stocks were at 25.2%, credit at 14.4%, and commodities at 8.9%. As a category expands, this category-level proportion may decline, but the holdings within existing products may not necessarily become more dispersed.
Examples at the product level illustrate why it is necessary to examine both the number of holders and concentration: Syrup USDT has 1,105 holder addresses, but the top ten addresses hold 93.0% of the supply; PAX Gold has 91,775 holder addresses, with the top ten addresses accounting for 32.5%.
Therefore, only when a product has at least 1,000 holder addresses and the supply held by the top ten addresses does not exceed 90% is it considered to have dispersed holdings.
Scale, Trading Activity, and Holding Dispersion Rarely Coexist
The 1% turnover rate threshold and holding distribution test divided the June sample into four groups.
Out of 110 products, only 29 passed both filters, accounting for about one-quarter. They have a total value of $6.6 billion, representing 23.5% of the total sample value, all of which are open-access products, including Tether Gold, PAX Gold, Syrup USDC, and OnRe.
Another 18 products reached the turnover rate threshold but had concentrated holdings, with a total value of about $1.7 billion; 6 products had dispersed holdings but did not meet the turnover rate threshold, with a total value of about $4.6 billion, including Ondo USDY, Spiko Fund, and Franklin BENJI/FOBXX.
The largest group contains 57 products with low turnover and limited holding coverage, totaling $15.2 billion, accounting for 54.1% of the total sample value, yet only generating about $100,000 in observable spot trading volume. This group includes Hashnote, BlackRock BUIDL, Franklin Institutional iBENJI, and BCAP.
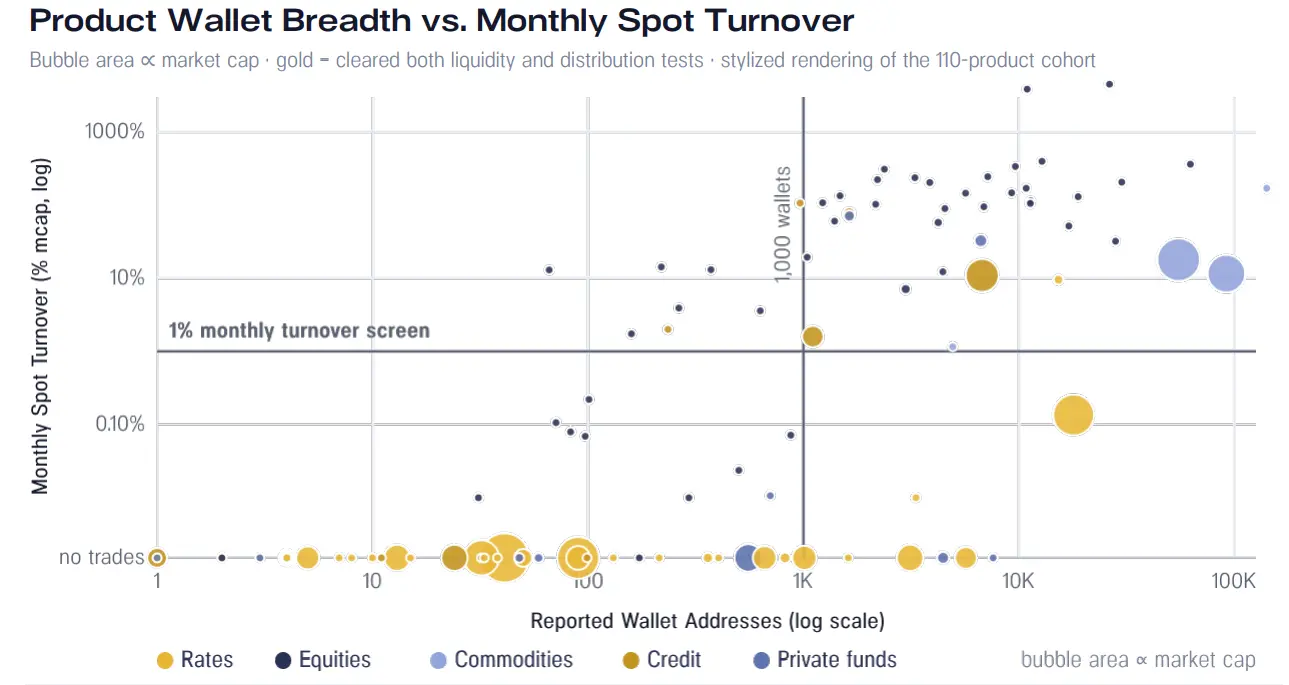
Figure: Schematic distribution of the number of product holder addresses versus monthly spot turnover rate. Gold indicates those that passed both liquidity and holding distribution tests, with bubble size proportional to market capitalization.
There are 10 products with a scale exceeding $250 million, each having fewer than 100 holder addresses, with a total value of $11.4 billion. Even among products that meet the turnover rate threshold, the coverage of holders remains important: the absolute trading volume generated by the dispersed holding group in June was 6.9 times that of the concentrated holding group.
Adjusting the thresholds will change the classification of products on the edge of the groups, but the overall pattern remains unchanged. Market scale, active trading, and widespread holding do not naturally occur simultaneously.
The true potential of tokenization is not just putting funds on the blockchain, but changing what these assets can do. When fund shares can be distributed globally, have tradable liquidity, serve as collateral, and connect to programmable markets, their utility as financial assets fundamentally changes. This transformation is particularly powerful for the private market, enhancing its liquidity, accessibility, and capital efficiency.
Jonathan Shaffer, Founder and CEO of Fission Labs
Of 48 Whitelist-Only Products, 46 Did Not Meet Turnover Rate Threshold
Access conditions help explain the differences between groups: Can a token enter a venue for secondary trading?
Of the 48 whitelist-only products, 46 had turnover rates below 1%, accounting for 96% of the number of products in that group and 99.1% of the group's market value. All products that passed both turnover and holding distribution filters were open-access products.
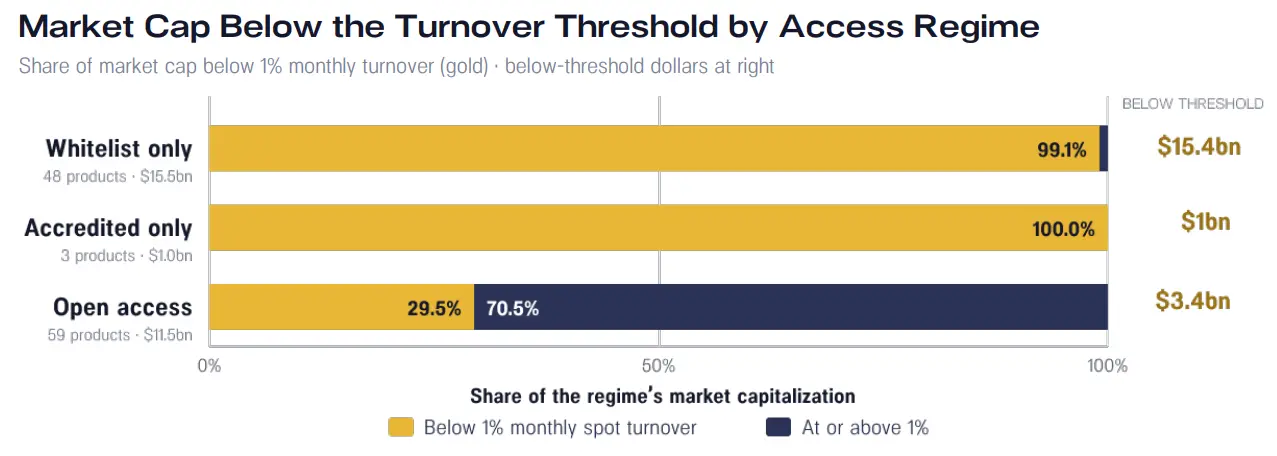
Figure: Proportion of market value of assets with monthly spot turnover rates below 1% under different access regimes. Gold indicates the portion below the threshold, with corresponding asset amounts listed on the right.
This does not mean that open access necessarily leads to trading. Each group has differences in listing support, market making, product design, and investor demand. However, in this sample, access conditions are clearly associated with observable trading activity.
Changing the number of holders, concentration, or minimum balance thresholds will affect the number of specific products but will not alter the results related to access conditions. In all tested scenarios, no permissioned products entered the "meets turnover rate and has dispersed holdings" group.
These findings do not imply that permissioned products must eliminate investor restrictions to develop a more active secondary market. By retaining fund KYC and transfer requirements while introducing qualified liquidity providers and trading or lending venues, the ability of products to reach buyers and obtain financing can also be improved.
A New Path for the Tokenized Stock Market
On September 15, the Senate failed to advance the CLARITY Act, and the timeline for broader digital asset market structure legislation in the U.S. remains uncertain. Meanwhile, tokenized products and trading venues have developed in the absence of a settled legislative framework.
Two days later, the SEC issued an "Innovation Exemption," granting a five-year conditional exemption for certain venues and liquidity providers that support the licensed trading of U.S. listed stock tokens through automated market makers and liquidity pools.
Its scope is clearly defined, including qualifications, investor rights, and trading condition requirements, and it does not replace comprehensive legislation nor imply that all tokenized securities can be traded without restrictions.
For tokenization, the real opportunity lies in connecting qualified investors with venues and liquidity providers that can support secondary trading. As long as the surrounding infrastructure can adapt, permission requirements do not necessarily hinder market development. When measuring progress, in addition to focusing on policy steps, it is also important to see if a truly usable market has formed.
How Morpho Vault Provides Financing for RWA Collateral
Secondary market trading is not the only way tokenized assets generate economic value. Credit demonstrates another path: using assets as collateral in the lending market.
In the Morpho lending market, which consists of 27 products using direct RWA or RWA-backed collateral, we identified 129 Vault and strategy addresses that provided funding at some point during the first half of the year. This includes 79 MetaMorpho V1 Vaults and 50 Vault V2 strategies accessed through on-chain adapters.
At the end of the quarter, 54 addresses had a positive net deposit amount, with 26 from V1 and 28 from V2. Pendle principal tokens and other derivatives trace back to their economically underlying assets; crypto-native yield products are excluded.
Net funding supply is reconstructed based on cumulative deposits minus cumulative withdrawals, with negative balances treated as zero. It serves as an approximate indicator of cash flow, not the current position size, and its statistical scope is smaller than the overall platform's RWA TVL.
The trend in the first half of the year was far from linear growth. The identified Vaults and strategies had a reconstructed net deposit amount of $120.4 million on January 1, dropped to a low of about $49 million in late April, and then rebounded in May and June, peaking at $208 million on June 23, ending the quarter at $187 million.
The structure driving this rebound has changed significantly. The net funding provided through MetaMorpho V1 continued to shrink in the first half of the year, while Vault V2 rose from nearly zero at the beginning of the year to about 92% of the identified Vault funding supply by the end of the quarter. The expansion of V2 outpaced the contraction of V1.
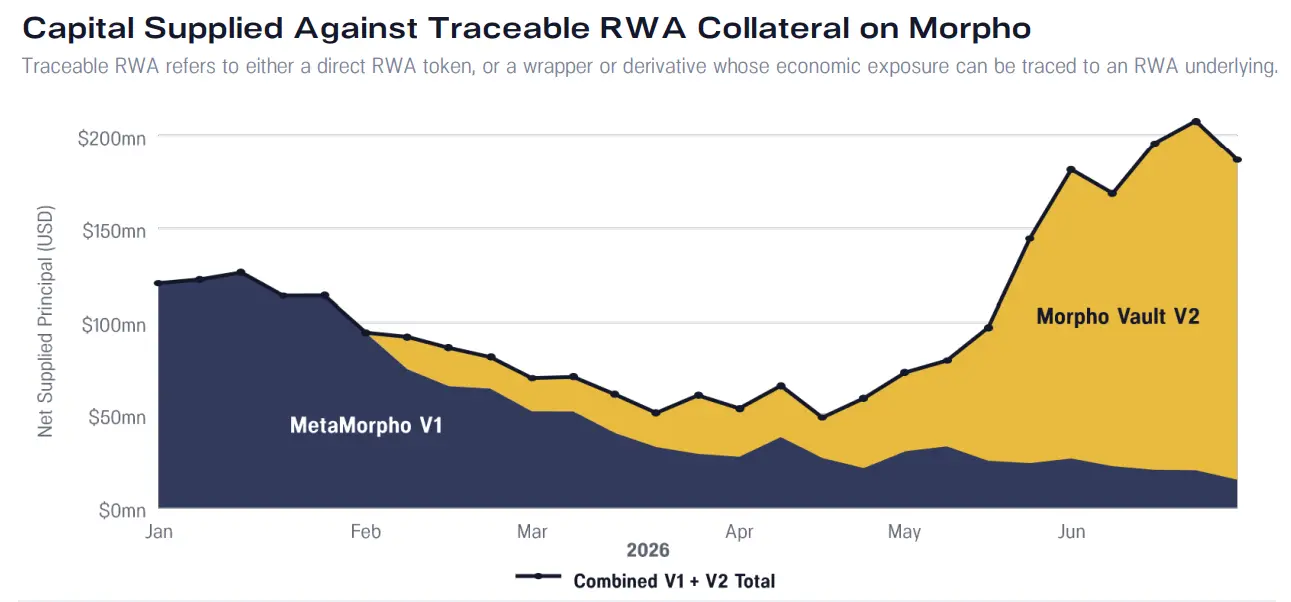
Figure: Funding supply obtained on Morpho with traceable RWA as collateral. Traceable RWA includes direct RWA tokens and packaged products or derivatives with economic exposure traceable to the underlying RWA assets.
The outflows within V1 were concentrated in specific strategies. Some larger positions, such as thBILL, the Theo short-duration U.S. Treasury fund, and PT-reUSD, the Pendle principal token position pegged to Re Protocol's reUSD, exited; other strategies retained or adjusted their RWA exposure in June.
In the funding supply of Vaults using RWA as collateral on Morpho, credit dominated at the end of the first half. By the end of the quarter, the net funding supply backed by private credit and consumer credit was about $120 million, followed by reinsurance at about $44 million, U.S. Treasuries at about $12 million, equities and preferred stocks at about $9 million, and commodities at about $3 million.
Assets used as collateral do not mean liquidity is no longer needed. If a borrower defaults, the lender needs a reliable way to sell or redeem the collateral.
For assets with longer redemption periods, liquidity providers can first advance stablecoins and then wait for fund redemptions. This provider finances during the waiting period and bears the corresponding risks, making their funding capacity and reliability crucial to the lending market.
The liquidity requirements of RWA assets depend on their use
To assess the value of tokenized assets, one must first consider the expected use of the product: investors holding for yield need reliable redemption, traders need competitive execution conditions, and borrowers need reliable financing against collateral.
For yield-bearing products, one should examine subscription and redemption times, fees, eligibility requirements, and available exit capacity.
For equity or commodity tokens, one should consider bid-ask spreads, tradeable volumes, slippage, trading hours, and market maker coverage.
An asset can exist on the blockchain while still inheriting almost all the restrictions of the off-chain asset it represents. The value of tokenization will grow as more asset actions can be completed directly on the network. This includes how assets transfer, how they settle, and how they are used across different financial applications.
New participation channels: $67.8 billion in perpetual contract trading volume compared to $4.2 billion in spot trading volume
Perpetual contracts allow traders to establish long or short exposure to an asset without holding the underlying token. Unlike traditional futures, perpetual contracts have no expiration date, and traders only need to provide margin without paying the full value of the position.
The demand for price exposure can grow, while the holding size or liquidity of the tokenized asset itself may not increase in tandem.
In June, the trading volume of stock perpetual contracts on Hyperliquid and Lighter was approximately $67.8 billion, about 16 times the observable trading volume of tokenized stocks in DEX and RWA native platforms at $4.2 billion. From January to June, this monthly ratio ranged from about 10 times to 17 times.
Leverage and frequent rebalancing can amplify perpetual contract trading volumes, while spot trading involves the exchange of the tokens themselves. Therefore, higher nominal trading volumes in perpetual contracts do not necessarily prove that more actual funds are being invested, that liquidity is deeper, or that investors are abandoning spot holdings.
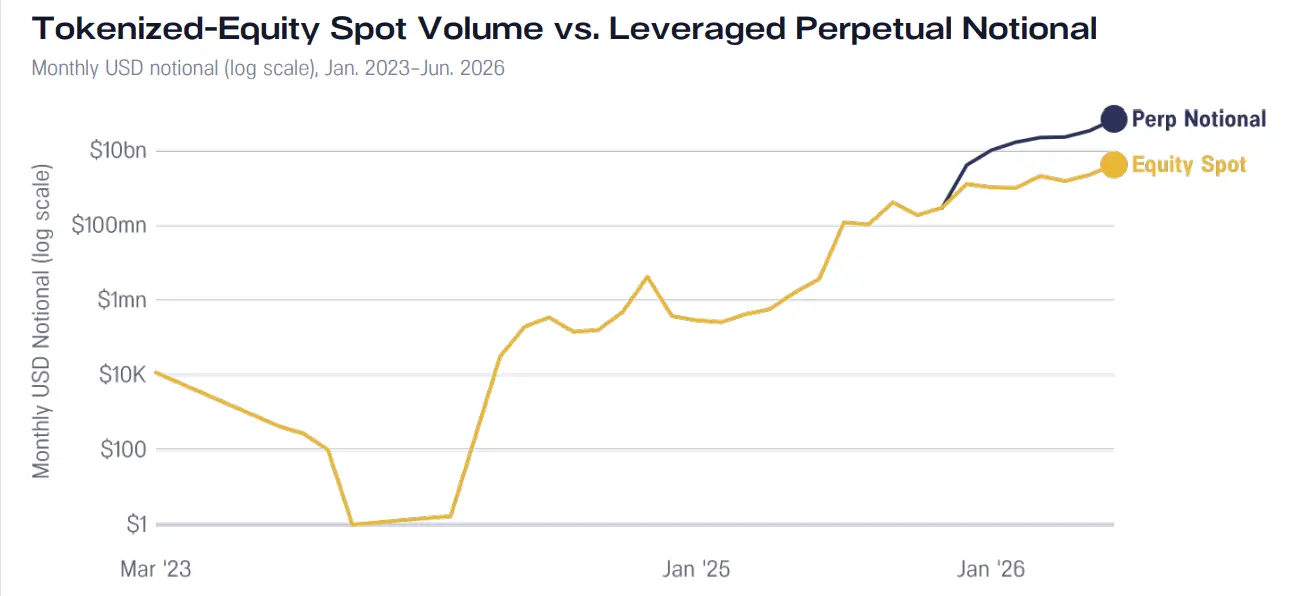
Figure: Trading volume of tokenized stock spot trading versus leveraged perpetual contract nominal trading volume, using monthly data and logarithmic coordinates. The underlying assets covered by the two datasets are not entirely the same.
The stock perpetual contracts here provide synthetic exposure to individual stocks and stock indices, while spot refers to trading of tokenized stocks and ETFs. Both datasets include broad market exposure, with each trade counted only once, but the underlying assets covered are not entirely the same.
Observable spot data combines RWA native on-chain trading venues like Ondo Stocks with general DEX statistics but excludes centralized exchange order books, brokerage platforms like Robinhood, over-the-counter trading, alternative trading systems, and other off-chain transactions. The public mainnet of Robinhood Chain launched after the first half of the year, so it is analyzed separately.
This dataset should be understood as observable on-chain spot activity rather than total market trading volume.
Entering the third quarter, Ondo extended its tokenized stock business into derivatives. Ondo Perps went live in July for qualified non-U.S. users, offering around-the-clock perpetual contracts for stocks, ETFs, and commodities, supporting up to 20x leverage and allowing tokenized securities as collateral.
A few weeks after launch, Ondo updated to disclose a cumulative trading volume of $9 billion and an open interest of $100 million; subsequent updates in September showed that over $25 million of Ondo Stocks had been deposited as collateral.
Open interest in perpetual contracts reaches 121.3% of the market cap of tokenized stocks
Open interest measures the nominal value of perpetual contract positions that have not been closed, with each matched contract counted only once.
At the end of the first half, the open interest in Hyperliquid stock perpetual contracts was about $2.5 billion, equivalent to 121.3% of the observable circulating market cap of tokenized stocks. April was the first month in observation to exceed 100% at the end of the month, reaching 109.5%.
Traders provide margin, not the full nominal amount, so this comparison does not represent equivalent actual funds invested, nor does it represent ownership of tokenized stocks. Both metrics use daily snapshots at the end of the month in UTC time, covering different sets of underlying assets but including individual stocks and broad market exposure.
Funding rate dispersion decreases, but cannot be directly equated to liquidity improvement
Traditional futures converge toward spot prices as expiration approaches. Perpetual contracts have no expiration date, so exchanges use funding fees to keep contract prices linked to the underlying assets.
When the price of a perpetual contract is above the spot price, funding fees are typically paid from longs to shorts; when below the spot price, from shorts to longs. Funding fees affect the cost of maintaining positions.
As of June, the funding rate dispersion for both Hyperliquid and Lighter was below previous peaks. Hyperliquid declined continuously from its peak in March to June; Lighter decreased from February to May and then rose again in June. Compared to previous peak periods, daily funding rates across contracts and dates became more concentrated.
Several factors may explain this change. A calmer underlying market may reduce pricing deviations; a deeper order book can mitigate the impact on prices and funding rates during changes in buy-sell pressure; a more balanced demand between longs and shorts may also play a role.
It is important to distinguish these reasons: a calmer market means less pressure on the platform, while deeper liquidity means the platform can better withstand pressure. A decrease in dispersion alone does not prove liquidity improvement, nor does it indicate that the funding costs of individual positions are more predictable.
Some on-chain trading venues are connecting existing liquidity from mature markets. Veranta, built by Avantis.fi, handles RWA trading through market makers connected to traditional trading venues; Variational Omni uses a request-for-quote model, where its liquidity providers price and hedge trades using external markets.
These methods can help a platform support trading before establishing its own deep order book. For products that link funding fees to traditional market financing costs, rates are no longer so dependent on the imbalance between buyers and sellers within a single platform.
Robinhood Chain: A test of retail distribution channels at the beginning of the third quarter
The public mainnet of Robinhood Chain launched on July 1, 2026. Its platform for individual users provides a case study to test whether a diverse range of tokenized assets can translate into sustained demand.
Robinhood's Stock Tokens are debt securities that provide economic exposure to the underlying stocks but do not confer legal ownership or beneficial ownership of those stocks.
This case uses data from the beginning of the third quarter extending to late August, excluding the total market volume from the first half of the year. Early results indicate that measurable on-chain activity is growing, but the actual funding scale, liquidity, and holdings of stock tokens remain relatively concentrated.
The tracked value of tokenized assets rose from $5.6 million at the end of June before launch to $28.4 million at the end of July. The weekly trading volume of RWA increased from $5 million in the first week after launch to $887.5 million in the last week of August, with its proportion of the DEX trading volume on that chain rising from 0.1% to 12.9%.
On August 31, the daily trading volume of RWA reached $244.7 million, with 38% categorized as "stock trading." This trading volume metric accounts for exchanges routed through Rialto, involving recognized token contracts, calculated in nominal amounts quoted in USDC.
These data do not prove that consumers have widely adopted the assets, nor do they demonstrate that stock tokens themselves have formed sustained demand.
As of August 3, among the 202 tracked RWA contracts, 96 have received funding. The number of transfers is also far higher than the actual level of economic participation: of the 63.8 million transfers in July, 86.2% of the amount was below 1 dollar, with a median transfer amount of 0.0014 dollars.
In the longer window from July 1 to August 7, the top ten outgoing addresses contributed 89.4% of the transfer counts. Therefore, the high number of transfers does not prove the existence of widespread economic participation.
From Transaction Activity to Actual Scale of Holdings
In the token market cap snapshot, the 30 largest funded RWA tokens account for 97.6% of the total tracked value; the top ten account for 58.2%; NVDA alone accounts for 15.9%.
Various listed products have not universally received funding; rather, a few leading products are ahead, followed by a long list of assets with very small funding amounts.
The expansion of listed products is also faster than market formation. Among the 202 tracked RWA contracts, 96 once had asset value, 90 had recorded DEX transactions, 68 had active liquidity at the time of the snapshot, and 32 had at least 100 wallets each holding a balance of 1 dollar or more.
From the first funding to the first DEX transaction, the median time for assets is 11 days; the second batch of listed products has not yet received funding during the observation period. These are different phased indicators and do not represent a unified conversion funnel, but they indicate that a rich product shelf can quickly exceed actual funding needs.
The balance snapshot on August 7 shows that holdings are highly concentrated. Among 64,981 addresses with positive balances, 73.8% hold less than 10 dollars; 669 addresses with balances of at least 1,000 dollars account for only about 1% of current holder addresses but control 95.1% of the tracked asset value.
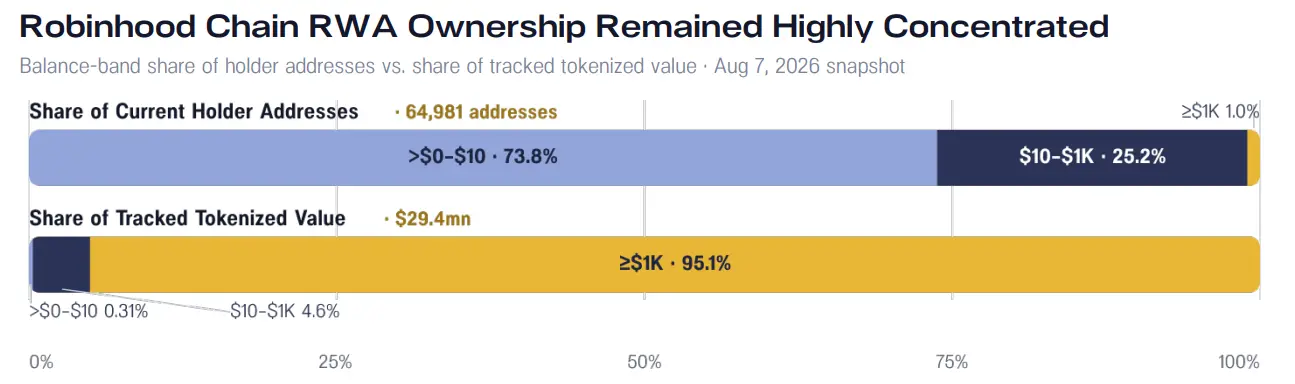
Figure: The proportion of holder addresses and asset value in different balance ranges for Robinhood Chain. About 1% of holder addresses control 95.1% of the tracked asset value.
A platform can list hundreds of assets, but most actual funding value may still be concentrated in a few products and addresses. To convert platform coverage into sustained participation, it requires more than just increasing the number of products.
Part Two: What Changes Have Occurred in Market Scale and Asset On-Chain Levels?
Review: How TPI Measures Tokenization Progress
Investors can hold fund tokens on-chain, but the fund itself is still operated by traditional intermediaries: administrative managers handle issuance, custodians control assets, and redemptions are completed through off-chain channels.
The Tokenization Progress Index (TPI) measures the gap between assets merely presented in digital form and the actual use of blockchain in their operational models.
This framework examines the asset lifecycle, starting from token creation, assessing how tokens enter and exit circulation, whether blockchain becomes the authoritative record layer for transfers and settlements, and whether assets can be used in programmable on-chain markets.
Legal initiation and structural design are not included in the scoring, as ownership, transfer restrictions, and redemption rights vary across different jurisdictions and are difficult to compare directly.
The three scoring dimensions are issuance and redemption, transferability and settlement, and complexity and composability, with each score ranging from 1 to 5. A score of 1 indicates that the relevant processes are still controlled by intermediaries and off-chain records; a score of 5 indicates that blockchain has become the primary operational layer, with smart contracts managing most aspects of the asset lifecycle.
The average of the three dimensions yields a composite TPI, reflecting the uneven development of different stages. An asset may be freely transferable, but redemption still requires manual processing; it may also support on-chain yields, but custody remains off-chain.
These scores correspond to three levels:
Encapsulated, with a composite TPI of 2.5 or below. Tokens represent rights to off-chain assets held by custodians, primarily serving as digital certificates, with off-chain ledgers remaining the authoritative record.
Hybrid, with a composite TPI above 2.5 and below 3.5. Some lifecycle stages are completed on-chain, such as transfers and yield accumulation, but key functions like custody and redemption remain off-chain.
Native, with a composite TPI of 3.5 or above. Assets are native to the chain, with issuance, redemption, custody, and composability primarily managed by smart contracts, with less reliance on off-chain aspects.
The levels are merely brief classifications and cannot replace the underlying scores. Two assets may be categorized in the same level for entirely different reasons. TPI is also only used to assess the maturity of technology and structural aspects, not to represent judgments on asset investment value, valuation, or performance prospects.
The Decline in Stablecoin Scale Masks Growth in Non-Stablecoin Assets
From March 25, 2026, to June 30, 2026, the market sequence of RWA.xyz decreased from 334.5 billion dollars to 331.8 billion dollars, a decline of about 0.8%.
Stablecoins fell from 302.4 billion dollars to 295.5 billion dollars, a reduction of about 7 billion dollars, with a decline of about 2.3%; non-stablecoin assets increased from about 32 billion dollars to 36.3 billion dollars, an increase of about 4.3 billion dollars, with a growth rate of about 13.3%.
This comparison measures the scale change between the observation point in late March and the end of the first half of the year, not natural quarterly returns, investor capital inflows, or investment performance.
The market benchmark and product catalog use different statistical scopes. The market benchmark retains the original metrics of RWA.xyz; Pantera's independent product catalog records the asset values represented by each product based on available data.
In the independent product catalog, the observed asset representative value at the end of the first half of the year is 320.8 billion dollars, of which non-stablecoin assets account for 30.5 billion dollars. This is an observable subtotal of tracked products, not the entire market benchmark. Products lacking available end-of-period valuations are not included in this subtotal.
Therefore, the observable total in the catalog shrinking due to missing valuations does not prove a market decline; the growth of comparable subsamples should not be generalized to products outside the sample.
28 Products Launched in the Second Quarter, Total Launches for the Year Increased to 45
From April to June, 28 products were launched, increasing the total number of launches in 2026 from 17 at the end of the first quarter to 45 by June 30.
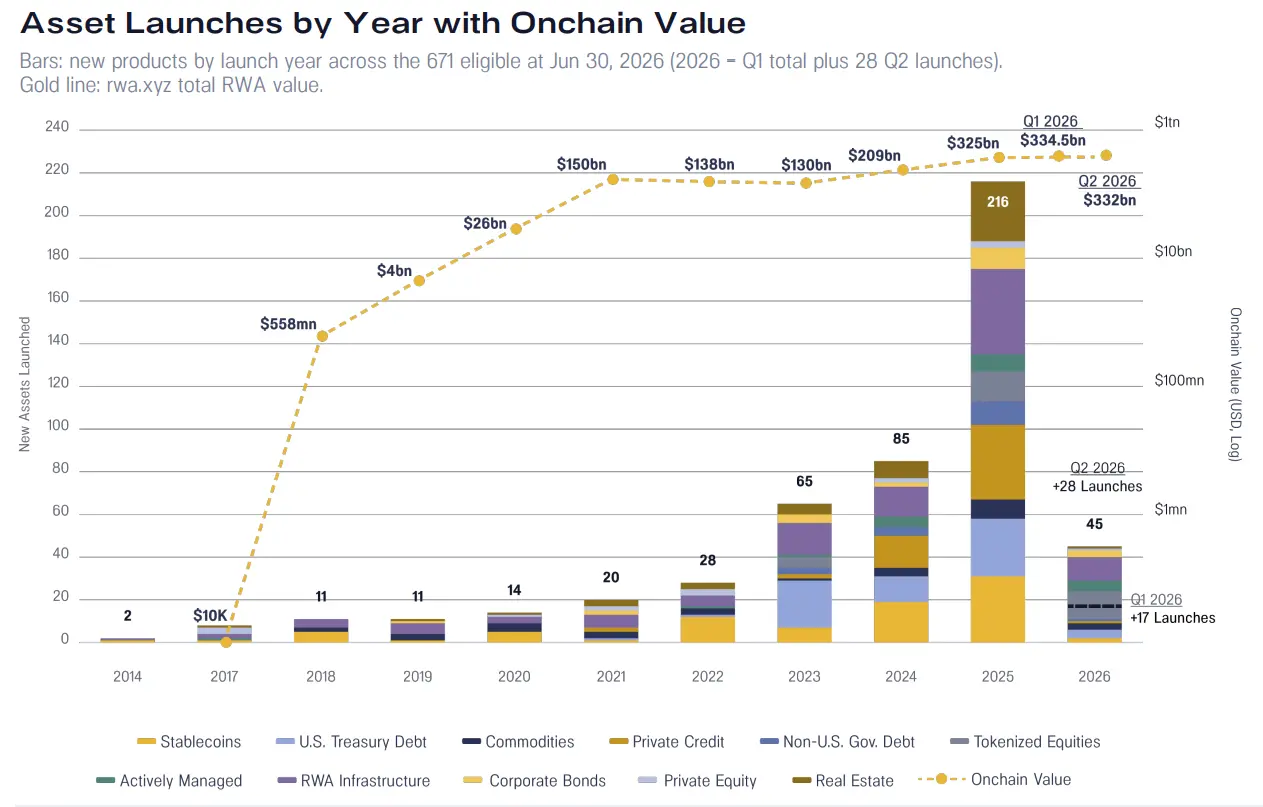
Figure: The number of newly tokenized products by launch year, and the total on-chain asset value. A total of 45 products were launched in the first half of 2026, with 28 new in the second quarter; the gold line represents the total asset value of RWA.xyz, including stablecoins.
The credit sector also shows that product reserves are expanding. BAGEY brought short-duration corporate bonds to Ethereum and Solana; Securitize's STAC expanded tokenized AAA-rated loan collateral exposure to Solana; Centrifuge's JAAA continues to deploy on Solana and Base.
Earlier projects are also advancing. Between the two snapshots, 13 projects transitioned from pilot or announced stages to formal launches. The project reserves themselves are also expanding: 9 new projects were added, of which 6 explicitly entered during this period, while 3 lack specific records of inclusion dates.
These data are better understood as phase changes between the two snapshots rather than conversion rates at the end of the quarter.
In the third quarter, Ondo expanded tokenization from single securities to complete portfolio strategies. Launched on September 24, Ondo Intelligent Portfolios packages selected portfolios into a single token that can be transferred peer-to-peer, aimed at qualified investors outside the United States.
Among them, Ondo High Income Powered by BlackRock, Ondo Diversified Growth Powered by BlackRock, and Ondo High Growth Powered by BlackRock adopt the portfolio strategies developed by BlackRock for Ondo.
Rebalancing is executed at the smart contract level, with portfolio components, weights, and each rebalance viewable on-chain. Ondo stated that it plans to gradually add more portfolios.
Stablecoin Scale Closed at 295.5 Billion Dollars, Accounting for 89.1% of Total Market Value
In the RWA.xyz market sequence, the stablecoin scale at the end of the first half of the year was 295.5 billion dollars, a 2.3% decrease from the late March observation; its proportion of total market value fell from 90.4% to 89.1%.
Although the share of non-stablecoin assets has increased, stablecoins still occupy the largest portion by a significant margin.
The value of stablecoins decreased by about 7 billion dollars, exceeding the increase of 4.3 billion dollars in non-stablecoin assets. The overall decline thus masks the growth outside of stablecoins and does not imply that all tokenized asset categories are contracting.
In the market benchmark sequence, government bonds contributed about 3 billion dollars in growth, tokenized stocks about 1.1 billion dollars, and corporate credit about 1.1 billion dollars; declines in other areas offset some of the increases.
These benchmark classifications cannot be mixed with those in the Pantera product catalog. In the product catalog, the observed value at the end of the first half includes 15.4 billion dollars in U.S. government bonds, 5.1 billion dollars in private credit, 4.5 billion dollars in commodities, 1.5 billion dollars in active strategies, 1.2 billion dollars in non-U.S. government debt, 1.1 billion dollars in private equity, 1.0 billion dollars in tokenized stocks, 0.6 billion dollars in corporate bonds, and 0.3 billion dollars in real estate.
Due to incomplete coverage of end-of-period data, some of these are only observable subtotals for certain products. Across the entire catalog, 192 products lack available end-of-period valuations. These products had a combined value of 7.7 billion dollars in observations from July and August, but later values were not included in the end-of-period subtotal.
These missing values reflect the availability of valuations and anomalies in data sources and should not be interpreted as products disappearing, investors withdrawing, or the collapse of value in entire categories.
In the observable subtotal of 30.5 billion dollars in non-stablecoin assets, Securitize accounts for 13.0%, Ondo for 10.8%, Circle for 10.2%, Tether for 8.0%; Spiko enters the top five with a 6.0% share.
Of 515 Assets, 501 TPI Scores Remained Unchanged
Category TPI is the average score of the products included in each snapshot. It may change due to existing products altering their issuance, transfer, settlement, or access to DeFi, or due to new products being launched, added or removed products, reclassifications, scoring corrections, etc.
Among the 515 products that received ratings in both snapshots, 501 had unchanged overall scores.
The verified total at the end of the first half includes 671 tracked assets, of which 598 have been rated and 73 have not, with an average overall TPI of 2.04. Changes in average category scores need to be distinguished from improvements in the operational methods of existing products.
The changes in operational models are mainly focused on distribution, transferability, settlement, and combinability, rather than broadly eliminating investor qualification requirements. Newer products indicate that compliance requirements can be retained at the issuance stage while making tokens easier to trade, transfer across networks, or use in DeFi.
The growth of DeFi TVL itself will not increase TPI; only changes in product operational models will. The first half reflects improvements in certain aspects rather than a general shift in the entire category towards self-completion of issuance and redemption.
Encapsulated types still dominate: 506 encapsulated, 72 hybrid, 20 native, with another 73 unrated records. The category TPI reflects the architecture of rated products rather than the market maturity weighted by asset amount.
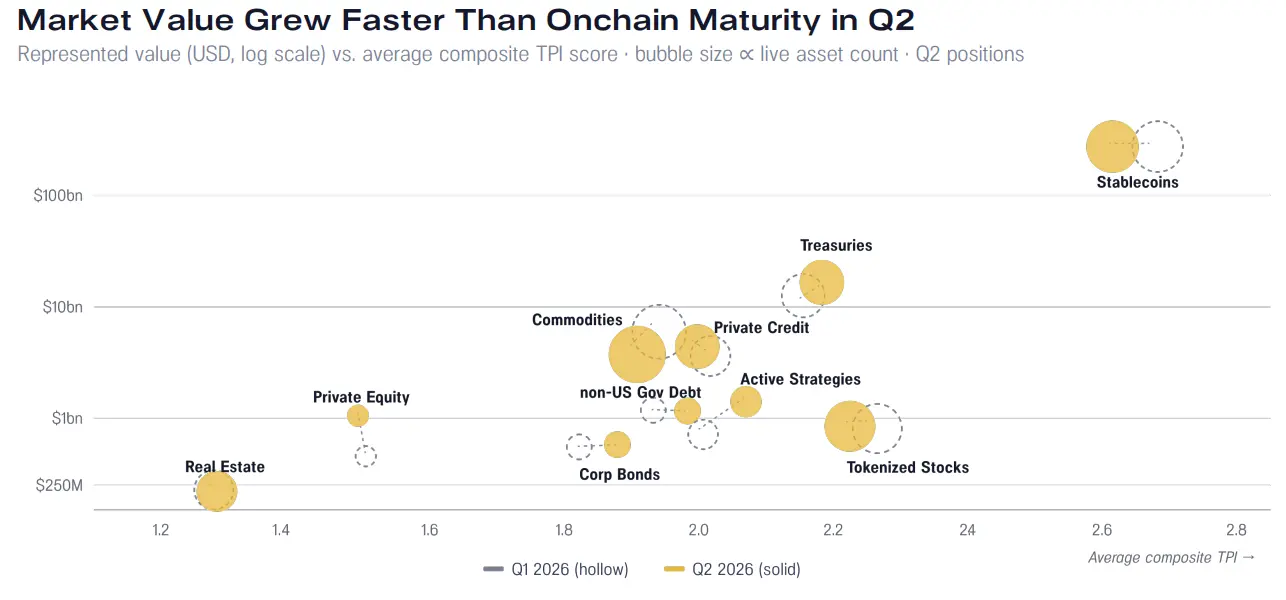
Figure: Market value and average overall TPI of each asset category. Hollow bubbles represent the first quarter, solid bubbles represent the second quarter, and bubble size is proportional to the number of launched assets. TPI measures the technical and operational maturity of tokenization and does not represent investment value.
From Single Securities to On-Chain Portfolios
Tokenization is beginning to expand from single securities to products that combine multiple assets according to clear investment strategies.
In Ondo Intelligent Portfolios, each token represents an investment exposure to a selected portfolio of tokenized stocks and ETFs, with asset allocation and periodic rebalancing executed by smart contracts.
For investors, the practical change is a reduction in the need to manage positions and rebalancing decisions themselves. For the on-chain ecosystem, the significance lies in the complete portfolio becoming a transferable token, which can later be integrated into lending markets, collateral systems, and other investment products.
The programmability of products is thus no longer limited to the transfer of single assets but can also cover portfolio configuration, weight adjustments, and subsequent uses.
DeFi TVL for Private Credit Reaches 44.7% of Comparable Sample Asset Value
The DeFi usage rate will compare the total locked value tracked in DeFi with the asset value represented by the same group of products.
Based on matched coverage, private credit reaches 44.7%, commodities 5.7%, tokenized stocks 5.6%, active strategies 1.3%, while corporate bonds and private equity round to 0%.
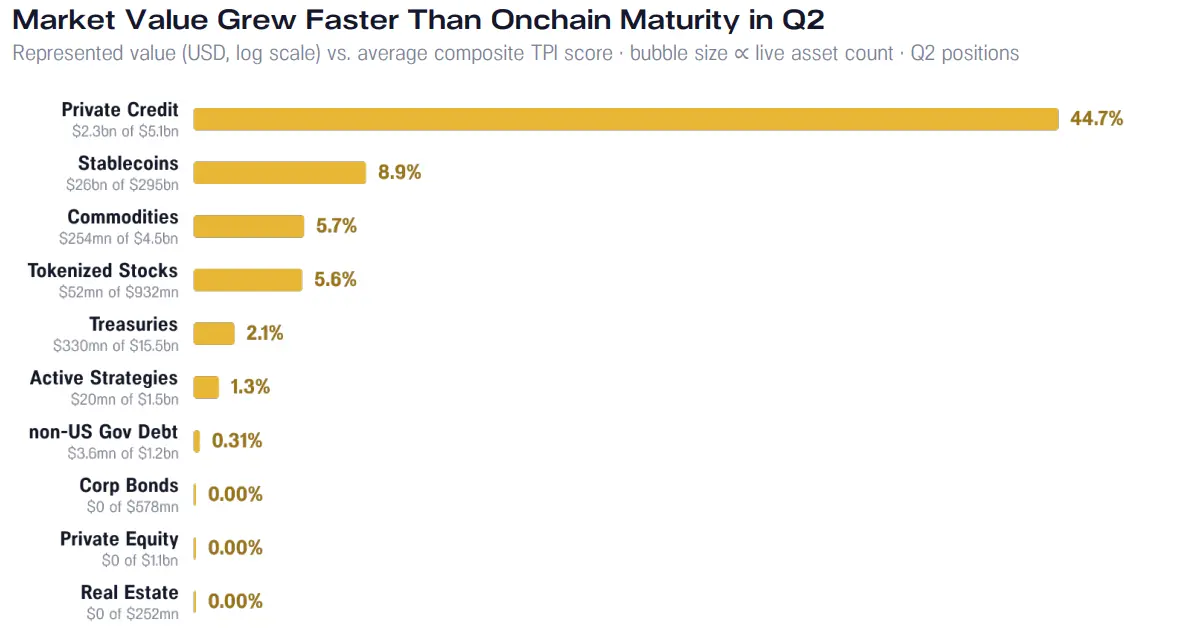
Figure: DeFi usage rates for each asset category, calculated as the ratio of DeFi TVL to the corresponding product asset value. The snapshot of TVL at the beginning of the third quarter and the asset value at the end of the first half are used, applicable only to product samples with consistent statistical coverage.
Incomplete valuation coverage will limit the scope of comparison; therefore, this ratio should be interpreted within the same product coverage.
The Morpho case also independently indicates that even with limited secondary spot trading, tokenized credit can still be used for lending and collateral. This represents a market use different from frequent spot turnover.
A lending strategy can operate on-chain but remains difficult for institutions to use. Public balances expose holdings, assets may need to move between different venues, and software must be able to discover and trade these assets.
Issuing a token does not guarantee it will be traded, have a broad holder base, or find utility in lending and settlement.
Part Three: How Institutions and Agents Use Tokenized Assets?
Agents Become Market Participants
A deeper transformation begins to occur when software can discover and trade the asset rights represented by tokens, institutions can use them without exposing sensitive holdings, and mature market infrastructure can identify and support their transfer across trading venues.
Virtuals announced that its AI Agent can access over 430 Ondo tokenized stocks through Treasures on Ethereum and Solana, but must comply with jurisdictional restrictions.
This announcement demonstrates access capability but does not indicate how many Agents have deployed capital or completed transactions. More important signals lie in the architecture: financial assets are being opened to software in machine-readable forms, allowing software to discover these assets and execute trades.
The payment layer is also synchronizing with the asset layer. According to Circle's data, the internet payment protocol x402 processed $24.2 million in transactions over 30 days ending April 29, 2026, with 99.8% of the amount settled in USDC.
Pay.sh provides another example: software can use stablecoins to pay for API access per request.
After the end of the first half, Franklin Templeton presented a broader institutional perspective on July 21, stating that autonomous systems will require programmable payments, verifiable identities, contract execution, auditability, and digital assets.
Blockchain can support autonomous contracts, verifiable Agent identities, auditable activities, decentralized computing power and data access, and rapid settlement, thus playing a key role in the process of Agent AI realizing consumer transaction potential. The growth of Agent AI is likely to become a "killer application" driving blockchain adoption.
Sandy Kaul, Executive Vice President and Head of Digital Assets and Innovation at Franklin Templeton
Tokenization can become the infrastructure for software-driven business activities, allowing funds, ownership, permissions, collateral, and settlement to exist within the same programmable environment as Agent activities.
Institutional Markets Need Privacy and Shared Infrastructure
Institutional adoption also relies on providing appropriate confidentiality for balances, holdings, and transactions.
At the end of the first half, Zama, Morpho, and Steakhouse Financial launched a confidential USDC Vault that integrates crypto deposits into existing Morpho lending strategies while protecting individual balance and holding privacy.
The underlying lending strategy uses crypto asset collateral, thus this is a case of privacy infrastructure rather than RWA-supported lending. It demonstrates how to keep individual holdings confidential within an auditable lending system.
Meanwhile, DTCC is pushing tokenization closer to existing market infrastructure. Its roadmap for the first half includes a working group of over 50 companies preparing for small-scale formal environment trading and planned service launches, explicitly identifying cross-chain interoperability as a goal.
The formal operational milestone achieved on July 15 is significant because multi-chain distribution is not just about choosing which chain to deploy on. When assets move between traditional trading venues and blockchain trading venues, ownership, custody, settlement, liquidity, and corporate actions must remain synchronized.
The Computing Power Market Points to a Machine Economy
Once software can hold funds and trade tokenized rights, the range of assets covered will extend beyond financial securities.
Computing power is an early example, as it is both a scarce real resource and a factor of production that software can directly consume.
After the quarter ended, Datavault AI announced plans to issue tokens representing access and usage rights to a proposed edge computing network. This announcement does not prove that the market is operational but showcases a possible direction: software purchasing, allocating, and settling the resources it needs through programmable markets.
The same logic can extend to energy, data access, and other measurable resources. The computing power market remains a frontier worth observing until tokenized usage rights can correspond to real available computing power and measurable consumption.
Tokenized Funds Access Traditional Distribution Networks
Oasis Pro Markets, a subsidiary of Ondo, is a registered broker-dealer and distributor of tokenized investment products in the United States, and has now joined DTCC's Fund/SERV, becoming the first tokenized platform to access this network.
This network handles over 85% of mutual fund trading activity in the U.S. After joining Fund/SERV, Oasis Pro Markets gained access to the core operational infrastructure of the U.S. fund industry, filling a critical gap for scaling tokenized funds and moving towards mainstream applications.
It no longer needs to establish custom connections for each fund but can trade with fund companies, wealth management platforms, and service providers through a standardized interface, achieving interoperability in areas such as account-level data, trade confirmations, reconciliations, fund allocations, tax reporting, and regulatory reporting.
This paves the way for Ondo tokenized funds to reach traditional fund distributors already connected to this network and promotes the strategy proposed by DTCC to support tokenized assets and facilitate interoperability between traditional and digital financial ecosystems.
Investors Focus on Real Demand, Liquidity, and Available Infrastructure
At the tokenization online seminar held by Pantera in June, recurring questions from participants included: which assets have real demand, how licensed products reach buyers, and where liquidity and practical infrastructure will come from.
These questions correspond to the practical gaps that tokenization still needs to address. Issuing a token does not guarantee it will be traded, have a broad holder base, or find utility in lending and settlement. Privacy, shared infrastructure, and programmable access only make sense when they help bridge these gaps.
Evaluating Agent's asset access should focus on transactions and reuse supported by actual funds, rather than the number of qualified Agents.
Confidential finance requires ongoing deposits and credit flows. DTCC's work needs to achieve asset transfers in formal environments and cross-venue interoperability. Computing power tokens need to be linked to real production capacity rather than merely driven by announcements.
If these systems can bring about sustained, recurring economic activity, blockchain can become the coordinating layer between institutions and autonomous software. If not, tokenization will still primarily be a new form of distribution, with little change in the underlying market operations.
The Next Phase of Opportunities for Institutions
Tokenization can expand financial participation channels in various ways: active on-chain markets provide price exposure, platforms targeting individual users distribute tokenized products, and lending markets provide financing for tokenized collateral. These uses also impose different requirements on participating institutions.
Yield-generating products require reliable redemption and efficient service; trading assets need competitive execution conditions and market maker support; collateral requires reliable valuation, financing, and settlement arrangements.
Privacy and interoperability can help institutions provide these services across venues, while programmable access extends the service targets from humans to software.
The next phase of tokenization will be realized by connecting products to these practical uses. The opportunities for banks, asset management companies, and wealth management platforms lie in combining the distribution capabilities and programmability of blockchain with the market infrastructure that clients are already accustomed to and expect.
 Risk warning




Popular articles