CICC: The American AI in the "Cotton Candy" Era
 Core Viewpoint

 CICC believes that the U.S. AI industry is currently in the "financial cotton candy" era, with rapid growth in capital expenditure. Corporate financing is gradually shifting from operating cash flow to external debt financing, and private credit and asset securitization have also become important sources of funding. Compared to the tech bubble and the financialization of real estate, the current financialization of AI is still in its early stages. However, high oil prices, interest rate hike risks, and tightening financing conditions may still exacerbate short-term liquidity fluctuations.
Source: CICC; Authors: Zhang Wenlang, Huang Yadong, Zhou Peng
In the past two months, the U.S. stock market has experienced significant volatility, which has also affected other regions. The fluctuations in the U.S. stock market are influenced by changes in monetary policy and concerns about the sustainability of capital expenditure in the AI sector, with the former exacerbating the latter. In short, several major companies in the U.S. AI field have seen a rapid increase in capital expenditure this year, and while the growth rate may slow down next year, it will still be relatively fast. On the other hand, AI companies face considerable uncertainty regarding their revenues, and operating cash flow has become comparable to capital expenditure, leading some companies to start issuing bonds to support capital expenditure. The rise in U.S. Treasury yields has further intensified market concerns: how to maintain capital expenditure in the face of uncertain revenues is a topic of widespread interest.
Chart 1: U.S. AI Companies' Capital Expenditure Comparable to Operating Cash Flow
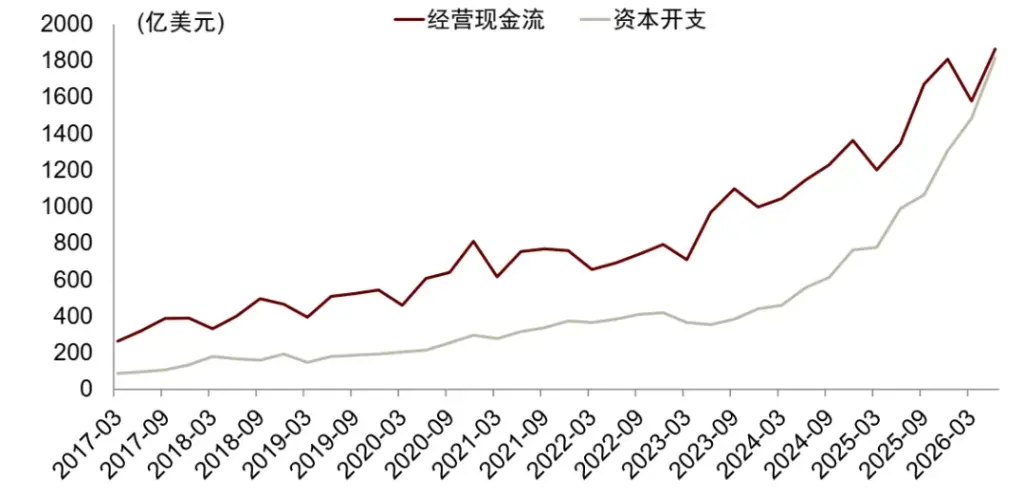
Note: The data in the chart is the sum of Microsoft, Amazon, Google, Meta, and Oracle
Source: Epoch AI, Bloomberg, iFinD, CICC Research Department
AI is an emerging industry, and its technological breakthroughs and commercial revenue growth are inherently difficult to predict. We will not focus on revenue but will choose to explore the potential sources of funding for U.S. AI capital expenditure from the perspective of capital allocation. In fact, investment is the source of revenue; if capital expenditure is difficult to secure, revenue growth will lack support. In other words, capital expenditure and revenue are not two variables that are mutually exclusive. Therefore, discussing the financing situation of capital expenditure also helps us assess the prospects for revenue.
We will first analyze the advantages of the AI industry in attracting funds based on its attributes. In the second part, we will analyze the changes in the supply of funds in American society since the 1990s. Specifically, we will dissect how the "financialization" of the U.S. has reshaped its liquidity. "Financialization" does not have a unified definition, and its manifestations are quite complex, but we believe at least two points are meaningful for analyzing AI financing. From a macro perspective, financialization means an increase in the ratio of broad liquidity to GDP, which simply means that the "money" in society is gradually increasing. From a micro perspective, financialization means an increase in the number and variety of new financial products. Financial products (such as derivatives) make funds "active" and also enhance the liquidity of assets. Of course, the macro and micro levels are not separate; the increase in the number of financial products may also lead to an increase in macro-level liquidity.
Gillian Tett, the Dean of King's College, Cambridge, and a senior journalist at the Financial Times, has explained the phenomenon of financialization in the U.S. in her book "Welcome to the Financial Cotton Candy Era," and reviewed the origin of the term "financial cotton candy." Therefore, we might as well borrow the vivid term "financial cotton candy" to approximate the financialization of the U.S.[1]
Although the U.S. has strengthened financial regulation, especially for banks, after the 2008 subprime mortgage crisis, the overall phenomenon of financialization has not significantly reversed. On this basis, we review the financialization before the two bubbles burst in the U.S. since 1990: the financialization of the tech bubble in the 1990s and the financialization of real estate before the subprime mortgage crisis. We then analyze the current stage of financialization in the U.S. AI industry and finally examine the liquidity risks that the current U.S. AI sector may face.
AI: Both Technological and "Real Estate-like" Attributes
We believe that AI has both technological attributes and "real estate-like" attributes (a high proportion of fixed assets), meaning it can be financed through both equity and debt (mortgages).
The technological attributes of AI need no elaboration, as its technological advancements and productivity improvements seem to be faster than those of tech companies. One manifestation is that AI relies less on labor than tech companies and can even replace labor. From a macro perspective, since the release of ChatGPT in 2022, non-farm employment in the U.S. telecommunications and computer industries has slightly decreased by 6%. In contrast, from August 1995, when Netscape went public (the beginning of the tech bubble), to March 2000, when the tech bubble burst, non-farm employment in the telecommunications and computer industries increased by more than 60%.
Chart 2: Divergence in Employment Trends in U.S. Telecommunications and Computer Industries During the Tech Revolution and the AI Era
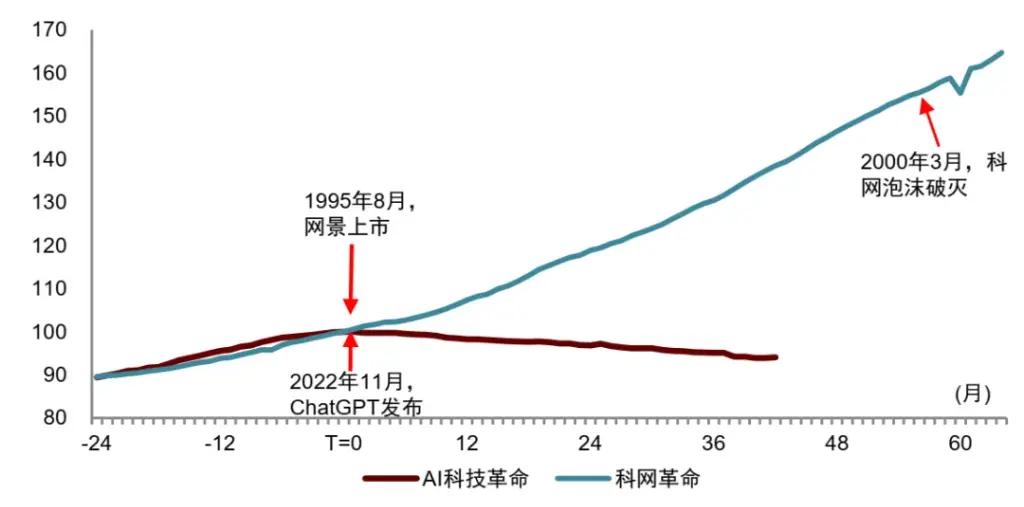
Note: The AI technological revolution is marked by the release of ChatGPT (November 2022) as T=0, and the tech revolution is marked by the IPO of Netscape (August 1995) as T=0. Non-farm employment includes telecommunications, data processing, and computer systems design industries, with data standardized.
Source: iFinD, CICC Research Department
From a micro perspective, if we set the labor density index (the ratio of employees to fixed assets) of Google, Microsoft, and Meta in 2021 to 100, the index was 109 in 2019 and is projected to drop to 37 by 2025. Specifically, their fixed asset index rose from 100 in 2021 to 306 in 2025, while their employee index only rose to 112.
Chart 3: Labor Density of Three Major U.S. Tech Companies
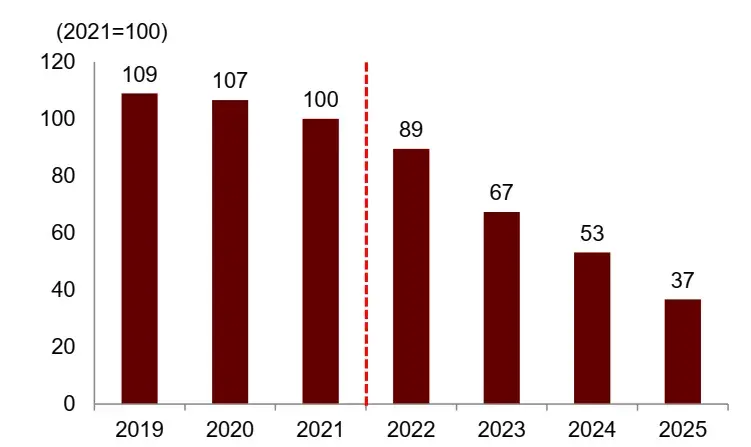
Note: The major tech companies in the chart include Google, Microsoft, and Meta. Labor density is measured using the number of employees/fixed assets.
Source: iFinD, CICC Research Department
Chart 4: Growth of Fixed Assets of Three Major U.S. Tech Companies Outpacing Employee Numbers
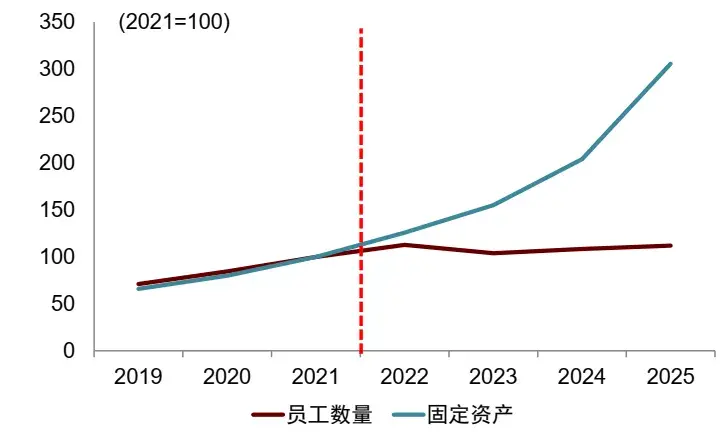
Note: The major tech companies in the chart include Google, Microsoft, and Meta.
Source: iFinD, CICC Research Department
During the tech revolution, for example, Microsoft saw both fixed asset investment and employee numbers increase, with employee numbers growing faster, driving up labor density. Even after the tech bubble burst in 2000, corporate labor density continued to rise. If we set Microsoft's labor density index in 1995 to 100, it was 138 in 2000 and further rose to 174 in 2005. Specifically, its employee index rose from 100 in 1995 to 220 in 2000 and 343 in 2005, while its fixed asset index only rose from 100 to 197.
Chart 5: Microsoft's Labor Density Trends (1995-2005)
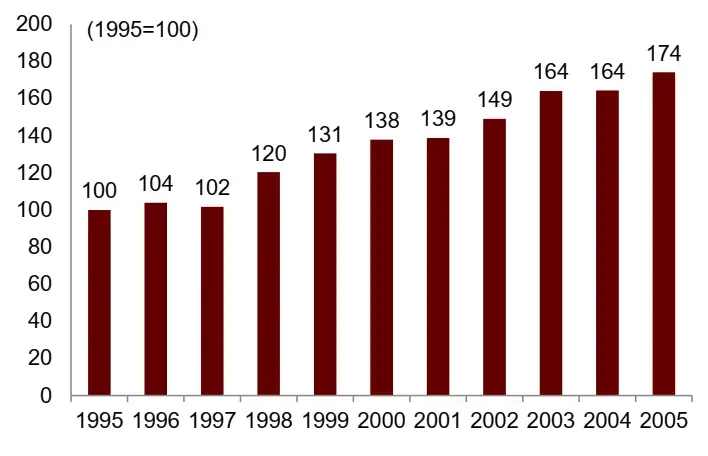
Note: Labor density is measured using the number of employees/fixed assets.
Source: iFinD, CICC Research Department
Chart 6: Trends in Microsoft's Employee Numbers and Fixed Assets
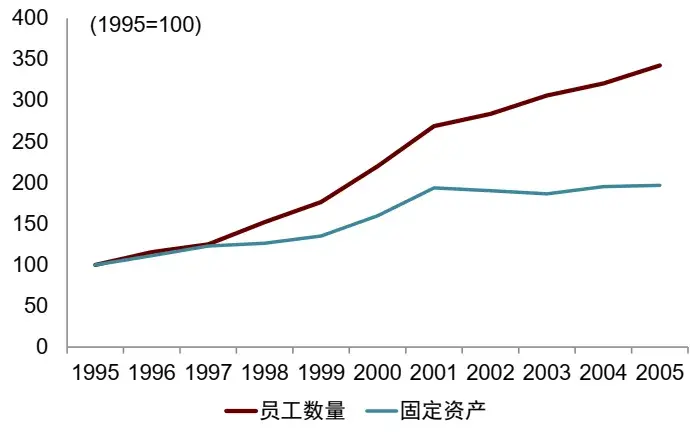
Source: iFinD, CICC Research Department
In terms of inflation-adjusted per capita revenue, AI companies currently generate more than twice the revenue of traditional internet companies, reflecting higher efficiency in AI companies. For example, in 2026, the per capita revenue of Anthropic is expected to be about 100 times that of the U.S. per capita GDP, while OpenAI and NVIDIA may be around 63 and 57 times, respectively. In 2025, the ratios for Meta, Apple, Google, and Microsoft are expected to be 28, 28, 23, and 14 times, respectively. In 1999, the ratios for Apple, Microsoft, and Cisco were 26, 18, and 16 times, respectively.
Chart 7: Ratio of Per Capita Revenue of Tech Companies to U.S. Per Capita GDP
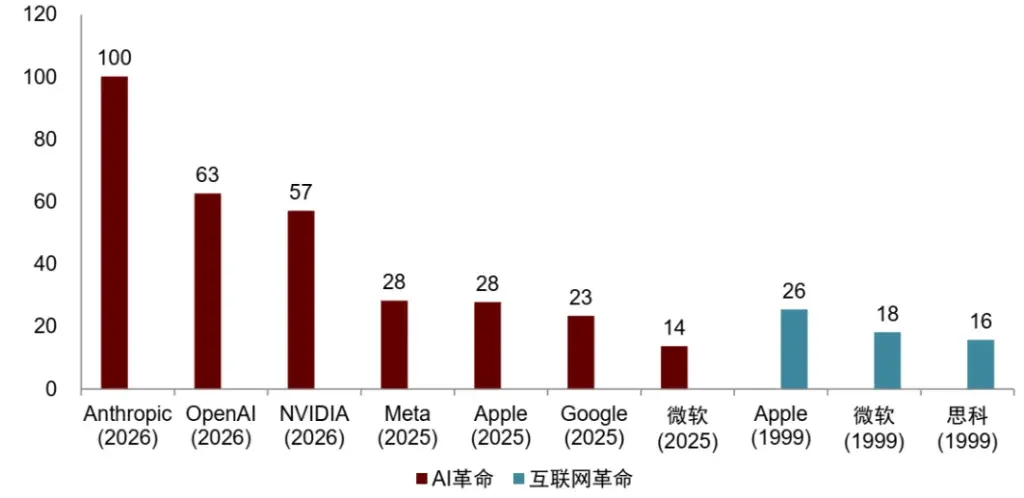
Source: iFinD, Epoch AI, CICC Research Department
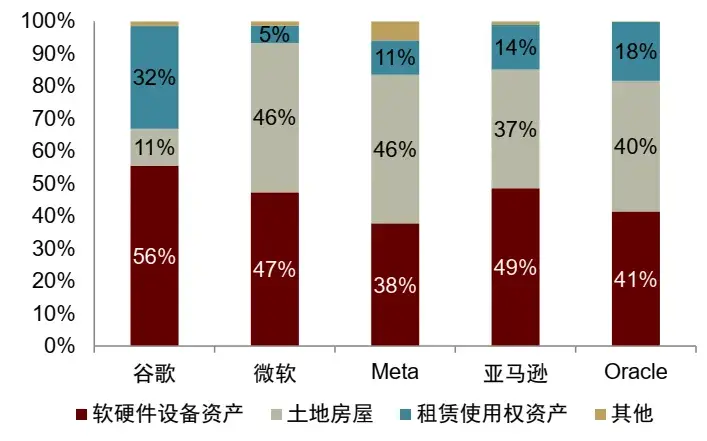
The reason we say that U.S. AI companies also have "real estate-like" attributes is that they have a high proportion of fixed assets. For instance, the average proportion of fixed assets to total assets for the five cloud vendors—Microsoft, Alphabet, Amazon, Meta, and Oracle—exceeds 40%, while the average for four traditional companies—Walmart, ExxonMobil, Procter & Gamble, and Caterpillar—is currently 37%. The average proportion of fixed assets for tech companies (Microsoft, Cisco, Amazon, WorldCom, and Lucent) during the tech revolution in 2000 was only 15%. Among fixed assets, Microsoft and Meta's land and buildings account for 46%, while Amazon and Oracle's land and buildings account for 37% and 40%, respectively, with Google having the lowest proportion (11%). The proportions of hardware and software assets among these companies are 47%, 38%, 49%, 41%, and 56% of fixed assets, respectively.
Chart 8: Current High Proportion of Fixed Assets in AI Companies
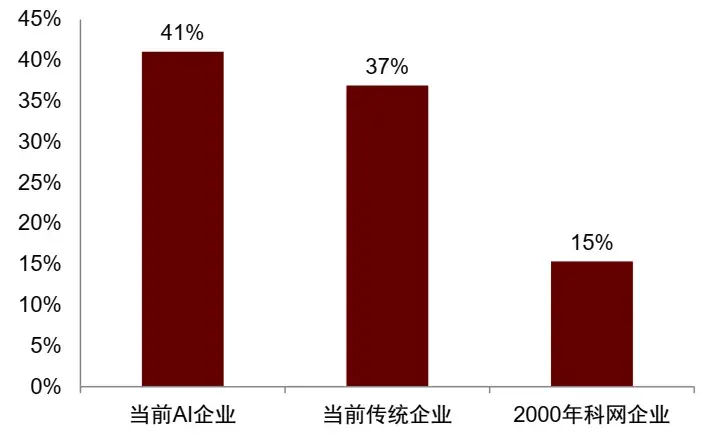
Note: Each group calculates the ratio separately and then averages. AI companies include Microsoft, Alphabet, Amazon, Meta, and Oracle; traditional companies include Walmart, ExxonMobil, Procter & Gamble, and Caterpillar; tech companies include Microsoft, Cisco, Amazon, WorldCom, and Lucent. AI companies use the latest available Q2 2026 reports or annual reports, traditional companies use the latest annual reports; tech companies use FY2000 annual reports.
Source: iFinD, Wind, Bloomberg, CICC Research Department
Chart 9: Breakdown of Fixed Assets of Five U.S. AI Companies
Note: Using the latest available Q2 2026 reports or annual reports.
Source: iFinD, Wind, Bloomberg, CICC Research Department
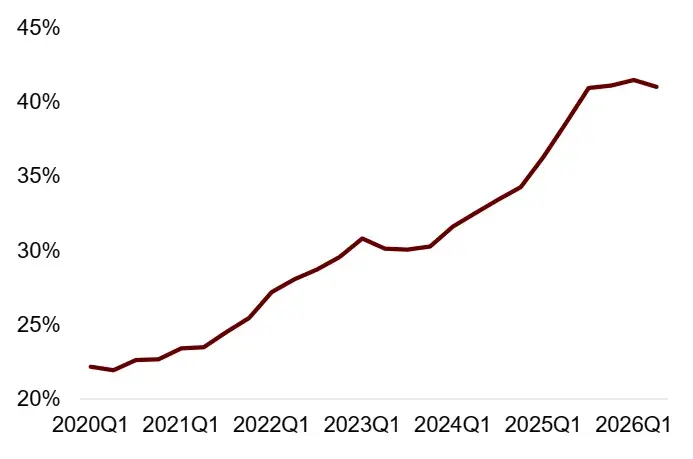
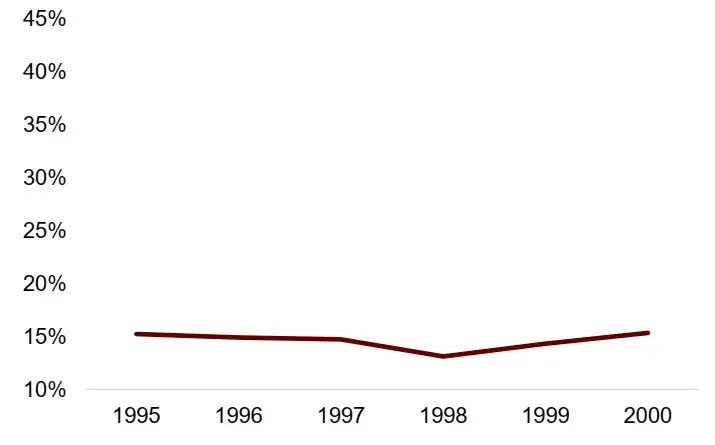
Dynamically, the proportion of fixed assets to total assets for these companies has generally risen from 22% in 2020 to 41% in 2025, while the proportion of fixed assets to total assets for the five tech companies remained around 15% from 1995 to 2000.
Chart 10: Rising Proportion of Fixed Assets in AI Companies
 Note: Each group calculates the ratio for sample companies separately and then takes a simple average. AI companies include Microsoft, Alphabet, Amazon, Meta, Oracle.
Source: iFinD, Wind, Bloomberg, China International Capital Corporation Research Department
Chart 11: The proportion of fixed assets in tech companies remains basically unchanged.
Note: Each group calculates the ratio for sample companies separately and then takes a simple average. Tech companies include Microsoft, Cisco, Amazon, WorldCom, Lucent.
Source: iFinD, Wind, Bloomberg, China International Capital Corporation Research Department
Financialization Enhances Liquidity
Financialization does not have a unified definition. We might as well quote Epstein (2005): financial purposes, financial markets, financial entities, and financial institutions play an increasingly important role in domestic and international economic operations[2]. The implied meaning of this definition is that the role of finance in resource allocation is rising.
Different schools of thought have different views on the driving factors of financialization[3]. New Marxism believes that the decline in the return on capital investment in the real economy after the 1970s, along with excess capital flowing into financial speculation, is the main cause of capitalist financialization. Post-Keynesianism argues that the shift in corporate governance towards prioritizing shareholder value leads to reduced real investment and increased stock buybacks and financial asset allocation, resulting in financial investment crowding out real capital accumulation. Neoclassicism, on the other hand, believes that financial liberalization and asset securitization enhance asset liquidity and optimize resource allocation, representing progress in economic development. Despite the different theoretical understandings of the development of financialization, Luo Yu (2017) believes that the collapse of the Bretton Woods system and the global shift to a pure credit monetary system undoubtedly created conditions for financialization. Specifically, he argues that in terms of payment media, the proportion of physical cash has significantly decreased, transactions have shifted to digital transfers between accounts, transaction costs have declined, and transaction volumes have increased. In terms of value storage, various financial assets have played the role of "quasi-money" for value storage, broadening the boundaries of broad money[4].
The main manifestations of financialization include the following aspects[5]: (1) Broader overall liquidity. For example, the ratio of broad liquidity to GDP has increased, the profit share of the financial sector has risen, and the scale of the financial sector has grown relatively faster. (2) Low liquidity assets have turned into high liquidity assets. Various new financial instruments have emerged, and securitization has transformed illiquid assets into liquid assets, significantly increasing the scale of financial transactions. (3) The acquisition of capital profits increasingly relies on financial channels rather than real trade and commodity production. For instance, corporate profits are more dependent on investment returns. (4) The discourse power of capital market-based financial systems continues to expand. For example, the ratios of stock market/GDP and debt/GDP are continuously rising, while the ratio of bank credit/GDP is declining. (5) Greater emphasis on shareholder value in corporate governance. For example, stock buybacks have increased in the U.S. stock market.
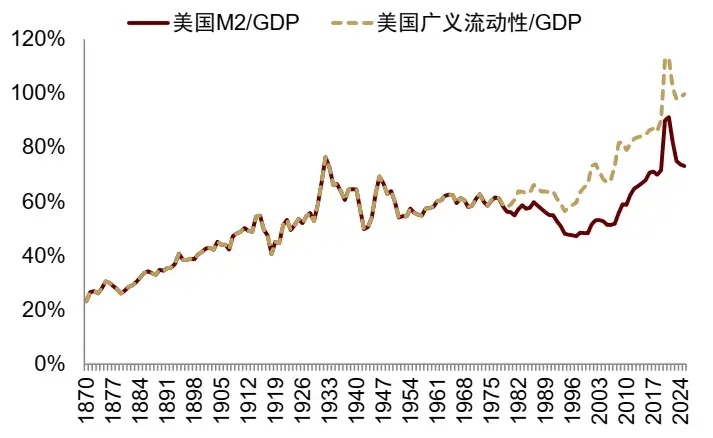
From a macro perspective, since the mid-1990s, the ratio of broad liquidity to GDP in the United States has been on an upward trend, approximately 20 percentage points higher than the ratio of M2 to GDP. After the financial crisis, the U.S. strengthened financial regulation, and the loan business of U.S. banks slowed down relatively, but the ratio of bank assets to GDP did not shrink, and non-loan business in the banking sector continued to expand.
Chart 12: The ratio of U.S. broad liquidity to GDP has risen
Note: Broad liquidity uses M2 + money market funds.
Source: iFinD, Jordà-Schularick-Taylor Macrohistory Database, China International Capital Corporation Research Department
Chart 13: The ratio of U.S. bank assets to GDP has not shrunk.
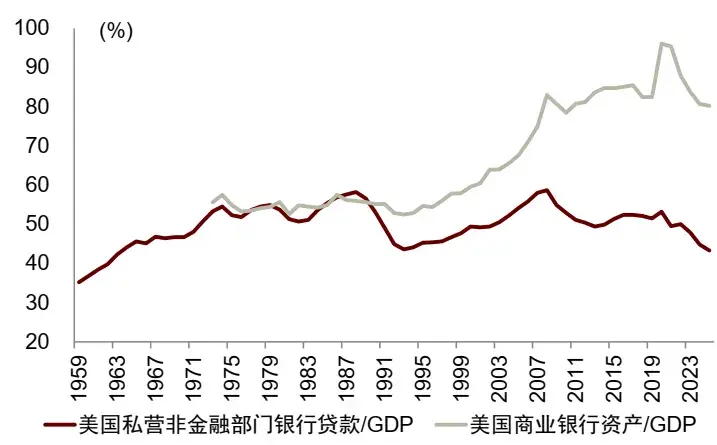
Source: iFinD, China International Capital Corporation Research Department
From a micro perspective, new financial products are constantly emerging. Data on non-financial corporate securities issuance in the U.S. from 1985 to 2014 indicates that the variety of financial products has continuously expanded. In 1985, there were about 150 types of financial products available in the market, which grew to 751 types by 2014, an increase of over 600 types. The proportion of financing through new financial products by non-financial enterprises has risen, exceeding 50% during the period from 2010 to 2014.
Chart 14: Financing methods of U.S. non-financial enterprises
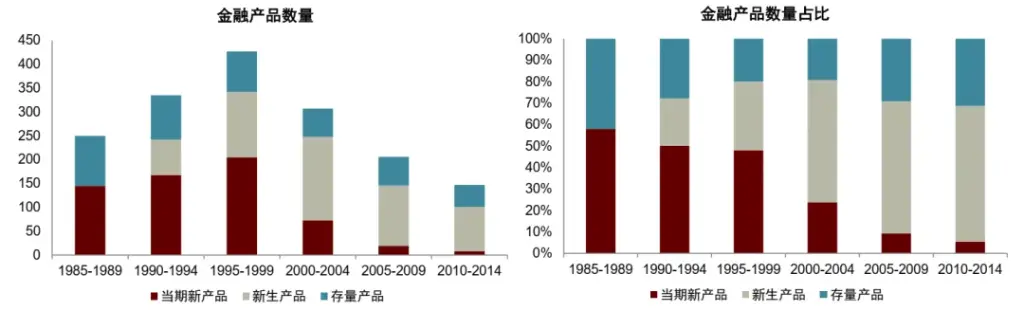
Note: The left chart shows the total number of different financial products from 1985-1989 to 2010-2014. The bar chart categorizes financial products into three types: (1) Existing products (Old): products launched before 1985; (2) Current new products (New-Entrants): products newly launched in the current period; (3) Newborn products (New-Young): products launched after 1985 but first issued in earlier periods. The right chart shows the changes in total financing amounts from 1985-1989 to 2010-2014. The bar chart further breaks down the financing scale into the issuance amounts of existing products, current new products, and newborn products.
Source: Ana Babus, Matias Marzani, and Sara Moreira, "The Rise of Specialized Financial Products," NBER Working Paper 34594 (2025), China International Capital Corporation Research Department
Other indicators are also of reference significance. For example, the number of U.S. mutual funds, futures, and options contracts has been continuously rising. The number of active futures and options contracts surged in 2025, primarily due to the growth of event contracts, such as the significant increase in contracts from event prediction platforms like Kalshi and ForecastEx. Event contracts are derivative contracts based on whether a specific event occurs or its outcome, commonly found in prediction markets, and can involve economic indicators, financial markets, weather, political events, etc. After the 2024 U.S. election, prediction markets gained significant traffic, driving the growth of event contracts.
Experiences of Financialization in U.S. Tech and Real Estate
Since the 1980s, the U.S. has experienced two accelerations of financialization: one is the tech financialization of the 1990s, and the other is the real estate financialization after 2000. The tech financialization of the 1990s was characterized by a significant increase in U.S. venture capital and a boom in equity financing, which enhanced the ways funds could be utilized and allowed capital to flow. An important driving factor of financialization during this phase was the relaxation of investment constraints on pension funds, which promoted the development of venture capital, provided exit channels through IPOs, released venture capital funds, and attracted more capital. The real estate financialization in the 2000s created new liquidity and increased the ways liquidity could be utilized, primarily manifested through securitization, which allowed real estate lending institutions to release capital, break through balance sheet constraints, form more loans, and create new liquidity. Securitization further enabled more financial institutions to participate in real estate financialization, increasing the methods of capital utilization.
U.S. corporate equity financing methods include private equity financing and public equity financing. In the startup phase, financing is mainly through private equity, and after reaching the growth phase, it shifts to public equity financing. After 1979, the U.S. relaxed restrictions on pension fund investments, leading to a significant increase in venture capital. Venture capital transformed "unsecured internet startups" into companies that could more easily secure financing, with IPOs providing exit channels to release funds tied up in equity, which then formed new investments. IPO exits also helped venture capital attract more funds.
Specifically, before 1979, the "Prudent-Man Rule" of the Employee Retirement Income Security Act of 1974 restricted U.S. pension funds from investing in startups. In 1979, the U.S. Department of Labor clarified the "Prudent-Man Rule," stating that pension funds should consider the risk diversification effect of the entire portfolio when making investment judgments, no longer requiring each project to have low risk. After the reform, pension funds could increase allocations to risk investments, leading to a large-scale entry of institutional limited partners, profoundly changing the funding source structure of the U.S. venture capital industry. The new scale and investment amounts of U.S. venture capital showed significant growth. From the perspective of U.S. venture capital funding sources, in 1978, only about 15% came from pension funds, while by 1990, about 53% came from pension funds. The fundraising and investment amounts of U.S. venture capital also began to grow rapidly in the 1990s.
Chart 15: Sources of U.S. venture capital funding
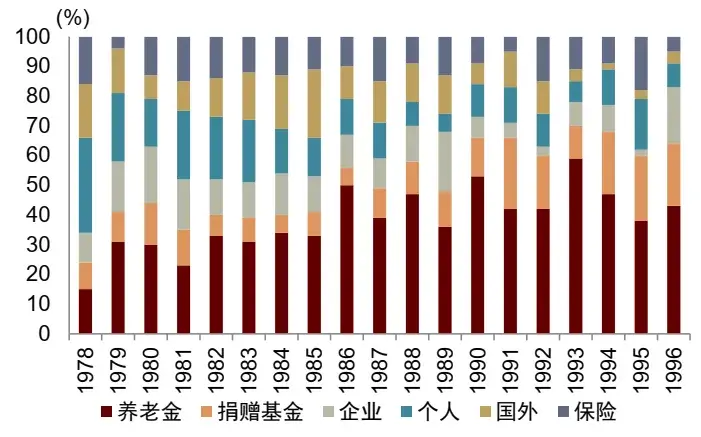
Source: Gompers & Lerner. 1998. What Drives Venture Capital Fundraising?, Nicole R. Onorato. 1997. Trends in Venture Capital Funding in the 1990s, China International Capital Corporation Research Department
Chart 16: U.S. venture capital fundraising and investment amounts
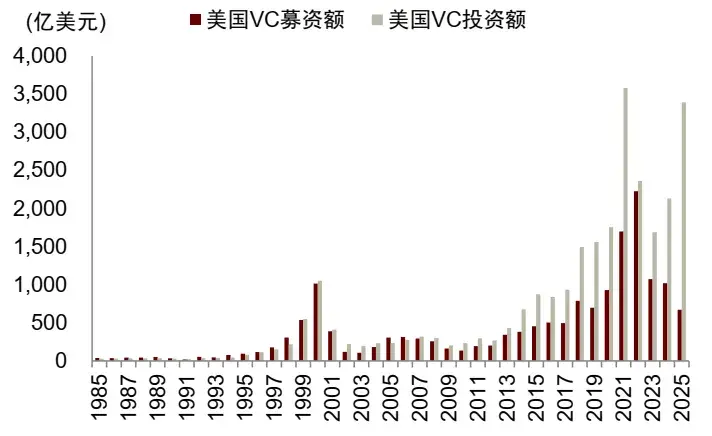
Source: National Venture Capital Report 2013 & 2023 & 2025, China International Capital Corporation Research Department
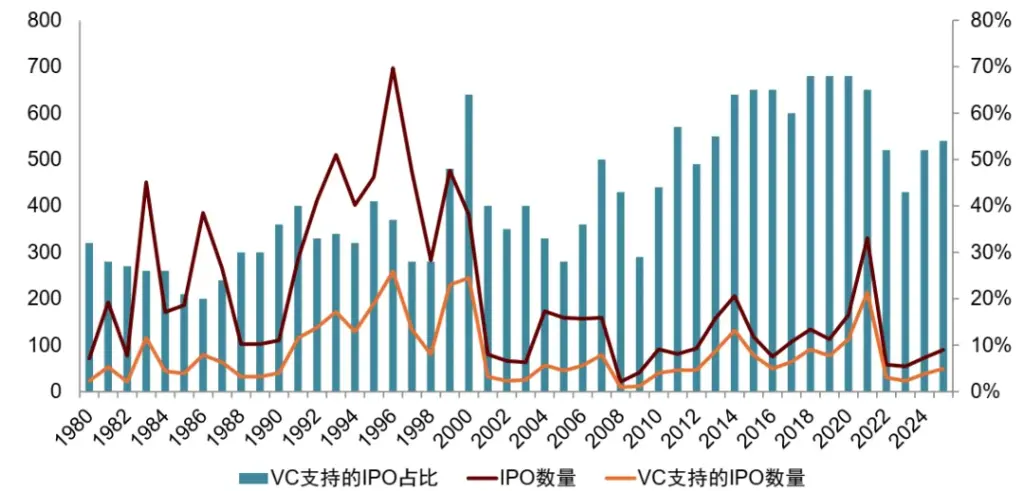
After funds flowed to venture capital, venture capital opened up equity financing channels for internet startups lacking physical collateral. Internet startups typically have light assets, many intangible assets, negative cash flow, no stable profits, and lack bank collateral, making it difficult to secure financing through traditional channels, thus relying solely on equity financing. In the 1990s, the number of IPOs in the U.S. increased, and the proportion of IPOs supported by venture capital rose, leading to a significant increase in equity financing.
Chart 17: After the 1990s, the rise of U.S. IPOs supported by venture capital.
 Source: Jay R. Ritter IPO Data, CICC Research Department
To achieve better exits, in the late 1990s, U.S. IPOs were issued at significant discounts, especially in the tech sector, to attract more investors. Newly established VC firms with little historical performance had strong incentives to push their portfolio companies to go public, accepting higher IPO discounts to create successful exit cases through first-day surges, showcasing performance to LPs, and facilitating the fundraising for the next VC fund. The returns from IPO exits in the late 1990s were very substantial, further stimulating LPs to invest heavily in VCs. However, as the volume of IPOs increased, the average quality of listed companies declined. The average age of VC-backed listed tech companies dropped from 9 years (1991) to 4 years (1999).
After 2000, the financialization of U.S. real estate revitalized existing assets through derivatives and was closely related to the expansion of broad money and debt financing. Various financial institutions transformed real estate assets into tradable, collateralizable, and leveraged financial assets through asset securitization, connecting the real estate market with capital markets, the banking system, and the shadow banking system. The primary role of mortgage-backed securities (MBS) securitization was to revitalize existing credit assets, making the original currency more active and increasing the velocity of money circulation; at the same time, banks could continue to issue new loans to households after recouping funds, leading to broad money expansion through the commercial banking credit derivation mechanism.
Methods to revitalize existing assets include credit enhancement, resecuritization, and adding "insurance" to mortgages, turning originally illiquid assets into liquid assets. Credit enhancement has about three methods: (1) Tranching, which converts mortgages into securities of different risk levels to meet the needs of different investors; (2) Over-collateralization: the size of the asset pool exceeds the total principal of all securities issued, with the excess portion serving as over-collateralization to absorb losses; (3) Excess spread: the mortgage interest rate is higher than the MBS interest rate, ensuring a positive spread.
Collateralized Debt Obligation (CDO) further securitizes and tranches MBS backed by subprime loans into different grades of securities. Additionally, Credit Default Swap (CDS) adds a layer of "insurance" to mortgages, further enhancing their liquidity.
Data shows that after the 1980s, the ratio of loans to GDP in the U.S. rose significantly, with residential real estate loans increasing the most. In 1995, the ratio of residential mortgage loans to GDP was less than 50%, while by 2007, it exceeded 80%. From 2001 to 2006, the securitization ratio of U.S. mortgages rose sharply, especially for lower-quality Alt-A and Sub-prime mortgage securities. For example, the securitization ratio of Alt-A mortgages rose from 19% (2001) to 91% (2006), and the securitization ratio of Sub-prime mortgages rose from 46% (2001) to 75% (2006).
U.S. mortgage holders shifted from banks to non-banks. Early U.S. residential securitization was mainly participated in by government-supported institutions like Fannie Mae, Freddie Mac, and Ginnie Mae, while more non-government-supported institutions (including investment banks) began to participate in mortgage securitization later. Through securitization, government-supported institutions (like Fannie Mae and Freddie Mac) and ABS issuers held over 60% of the market share by 2006.
The Financialization of AI in the U.S. is Still in Its Early Stages
The cash flow of major AI companies in the U.S. has just turned positive and is starting to shift towards external financing. The investment expenditure/revenue ratio of representative AI companies in the U.S. rose from about 10.3% in 2020 to about 32.8% in 2025, further increasing to about 51.7% in Q2 2026, surpassing the highs of the tech revolution period. In terms of sources of investment expenditure, the operating cash flow/revenue ratio of AI companies remains above 40%, while the fundraising cash flow/revenue ratio shifted from about -7% in 2025 to about 16.2% in Q2 2026.
Chart 18: Sources of Investment Expenditure for AI Companies
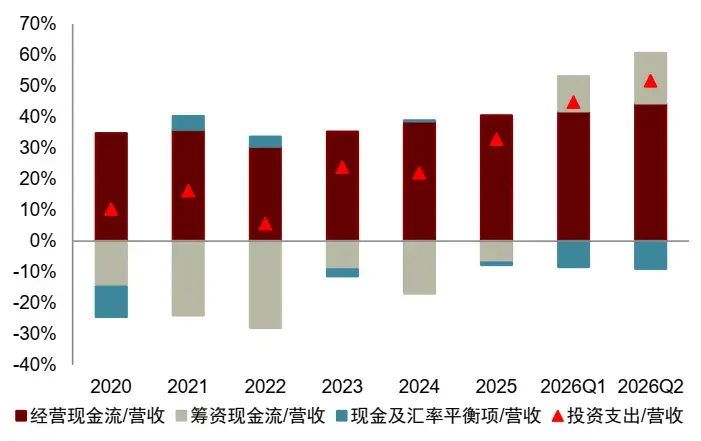
Note: Each group calculates the cash flow/revenue ratio for sample companies and then averages them. AI companies include Microsoft, Alphabet, Amazon, Meta, and Oracle. AI companies' data for 2020-2025 are annual reports, while Q1 and Q2 2026 use the total of the past four quarters up to the respective quarter to mitigate seasonal effects.
Source: Wind, Bloomberg, CICC Research Department
Chart 19: Sources of Investment Expenditure for Tech Companies
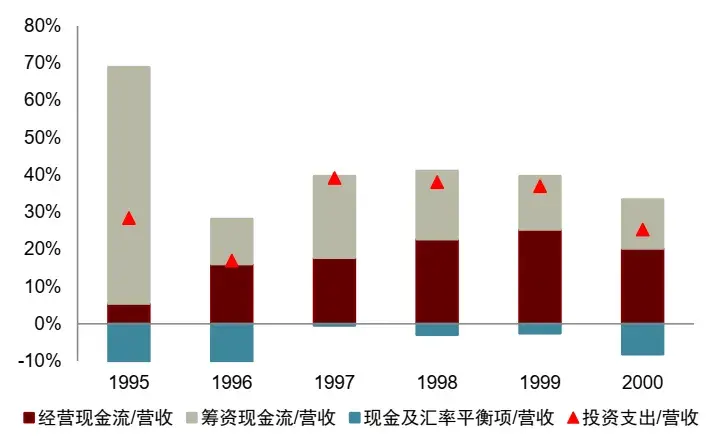
Note: Each group calculates the cash flow/revenue ratio for sample companies and then averages them. Tech companies include Microsoft, Cisco, Amazon, WorldCom, and Lucent.
Source: Wind, Bloomberg, CICC Research Department
Currently, the incremental external financing for AI companies mainly comes from debt financing, while equity financing has not yet started on a large scale. In Q2 2026, the net fundraising cash flow/revenue ratio for AI companies rose to 16.2%, higher than that of tech companies in 2000 (13.2%). Among them, the net debt financing/revenue ratio was 21.2%, and the net equity financing/revenue ratio narrowed to -3.3%, while at that time, tech companies had net inflows from both debt and equity financing. In comparison, the current round of AI financing expansion is more concentrated on the debt side, with equity financing reflecting net buybacks. If debt financing costs rise in the future, AI companies may turn to equity financing.
Chart 20: Sources of Fundraising Cash Flow for AI Companies
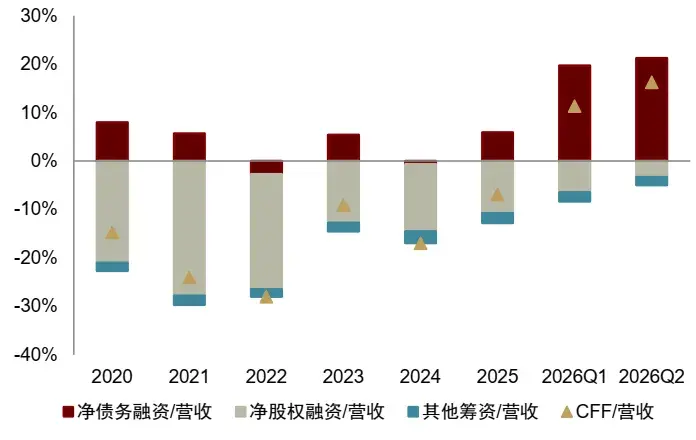
Note: Each group calculates the cash flow/revenue ratio for sample companies and then averages them. Net debt financing = debt increase/issuance - debt decrease/repayment; net equity financing = equity increase/issuance - equity decrease/repurchase - dividends paid; other fundraising = CFF - net debt financing - net equity financing. AI companies include Microsoft, Alphabet, Amazon, Meta, and Oracle. AI companies' data for 2020-2025 are annual reports, while Q1 and Q2 2026 use the total of the past four quarters up to the respective quarter to mitigate seasonal effects.
Source: Wind, Bloomberg, CICC Research Department
Chart 21: Sources of Fundraising Cash Flow for Tech Companies
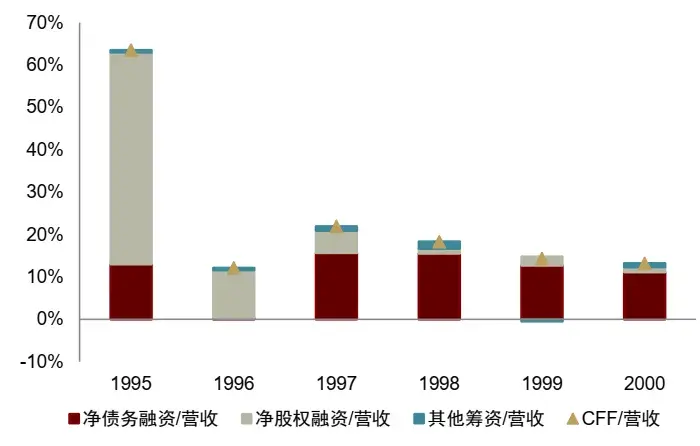
Note: Each group calculates the cash flow/revenue ratio for sample companies and then averages them. Net debt financing = debt increase/issuance - debt decrease/repayment; net equity financing = equity increase/issuance - equity decrease/repurchase - dividends paid; other fundraising = CFF - net debt financing - net equity financing. Tech companies include Microsoft, Cisco, Amazon, WorldCom, and Lucent. The significantly high average net equity financing/revenue ratio for tech companies in 1995 was mainly influenced by Amazon's relatively small revenue base that year.
Source: Wind, Bloomberg, CICC Research Department
According to Dealogic data, as of June 2026, AI companies (Alphabet, Amazon, Meta, Microsoft, and Oracle) issued $159 billion in bonds globally, compared to $108 billion for the entire year of 2025 and only $17 billion for the entire year of 2024. The total liabilities of these five AI companies have significantly increased since Q4 2025, with a quarterly increase of $211.5 billion in Q2 2026. Marginally, the growth of short-term debt in Q2 2026 was more pronounced, while the growth of long-term debt slowed, increasing the companies' debt repayment pressure.
Chart 22: Significant Increase in Bond Issuance by U.S. AI Companies
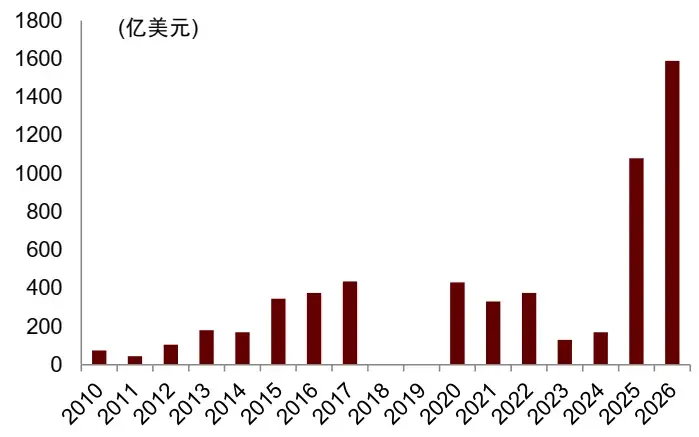
Note: Corporate bond issuance data includes Google, Amazon, Meta, Microsoft, and Oracle. Corporate bond issuance data for 2026 is as of June 5, 2026.
Source: WSJ, Dealogic, iFinD, Bloomberg, CICC Research Department
Chart 23: Composition of Debt for U.S. AI Companies
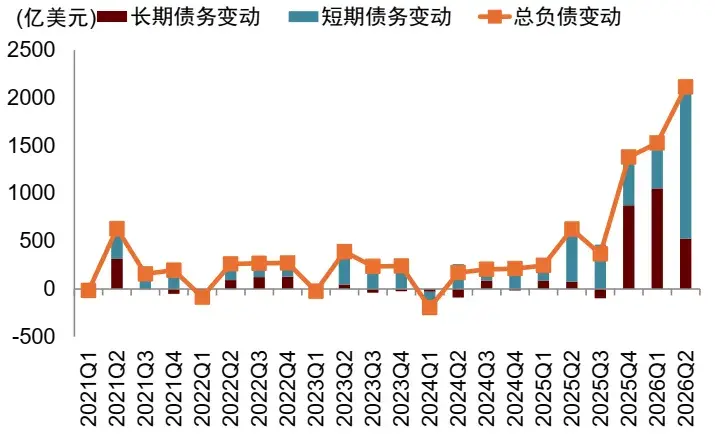
Note: AI companies include Google, Amazon, Meta, Microsoft, and Oracle.
Source: iFinD, CICC Research Department
Private credit has become an important source of off-balance-sheet financing for U.S. AI companies. Private credit is gradually replacing traditional bank loans to support long-cycle AI infrastructure investments. Due to the large scale of AI project investments and long payback periods, traditional banking systems have limited risk appetite, leading large private credit institutions like Apollo, Ares, Blackstone, and Blue Owl to become key funding providers. According to BIS estimates, private credit loans to AI-related companies have grown to over $200 billion, accounting for nearly 8% of total private credit. About 20% of private equity funds currently involve AI loans. Private credit funds mainly flow into data center SPVs, CoreWeave, and other computing power operators and GPU financing platforms, using stable cash flows generated from long-term contracts with M7 as repayment support, effectively shifting funding sources from the banking system to the non-bank financial system, functioning similarly to banks.
Chart 24: Rapid Growth of Direct Loans from Private Credit to U.S. AI Companies
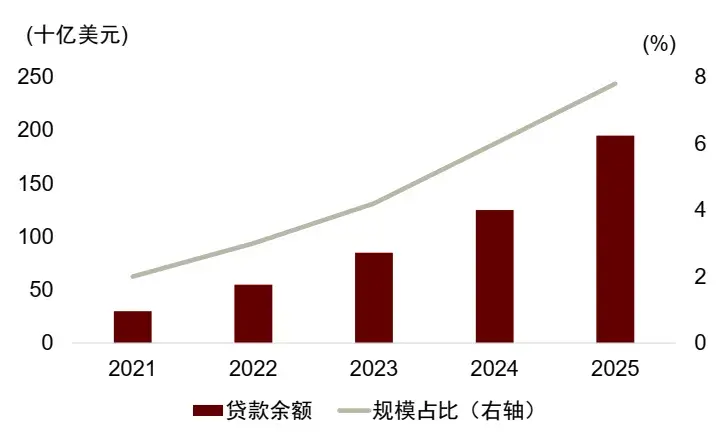
Source: Aldasoro, Iñaki, Sebastian Doerr, and Daniel Rees. Financing the AI boom: from cash flows to debt. No. 120. Bank for International Settlements, 2026, CICC Research Department
Chart 25: Increase in the Proportion of Private Credit Involving AI Loans
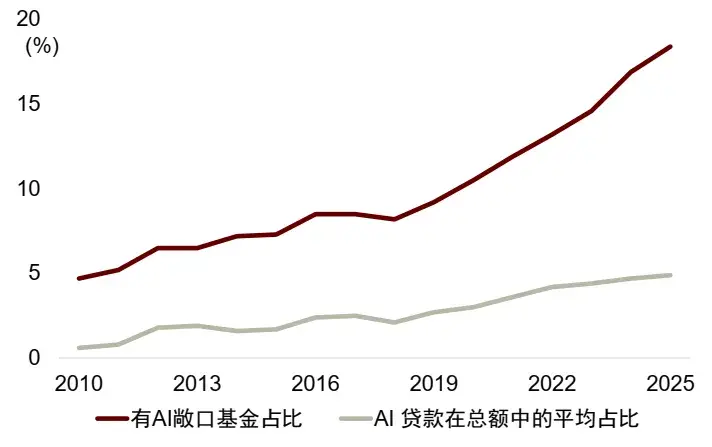 Source: Aldasoro, Iñaki, Sebastian Doerr, and Daniel Rees. Financing the AI boom: from cash flows to debt. No. 120. Bank for International Settlements, 2026. China International Capital Corporation Research Department
Currently, AI companies do not face significant debt pressure, and there is still room for debt financing. The five major cloud computing companies in the United States have sufficient operating cash flow, and their overall debt repayment capacity is robust. The cash flow interest coverage ratios are all above 1, with Oracle at the lowest around 7 times, followed by Amazon at about 48 times, and Google at the highest around 82 times. The debt repayment rates are all below 1, with Oracle at about 48%, Amazon at about 12%, and Google at the lowest at only about 6%.
Chart 26: Debt repayment rates of the five major cloud companies in the United States (Present value of debt principal and interest / Operating cash flow)
Source: Aldasoro, Iñaki, Sebastian Doerr, and Daniel Rees. Financing the AI boom: from cash flows to debt. No. 120. Bank for International Settlements, 2026. China International Capital Corporation Research Department
Currently, AI companies do not face significant debt pressure, and there is still room for debt financing. The five major cloud computing companies in the United States have sufficient operating cash flow, and their overall debt repayment capacity is robust. The cash flow interest coverage ratios are all above 1, with Oracle at the lowest around 7 times, followed by Amazon at about 48 times, and Google at the highest around 82 times. The debt repayment rates are all below 1, with Oracle at about 48%, Amazon at about 12%, and Google at the lowest at only about 6%.
Chart 26: Debt repayment rates of the five major cloud companies in the United States (Present value of debt principal and interest / Operating cash flow)
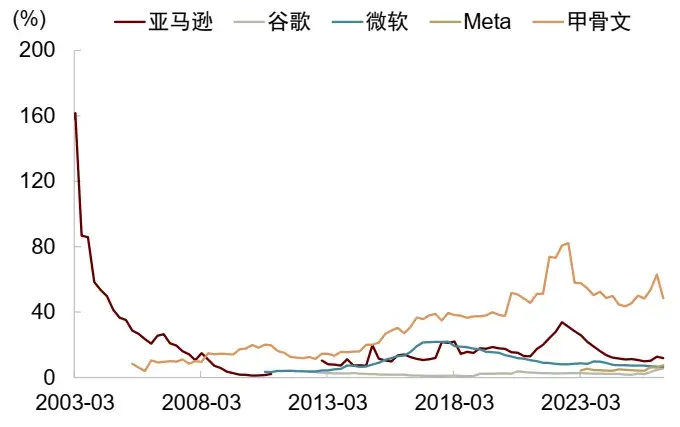 Note: Calculated according to the BIS debt repayment rate formula
Source: Bloomberg, China International Capital Corporation Research Department
The effective interest rates of the five major cloud computing companies in the United States are currently not high, and the net cash reserve situation is differentiated. In Q2 2026, the effective interest rate for the five major cloud companies was 4.9%, lower than the Baa-rated corporate bond yield. The financing costs for the five major cloud companies are still not high, partly due to the "locking in" of rates in the previous low-interest-rate environment and issuing bonds in non-U.S. currencies. In terms of net cash reserves, Google, Microsoft, and Meta are relatively better off, while Amazon and Oracle have negative net cash, indicating a higher reliance on external financing.
Chart 27: Effective interest rates of the five major cloud companies in the United States are still not high
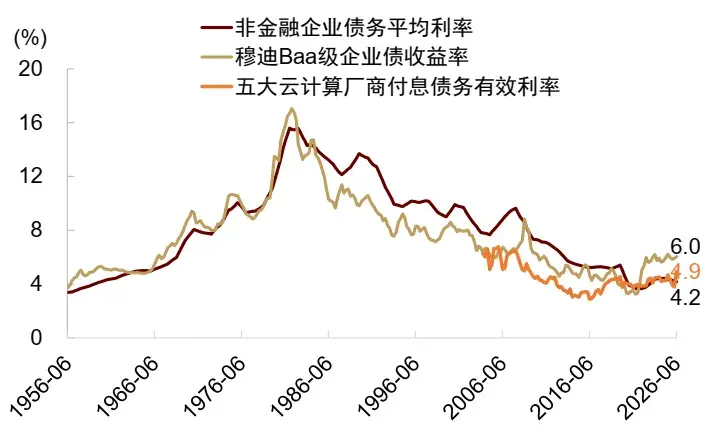 Note: Debt effective interest rate = Interest expense over the past 12 months / Total debt
Source: Bloomberg, China International Capital Corporation Research Department
Asset securitization may become the next step for financing AI companies in the United States. As long-term leases and capacity purchase contracts continue to accumulate, the stable cash flows from data centers and computing power assets are beginning to meet the conditions for securitization. In early 2024, CyrusOne issued $1.175 billion in data center asset-backed securities (ABS); in March 2025, Sabey issued $325 million in ABS, with collateral from seven data centers in the United States; in May 2025, Stack issued $345 million in ABS, with collateral from the real estate, leases, and related rights of eleven data centers in the United States; in September 2025, QTS issued $600 million in ABS, with collateral from the Phoenix data center; in early 2026, Compass Datacenters issued $830 million in data center ABS, with the underlying assets being long-term contracts for leasing computing power to cloud companies. AI data center loans are being packaged into ABS and distributed to institutional investors such as pension funds and insurance funds, similar to the real estate securitization process.
Long-term equity investments in U.S. AI companies have recently begun to rise, but the overall proportion is not high. Long-term equity investments by AI companies have increased since 2025, reaching about 5% of total assets in Q2 2026. Compared to internet companies, the proportion of long-term equity investments in AI companies is not high, indicating that the equity financing of AI companies is still in its early stages. Moreover, by using some heavy asset projects as equity investments, it is also a way to isolate risks from the balance sheets of large-scale cloud companies. Chart 28: Proportion of long-term equity assets in U.S. AI companies
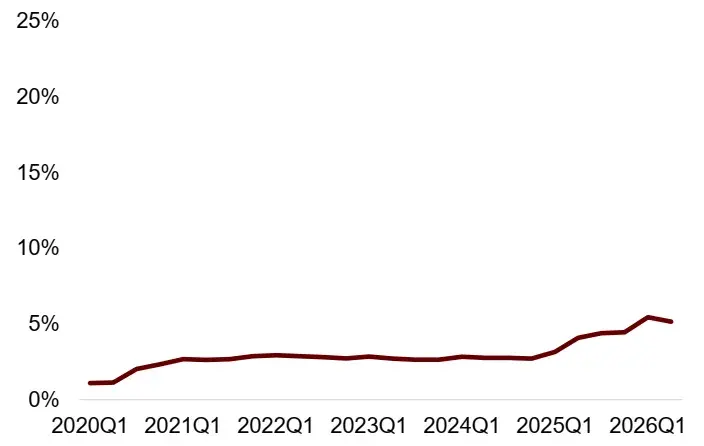 Note: Each group calculates the ratio for sample companies and then takes a simple average. AI companies include Microsoft, Alphabet, Amazon, Meta, and Oracle.
Source: Wind, Bloomberg, China International Capital Corporation Research Department Chart 29: Proportion of long-term equity assets in U.S. internet companies
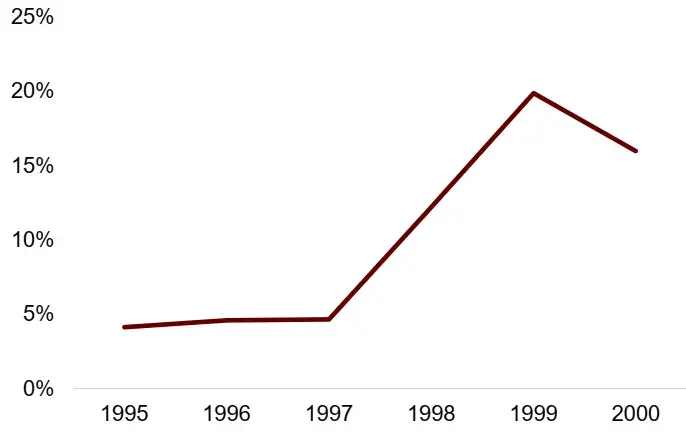 Note: Each group calculates the ratio for sample companies and then takes a simple average. Internet companies include Microsoft, Cisco, Amazon, WorldCom, and Lucent.
Source: Wind, Bloomberg, China International Capital Corporation Research Department
Short-term Risks
The previous analysis implies that against the backdrop of financialization in the United States, coupled with AI companies having stronger technological attributes than internet companies and "real estate-like" attributes, AI companies can finance through both equity and debt. However, compared to the historical internet and real estate revolutions, the current financialization of U.S. AI companies is still in its early stages, and there is no need to overly worry about funding sources. But this does not mean we can ignore short-term liquidity volatility risks, especially with high oil prices and unclear U.S. interest rate paths.
Looking back at history, before the burst of the U.S. internet bubble and real estate bubble, three phenomena appeared simultaneously: (1) High leverage. During the internet revolution, many Dotcom companies went public in the U.S., and the Shiller PE ratio rose from 17 times (1990) to 44 times (2000). Before the subprime mortgage crisis, the macro leverage ratio of U.S. households rose from 70% (2000) to 98% (2007); (2) Weakening fundamentals. Around 2000, the penetration rate of internet users in the U.S. reached a turning point, while from 2006 onwards, the U.S. mortgage default rate began to rise; (3) Systematic tightening of financing conditions. The Federal Reserve began raising interest rates in 1998, with the federal funds rate rising from 4.75% (1998) to 6.5% (2000). Before the subprime mortgage crisis, the federal funds rate rose from 1.0% (2003) to 5.23% (2006).
Currently, these three phenomena are not yet significant for AI companies. The leverage ratio of U.S. corporate sectors is still relatively low, and stock market valuations are not excessively high; the U.S. economy remains relatively strong, with nominal growth around 5%, and large tech companies represented by Mag 7 still have high revenue and profit growth rates; financing conditions have not yet shown significant and sustained tightening.
However, short-term risks still need attention, as they may disrupt financing for AI companies. Currently, there is strong financing demand in the U.S., and as inflation rises, the funding environment is becoming marginally tighter. Recently, actual financing pressures (real interest rates TIPs) have increased, raising concerns about the sustainability of high leverage in the AI industry chain.
In September 2026, the Bank of England's Financial Policy Committee pointed out the rise in AI debt and its lack of transparency, which complicates risk assessment, and as financial conditions tighten, the credit market (including private credit) is relatively fragile. In May 2026, the Federal Reserve noted in its Financial Stability Report that AI and private credit are recent risks that need attention. The Federal Reserve believes that as capital expenditures increasingly rely on debt financing, it increases systemic leverage effects; private credit is facing growing pressures, including investor redemptions, deteriorating sentiment, and the impact of artificial intelligence on credit quality. In September 2026, S&P downgraded Oracle's rating to BBB-, just above junk status. Since the Federal Reserve raised interest rates in September 2026, by the end of September, the yields on some high-yield bonds from Coreweave had risen by more than 0.5 percentage points. In July 2026, Meta issued $12 billion in new bonds to finance data centers, with a bond yield of 7.5%, which is 0.4 percentage points higher than the yield when it issued $27 billion in bonds in October 2025. Chart 30: Bubbles typically burst after systematic tightening of financing conditions
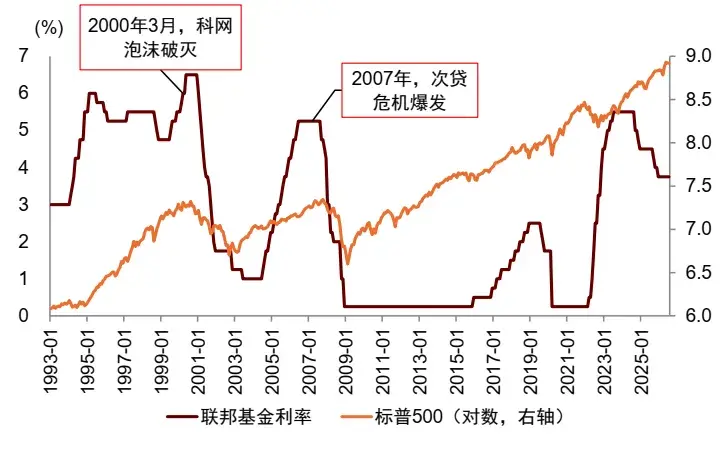 Source: iFinD, China International Capital Corporation Research Department
Specifically, two types of risks need attention in the short term. First, tightening financing conditions may weaken private investment momentum. If the Federal Reserve raises interest rates or banks tighten lending standards, corporate financing costs and the difficulty of obtaining funds may increase, thereby dragging down private investment expansion. Second, short-term financing pressures may intensify, amplifying liquidity risks. The spread between repurchase agreements and asset-backed commercial paper markets is still higher than normal, indicating that some market participants' short-term financing pressures have not yet dissipated. If monetary policy tightens further at this time, it may increase the difficulty of debt refinancing and amplify fluctuations in the short-term funding market.
Source: iFinD, China International Capital Corporation Research Department
Specifically, two types of risks need attention in the short term. First, tightening financing conditions may weaken private investment momentum. If the Federal Reserve raises interest rates or banks tighten lending standards, corporate financing costs and the difficulty of obtaining funds may increase, thereby dragging down private investment expansion. Second, short-term financing pressures may intensify, amplifying liquidity risks. The spread between repurchase agreements and asset-backed commercial paper markets is still higher than normal, indicating that some market participants' short-term financing pressures have not yet dissipated. If monetary policy tightens further at this time, it may increase the difficulty of debt refinancing and amplify fluctuations in the short-term funding market.
 Risk warning