




On the night when the Nasdaq plummeted 6.4%, evaporating 3 trillion, what happened to various assets?

On November 5, U.S. stocks recorded their largest single-day drop since the tariff turmoil in April 2025. The Nasdaq Composite fell by 5.52%, the Nasdaq 100 dropped by about 6.4%, the S&P 500 declined by 4.35%, and the Philadelphia Semiconductor Index plummeted by 12%, marking its largest drop since 2020. Nvidia fell by 9.26%, AMD dropped by 17.26%, SanDisk decreased by 22.26%, and Micron fell by 17.46%. The Financial Times reported that Wall Street's stock market value evaporated by about $3.2 trillion in a single day, while the Wall Street Journal estimated it at about $2.5 trillion, with different scopes of statistics.
This sharp decline was indeed triggered by new policy factors: local referendums in many parts of the U.S. restricting data center construction received a high approval rate, with exit polls showing that 76% of voters opposed building data centers in their communities. Sanders subsequently proposed an "immediate nationwide halt to data center construction." As of now, this remains a political statement and has not entered the congressional review process as a bill text.
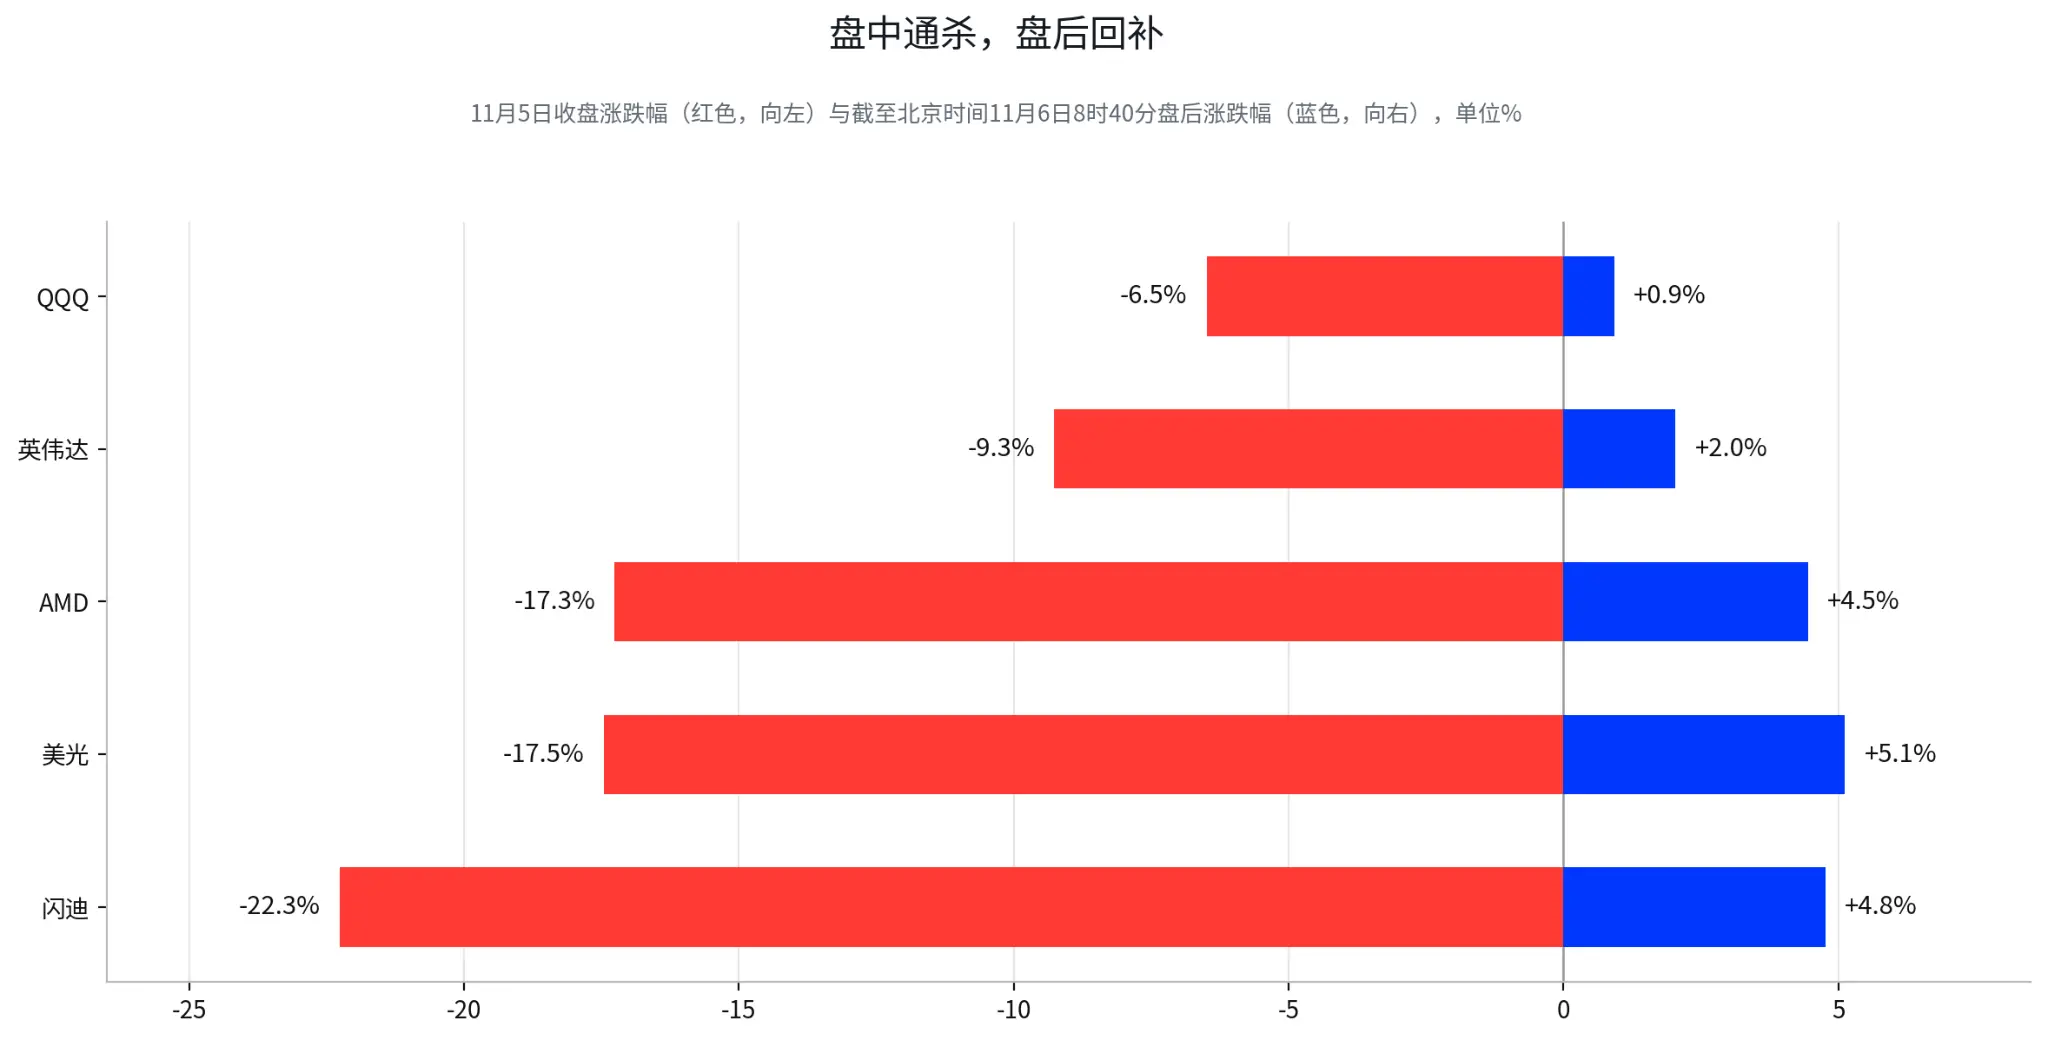
After-hours trading quickly recovered. As of 8:40 AM Beijing time on November 6, Micron was up 5.1%, SanDisk was up 4.8%, AMD was up 4.4%, Nvidia was up 2.0%, QQQ rebounded 0.93% from the close, and Nasdaq 100 futures turned up about 0.4%.
Between the broad sell-off and the after-hours recovery, what the market is truly repricing is whether policy risk can transmit to data center capital expenditures, and whether AI demand has disappeared is secondary.
1. From Divergence to Broad Sell-off: The Real Explosion is Crowded Positions
Policy news is merely a trigger; the destructive power comes from the capital expenditure expectations and crowded positions that have accumulated over the past two years.
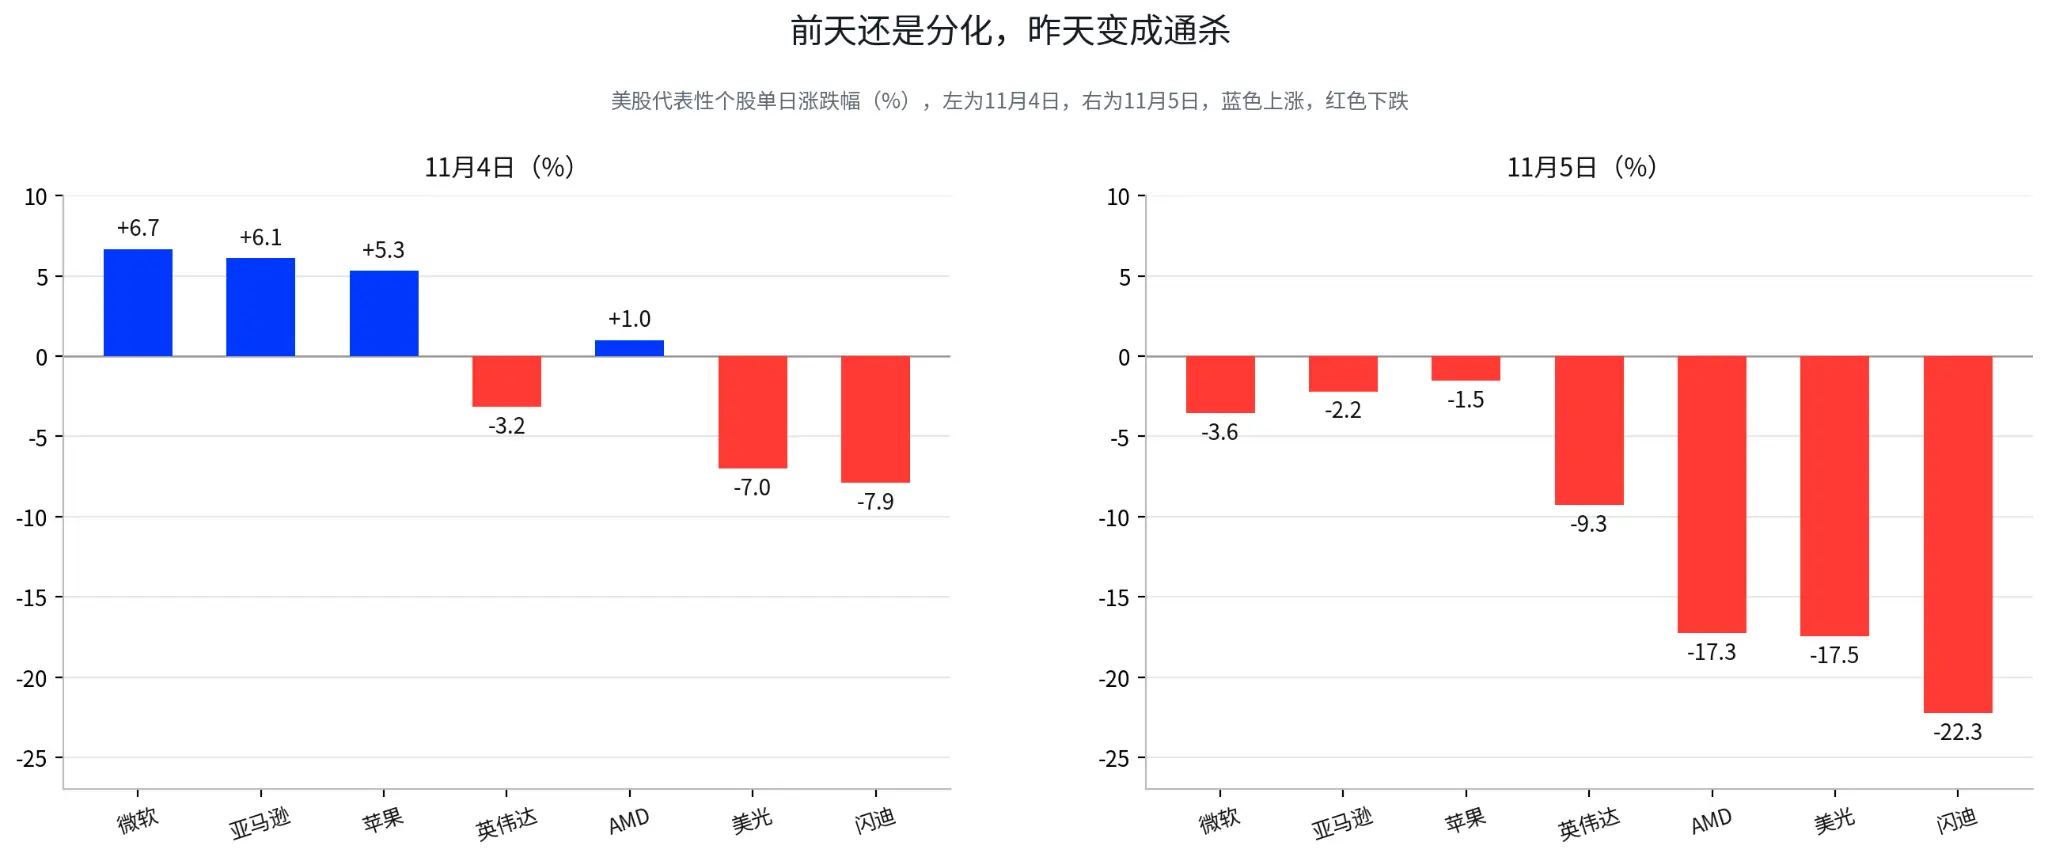
The drop on November 5 is difficult to explain solely by "the Democrats won." The day before, the AI chain in U.S. stocks was still showing clear divergence, with large tech platforms rising and AI hardware only experiencing a mild pullback. One day later, there was a comprehensive decline from GPUs, storage to optical communication, and PCBs, with the seven sisters' market value evaporating by over a trillion dollars (as reported).
Over the past year, AI hardware and data center construction have repeatedly received orders, capital expenditures, and profit validations, with the storage supercycle and computing power leasing transactions continuously strengthening. When the market had already priced AI infrastructure expectations at a high level, any variable that could slow capital expenditures would trigger concentrated profit-taking. The local referendum on November 5 happened to provide the market with a sufficiently strong reason: data tracked by Redbud Consulting showed that out of 44 local measures restricting data centers nationwide, 38 passed, while another media source reported 40 out of 41, with slight discrepancies in numbers. Exit polls indicated that 76% of voters opposed building data centers in their communities (all reported).
Sanders' statement thus needs to be accurately positioned. On November 5, he posted on social media, citing the results of various referendums, calling for an "immediate nationwide halt to data center construction." This is a political stance that has not been submitted to a committee, nor is there a bill text. What the market truly needs to wait for is whether local opposition sentiments can enter federal policy and then transmit to data center construction and cloud vendors' capital expenditures.
The current market is trading a chain that has not yet completed:
Local opposition to data centers → Federal policy tightening → Slowing data center construction → Downward revision of cloud vendors' capital expenditures → Decrease in AI hardware orders → Downward revision of chip and storage profit expectations
The stock prices on November 5 jumped directly to the last step, with several links in between still unconfirmed. This round of decline resembles a concentrated deleveraging of high valuation, high position AI trades; the market has not confirmed the end of the AI infrastructure cycle.
2. Storage Drops the Most, Market Cuts Orders Closest to Capital Expenditures
The decline in storage is nearly twice that of the core computing power, with funds first cutting orders most sensitive to new capital expenditures.
Nvidia fell by 9.26%, but the real widening of the drop came from storage. Micron fell by 17.46%, SanDisk dropped by 22.26%, Western Digital decreased by 17.35%, while Nvidia fell by 9.26% and AMD by 17.26% during the same period. This structure itself is a signal.
Data center capital expenditures will ultimately transmit through servers, GPUs, HBM, DRAM, NAND, and other links to the industry chain, with the profit expectations of storage companies being more tightly connected to new data center demand. Once the market begins to doubt the future speed of data center construction, the first orders to be cut will be those most sensitive to new capital expenditures, which also had the highest past increases and position crowding.
Thus, storage is dropping harder than GPUs, indicating that funds are prioritizing the downward revision of the marginal increment of AI infrastructure; the AI demand itself has not yet been disproven. This is also why November 5 cannot simply be defined as the "bursting of the AI bubble." If the market confirms a complete collapse of AI demand, cloud vendors' capital expenditures, orders, and profit expectations should be revised downward simultaneously; what is currently happening is merely that funds are cutting a portion of the overly optimistic capital expenditure assumptions through stock prices.
The after-hours rebound precisely illustrates this point. As of 8:40 AM Beijing time, Micron was up 5.1%, SanDisk was up 4.8%, AMD was up 4.4%, Nvidia was up 2.0%, and QQQ rebounded 0.93%. Funds are recalculating the distance between political statements and actual changes in capital expenditures; naturally, the stocks that fell the most earlier are the first to see short covering and oversold rebounds.
However, the after-hours rebound itself does not prove a trend reversal. With lower liquidity after hours, price fluctuations can be amplified, and truly valuable signals must wait until the normal trading session opens on November 6: if GPUs stabilize first while storage continues to weaken, it indicates that funds are repricing within the industry chain. A synchronized rebound across the entire AI hardware chain is closer to a rebound after panic deleveraging. If the after-hours gains quickly disappear, it indicates that deleveraging has not yet ended.
3. Hong Kong Stocks Rise in Platforms, Fall in Hardware
The divergence between Hong Kong stocks and U.S. stocks in AI hardware is actually two ends of the same rotation trade.
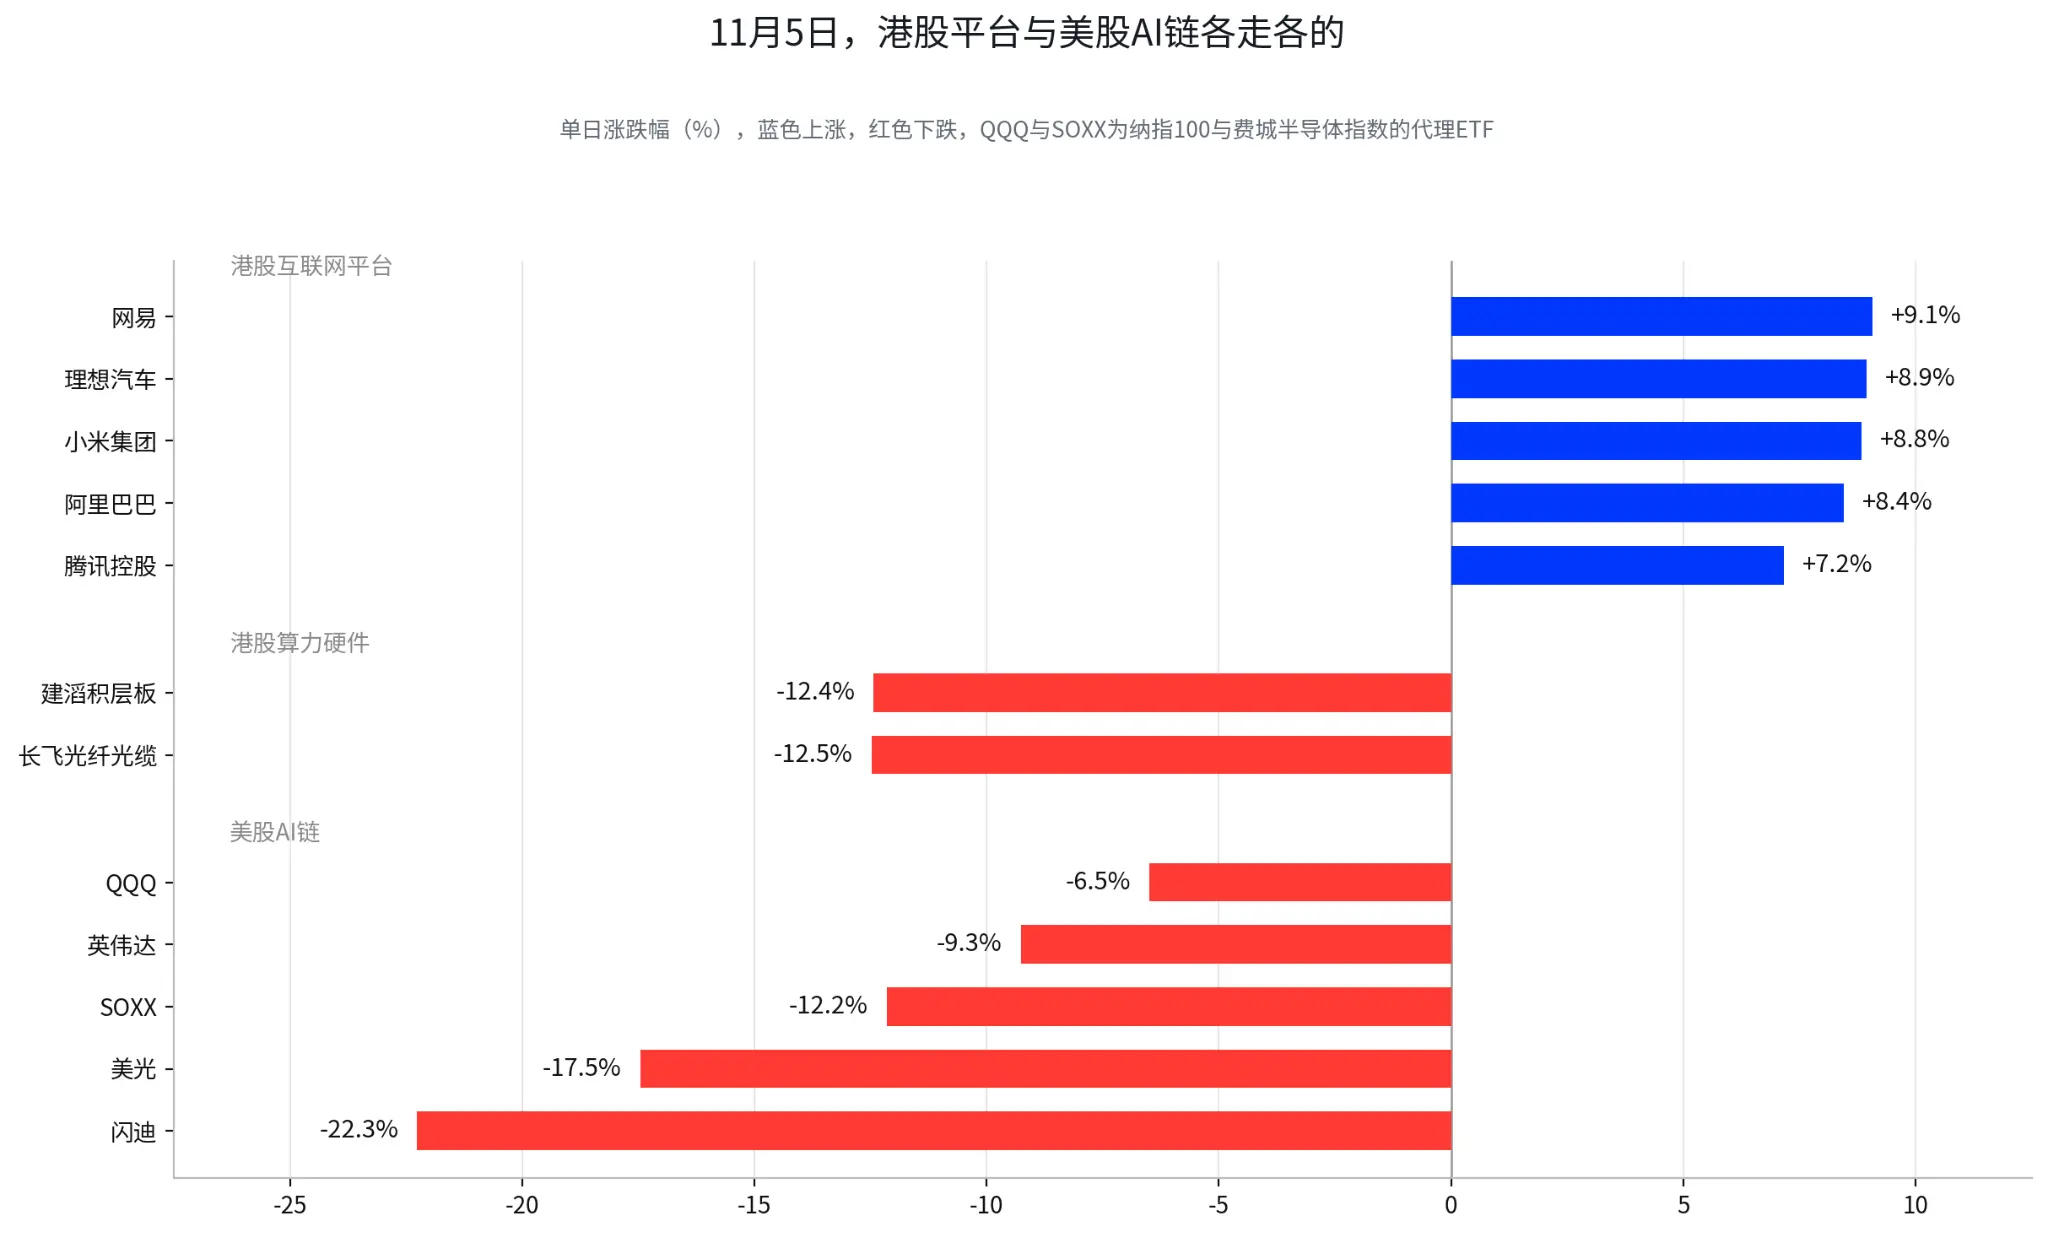
On November 5, the Hang Seng Index rose by 3.67%, and the Hang Seng Tech Index increased by 5.55%, with trading volume expanding to HKD 356.67 billion, a 50.56% increase from the previous trading day, seemingly completely opposite to the large drop in U.S. AI hardware. Breaking it down, Hong Kong stocks did not rise broadly; funds were also clearly switching directions.
NetEase rose by 9.07%, Li Auto increased by 8.94%, Xiaomi was up 8.83%, Alibaba rose by 8.45%, and Tencent Holdings increased by 7.17%. Meanwhile, Kingboard Laminates fell by 12.43%, and Yangtze Optical Fibre and Cable fell by 12.48%, with computing hardware that performed strongly the previous day clearly under pressure.
The interpretation of the rise in Hong Kong stocks is that after funds suppressed the exposure of AI infrastructure, they are reselecting targets within tech assets; the risk-averse market is just a facade. The platform internet side benefits from valuation recovery and marginal improvement in the policy environment, while on the other side, funds are withdrawing from computing hardware that has high valuations and high sensitivity to capital expenditures; both sides can be understood as part of the same rotation trade. On that day, A-shares opened low and rose high, with the Shanghai Composite Index up 0.10%, and the ChiNext Index up 0.87%, with Longi Green Energy rising by 3.92%, consistent with this rotation clue in the new energy direction.
Southbound funds net sold about HKD 21.3 billion that day, which also indicates that an index rise does not equal a full return of southbound funds; external funds, platform-weighted stocks, and market style switching jointly supported the day's market.
What needs to be observed next is whether this rotation can be sustained. If the Hang Seng Tech continues to be led by platform stocks while computing hardware continues to underperform, it indicates that funds are actively suppressing exposure to AI infrastructure. If computing hardware starts to outperform again, it suggests that the policy shock from November 5 is being quickly digested.
4. Before Direction is Confirmed, Focus on Bill Text, Capital Expenditures, and Internal Chain Divergence
Whether this round of market activity can clear out a crowded trade and upgrade to a genuine adjustment of the AI capital expenditure cycle hinges on three areas.
Bill Text: Local referendums and political statements can only prove that data center construction faces greater social resistance; what truly affects valuations is whether restrictive clauses have entered the bill, appropriations, or energy policy. Only when clear restrictive clauses appear at the federal level does the market have reason to further lower expectations for data center construction. Remaining solely at social media statements, the drop on November 5 contained a lot of emotional and positional factors.
Cloud Vendors' Capital Expenditures: How much Microsoft, Google, Amazon, and Meta are ultimately willing to spend is more important than anything any politician has said. If cloud vendors continue to maintain or even increase capital expenditures, November 5 looks more like a valuation and position adjustment. If project delays, order slowdowns, and downward revisions of capital expenditure guidance occur in the coming months, then the storage, optical communication, and server industry chains will need to further revise profit expectations downward.
Who Stops Falling First in the AI Chain: The relative performance of GPUs, storage, optical communication, and PCBs is more informative than simply looking at the Nasdaq's ups and downs. If GPUs stabilize first while storage continues to weaken, it points to the market lowering expectations for the storage supercycle and crowded trades. A synchronized rebound across the entire AI hardware chain indicates that panic is being digested. If storage, optical communication, and PCBs continue to hit new lows, the market is further mapping policy risks onto the entire capital expenditure cycle.
What was knocked down on November 5 can be clearly defined: the market previously assumed that AI capital expenditures would only go up and not down, and that confidence was shattered that day. The after-hours recovery of chip stocks indicates that the market is re-differentiating between political statements and policy implementation; the direction has not yet been fully confirmed.
Bill text determines the level of policy risk, cloud vendors' capital expenditures determine the authenticity of the fundamentals, and the internal divergence within the AI chain determines whether funds are actually reallocating or retreating.
5. Bonds, Gold, Oil, and Currency Have Not Been Dragged Down
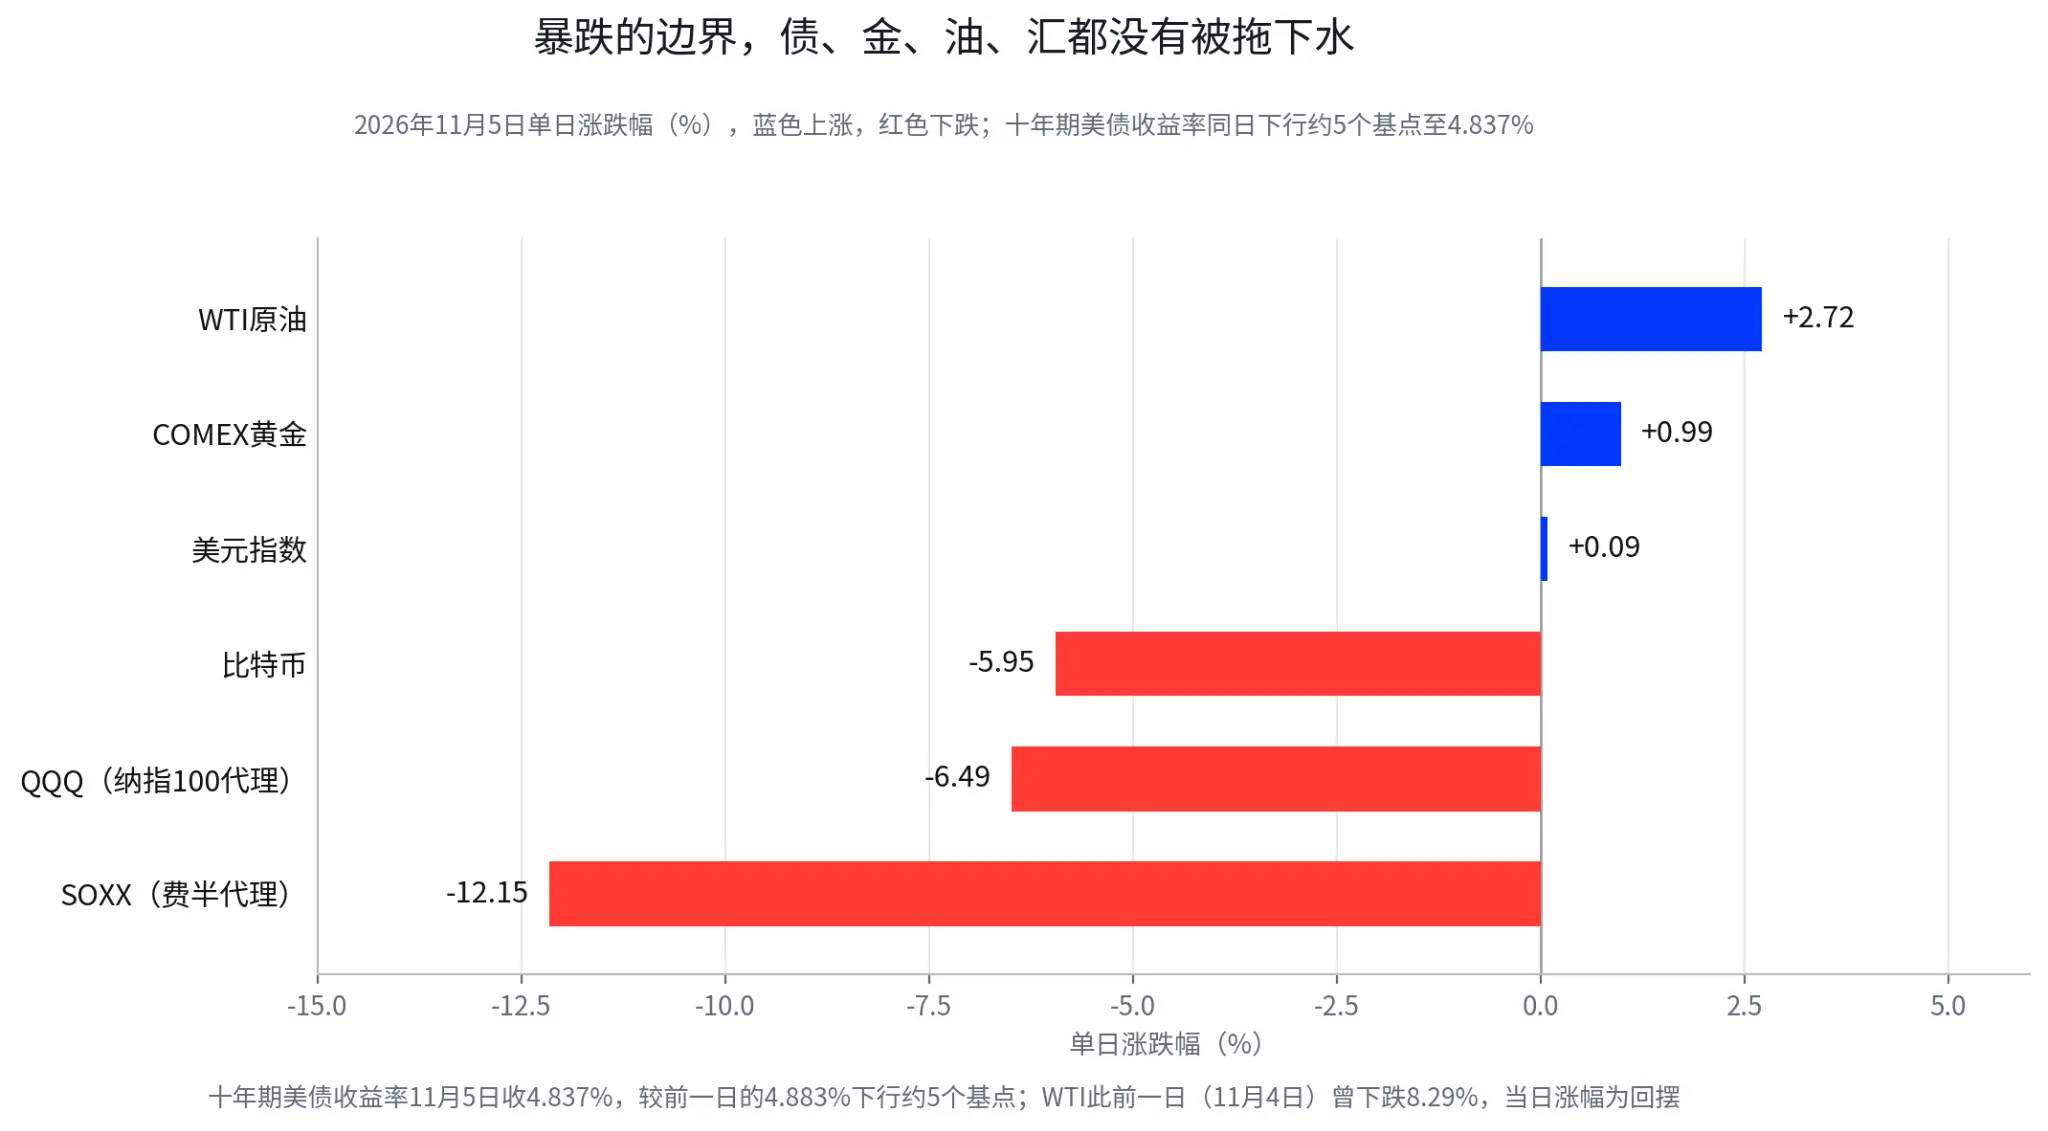
This round of selling concentrated on the crowded end within stocks, and there has been no liquidity squeeze across all assets.
|--------------|-------------|----------|-------------------| | Asset | Close on November 5 | Daily Change | One-Sentence Interpretation | | SOXX (Semiconductor ETF) | $131.90 | -12.15% | Center of the sell-off | | QQQ (Nasdaq 100 ETF) | $647.05 | -6.49% | The broader market followed | | Bitcoin | $75,640 | -5.95% | Dropped like stocks, not like commodities | | WTI Crude Oil | $90.52 | +2.72% | Rebounding after a previous drop of 8.29% | | COMEX Gold | $4,113.5 | +0.99% | Already rose 3.37% on November 4, continuing to accumulate | | Dollar Index | 101.49 | +0.09% | Basically flat, no dollar shortage | | 10-Year U.S. Treasury | 0.04837 | about -5bp | Mild safe-haven, no panic buying |
Looking at the stocks alone, this is a drop at the level of a liquidity crisis. When viewed across all assets, the picture is completely different. Gold had already risen by 3.37% on November 4, and then rose another 0.99% on November 5, indicating that safe-haven buying not only exists but has entered the market for the second consecutive day. WTI rose by 2.72%, but it should be clarified that it had just dropped by 8.29% on November 4, and the increase on that day belongs to a rebound after a sharp decline, which cannot be taken as evidence of strengthening demand.
The answer from bonds is even more interesting. The yield on the 10-year U.S. Treasury bond fell from 4.883% to 4.837%, moving only about 5 basis points, indicating that there is some safe-haven buying, but at a moderate scale. The U.S. dollar index remained flat around 101.49. If this drop is understood as a deleveraging squeeze, gold would be sold off together to cover margin calls, and bond yields would be driven down by panic buying by dozens of basis points, but neither of these occurred.
Thus, the sell-off that night had a clear boundary, drawn based on the degree of crowded positions, not on asset classes. What was sold off were the stocks and cryptocurrencies with the most crowded positions and the heaviest narratives, while those with actual supply and demand or interest were caught. Bitcoin dropped by 5.95%, precisely hitting this boundary, following the stock market's decline, with its commodity attributes not manifesting.
VI. Profit Evidence Cashed Out on the Spot
On November 5, the same AI chain moved in two directions, with the difference being whether profit evidence could be presented.
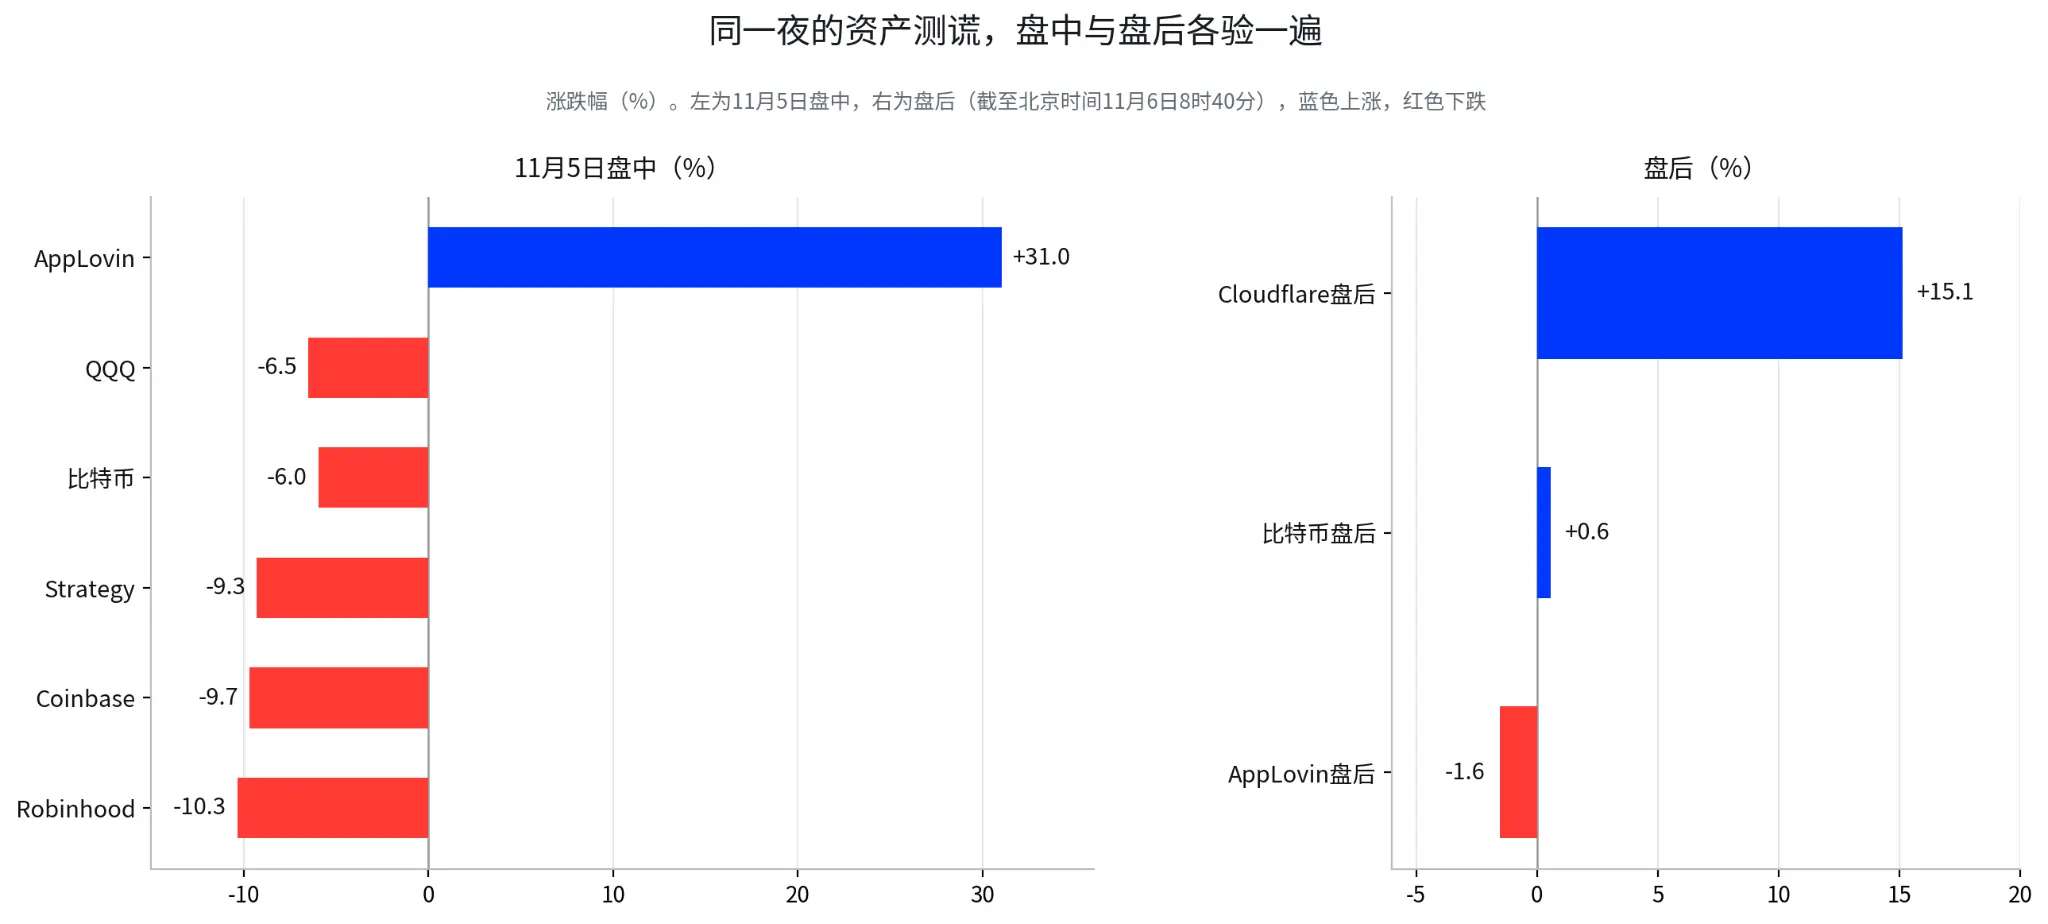
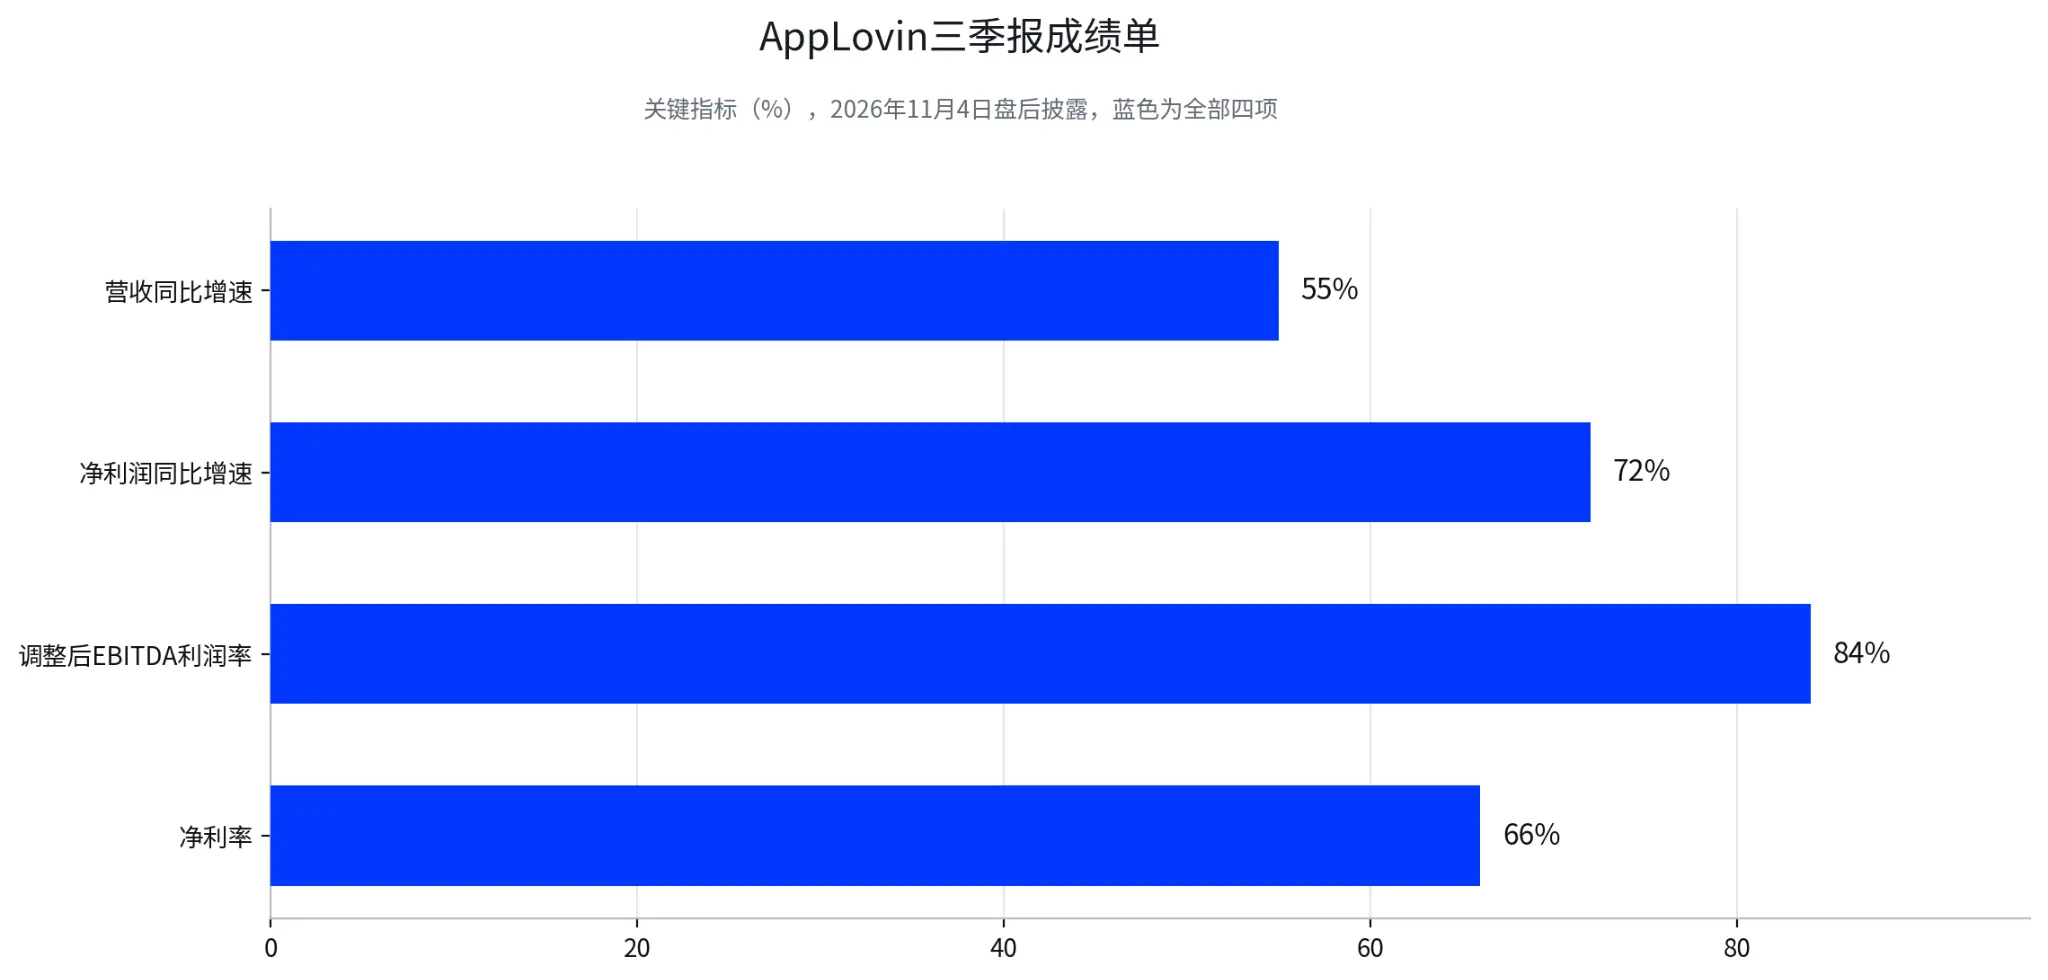
AppLovin's third-quarter report was released after the market closed on November 4: revenue of $2.185 billion, a year-on-year increase of 55%, net profit of $1.439 billion, a year-on-year increase of 72%, net profit margin of 66%, adjusted EBITDA margin of 84%, adjusted EBITDA of $1.84 billion, and free cash flow of $1.4 billion (as disclosed by the company). The company also expanded its buyback authorization, and the fourth-quarter guidance implied a sequential revenue growth of 8% to 10% (as mentioned in the earnings call). Thus, the most eye-catching scene of that night emerged: on the same day the Philadelphia Semiconductor Index dropped by 12%, AppLovin's stock price rose by 31.04% during the day.
Positioning is equally important. AppLovin's 52-week high was $738.01, and after a two-day surge of 45%, the stock price was still about 52% away from its high, with a 52-week percentile of only 25.5%. It cannot be considered a victory for crowded stocks; rather, it resembles a repair ticket ignited by profit evidence after a significant drop. The market did not deny AI; it expelled those names that had revenue but no profit, rewarding businesses that could convert AI into cash flow.
Cloudflare staged this split in two acts. On November 5, during the day, it fell by 8.03% along with the AI infrastructure chain. After the market closed, the earnings report was released: third-quarter revenue of $782.5 million, a year-on-year increase of 39%, with growth accelerating, annualized revenue crossing $3 billion, non-GAAP operating profit margin of 18%, and current remaining performance obligations growing by 37% year-on-year (as disclosed by the company on November 5). After hours, the stock price rebounded by 15.1%, recovering nearly half of the day's decline. The same company was priced by two sets of logic within a day: sold off during the day according to AI infrastructure beta, and revalued at night based on profit evidence.
VII. The Market May Have Partially Factored in Related Policy Changes
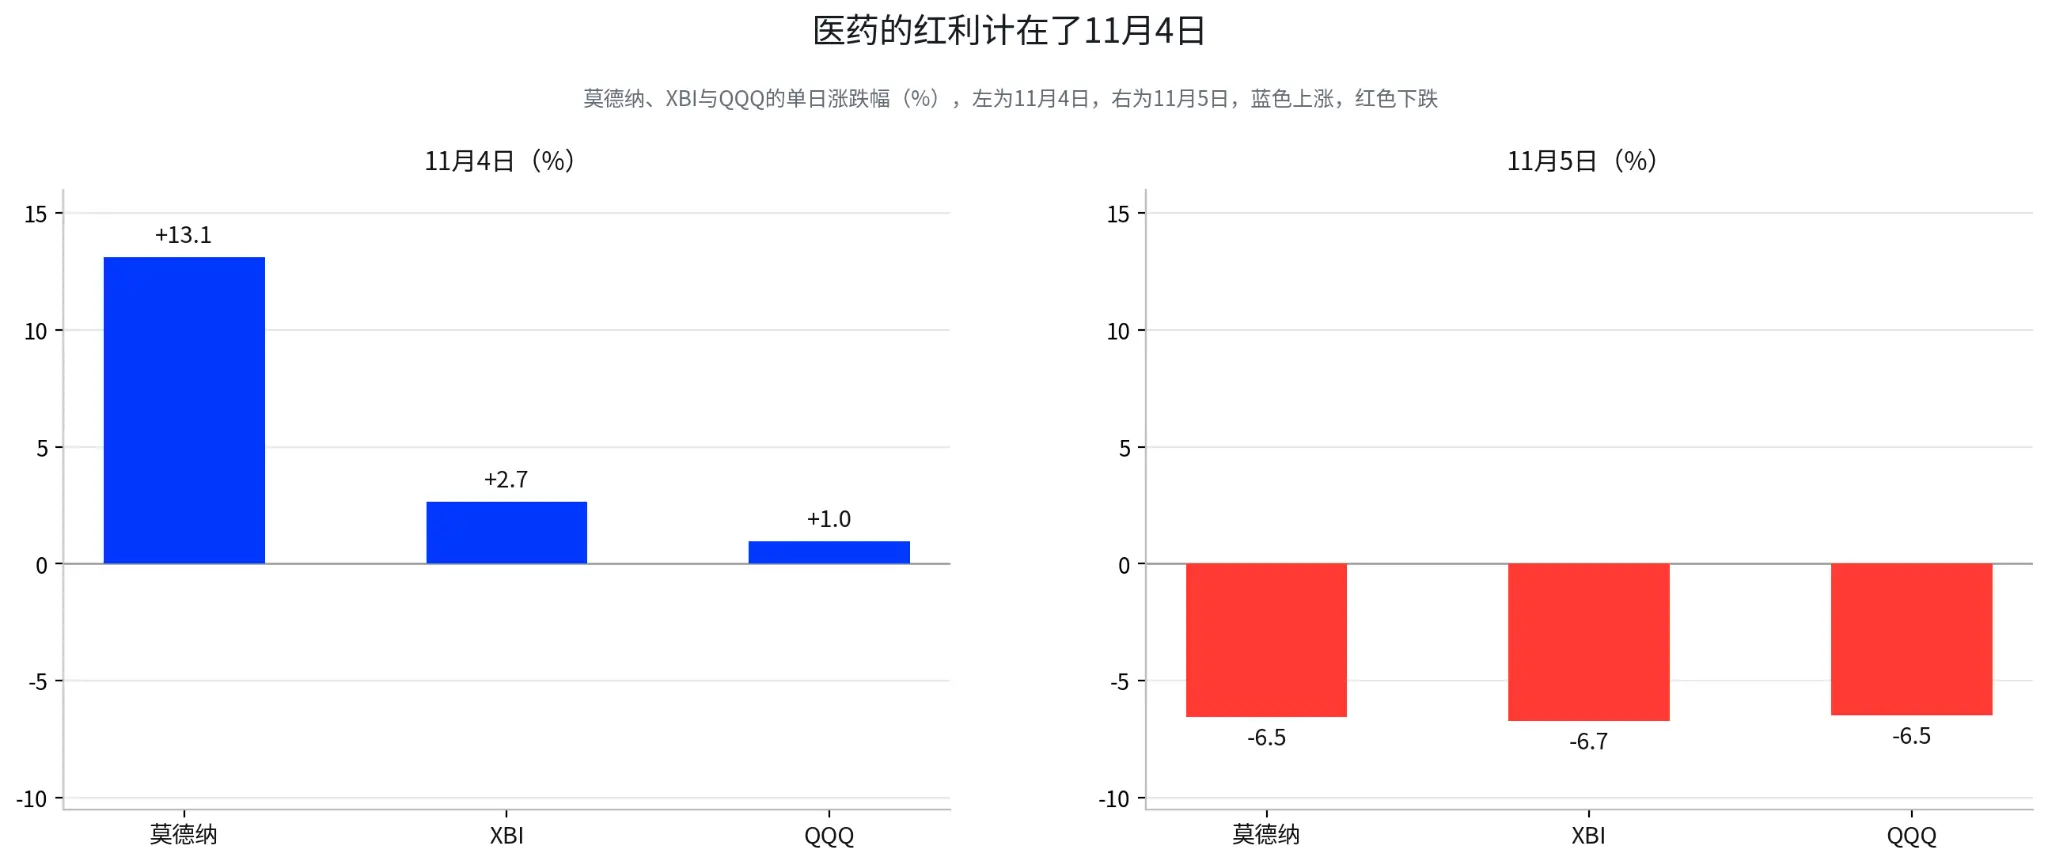
Pharmaceuticals did not rise against the trend on November 5; their policy reassessment had already been completed the day before, and that day they just fell less than the AI chain.
First, let’s present the data. On November 4, Moderna rose by 13.11%, closing at $258.38, reaching a 52-week high of $260.67 during the day, and at one point its market capitalization exceeded $100 billion based on the day's share count. On the same day, the S&P 500 healthcare sector rose by 3.06%. On November 5, there was a general decline, with Moderna falling by 6.55% to $241.46, the biotechnology ETF XBI dropping by 6.73%, and the S&P 500 falling by 4.35%, with XBI's decline actually deeper than the market. However, looking at the two days together, Moderna had a cumulative increase of 5.70%, while the Nasdaq-100 ETF QQQ had a cumulative decrease of 5.57%, showing a clear divergence. Moderna's current price is only 7.4% away from its 52-week high, with a 52-week percentile of 91.9%.
The policy calculations are also straightforward. After the Democrats took control of Congress, the plan to cut Medicaid spending faced increased resistance, and the continuation of healthcare insurance subsidies and the Medicaid issue were pushed to the funding deadline of December 11 (as noted in a report by Pu Yin International on November 5). The negotiation mechanism for drug prices under the Inflation Reduction Act already exists, and Congress's legislative focus in the short term will be occupied by data center and cryptocurrency regulation, with the priority for additional pricing pressure on pharmaceutical companies being lower. The pharmaceutical sector is more like a situation where the worst news has been fully priced in, with the largest policy tail risk removed, and the combination of essential demand and the recently lifted policy shadow valuation makes these assets a natural receiving direction for institutional funds during a contraction period.
VIII. Cryptocurrencies Without Cash Flow and Hardware Betting on Others' Capital Expenditure
The criteria for exclusion are also consistent: either cash flow does not belong to oneself, or growth relies on others' capital expenditure.
On November 5, Bitcoin closed at $75,640, down 5.95% from the previous day's $80,428, and rebounded to around $76,088 by 10 AM on November 6, Beijing time. U.S. cryptocurrency stocks collapsed simultaneously, with Coinbase down 9.69%, Robinhood down 10.32%, and Strategy down 9.29%.
The liquidity aspect is easy to understand. The stock market crash triggered margin calls, and Bitcoin, being traded around the clock with deep liquidity, naturally became the first asset to be sold off to cover margin calls; this mechanism repeats in every deleveraging of risk assets.
The impact on the policy side is more substantial. The Clarity Act, a structural bill for the cryptocurrency market, has been under review in this Congress for over a year, and since this Congress's term ends on January 3, 2027, any bill that has not become law will automatically expire and need to start over. After the Democrats swept both houses, the prediction market Kalshi estimates the probability of the Clarity Act becoming law before 2027 is only about 6% (as reported by Disruption Banking on November 4). Media reports generally expect that the Democrats' regulatory direction will emphasize investor protection, and the compliance progress for new asset classes may slow down (as reported by the Korea Economic Daily on November 5). For an asset class that lacks endogenous cash flow and heavily relies on the implementation of regulatory frameworks, this time window is more important than the price itself.
Bitcoin's rebound on November 6 also indicates that the sell-off carried a liquidity-driven recovery color, and the direction needs to be confirmed during regular trading hours.
AI hardware is another excluded category. Its problem does not lie in demand, but in the expansion logic of capital expenditure being interrupted by policy uncertainty. Goldman Sachs' estimate suggests that about 45% of planned data center projects may be affected by pauses, and this estimate remains a pressure hanging over the chain. The cash flow of hardware companies is highly dependent on the capital expenditure rhythm of cloud vendors, which in turn relies on the progress of legislation and power approvals; every link in the chain places certainty in the hands of others.
This night’s market-wide screening showed that the two items that passed both had cash flow answers, while the two that were excluded placed certainty in the hands of others.
The three signals listed in the fourth section all have calendars: the bill text looks at the December funding bill, the capital expenditure of cloud vendors looks at fourth-quarter guidance, and the intra-chain divergence looks at the opening on November 6. Additionally, for pharmaceuticals, there is also the final text of healthcare insurance and Medicaid provisions on December 11. The examples of AppLovin and Cloudflare illustrate that when evidence is in place, funds do not hesitate; even in a declining market, some companies can still rise by 31% on the same day. Conversely, Bitcoin's example shows that when certainty is withdrawn, the decline is not significantly related to the degree of crowded positions.
Understanding the cash flow background and policy safety net behind each asset is more useful than guessing the bottom of the Nasdaq.
Disclaimer: The content of this article is for general information and market commentary only, compiled based on publicly available information as of the time mentioned in the text. Relevant market data, expectations, and probabilities may change with market conditions. The views and investment strategies of third-party institutions, analysts, or other individuals cited in the text only represent the views of the relevant third parties at a specific time and do not represent the views or recommendations of BIT. This article does not constitute investment advice, investment research, solicitation, or recommendation for any securities, investment products, or trading strategies, nor should it be the basis for any investment decisions. Financial markets carry risks, and securities prices and market performance may fluctuate; past performance and historical market trends do not represent or guarantee future results. Investors should independently assess relevant risks based on their own circumstances and seek professional advice when necessary. BIT's Hong Kong stock trading services are not provided to Hong Kong residents or users in other restricted jurisdictions.
 Risk warning Risk warning