




CPI exceeded expectations, and the high volatility in the US stock market is not over: how to defend tech stocks, and how to seize the opportunity during the pullback?

 In October, the U.S. CPI rose by 0.4% month-on-month, and the core CPI increased by 0.3%, both higher than expected; the market pricing for a 25 basis point rate hike in December has risen to nearly 90%, and the yield on the 10-year U.S. Treasury bond has approached 5% again during the session. The pressure from high interest rates has not yet been alleviated, but there has been a clear divergence in technology stocks: on one side are high-volatility stocks under pressure from valuation and financing costs, while on the other side are leading companies supported by profits and cash flow. Next, keep an eye on the yield of the 10-year U.S. Treasury bond to determine which positions need to be defensive and which pullback opportunities are worth preparing for in advance.
1. After CPI, Focus on 10-Year U.S. Treasury Bonds
On the evening of November 10, Beijing time, the U.S. October CPI was released. Overall, it rose by 0.4% month-on-month, lower than September's 0.6%, but higher than the expected 0.3%. The core CPI rose by 0.3% month-on-month, remaining stable compared to the previous two months, still above the expected 0.2%. In October 2025, due to a government shutdown, the Bureau of Labor Statistics did not collect complete data, and this report lacks comparable year-on-year figures, leaving the market to judge whether inflation has become sticky based only on month-on-month data.
In terms of components, housing remains the largest contributor, with food and energy also rising. A key point for traders is that this report did not confirm "rapid inflation decline, allowing the Federal Reserve to ease." It suggests that inflation is sticky, and high interest rates will need to remain for a while longer.
The market quickly adjusted prices. The pricing for a 25 basis point rate hike in December rose from 78.8% on November 9 to about 89.8% after the CPI release, while the pricing for a 50 basis point hike increased to about 12%. The direction is basically set; what remains is the magnitude.
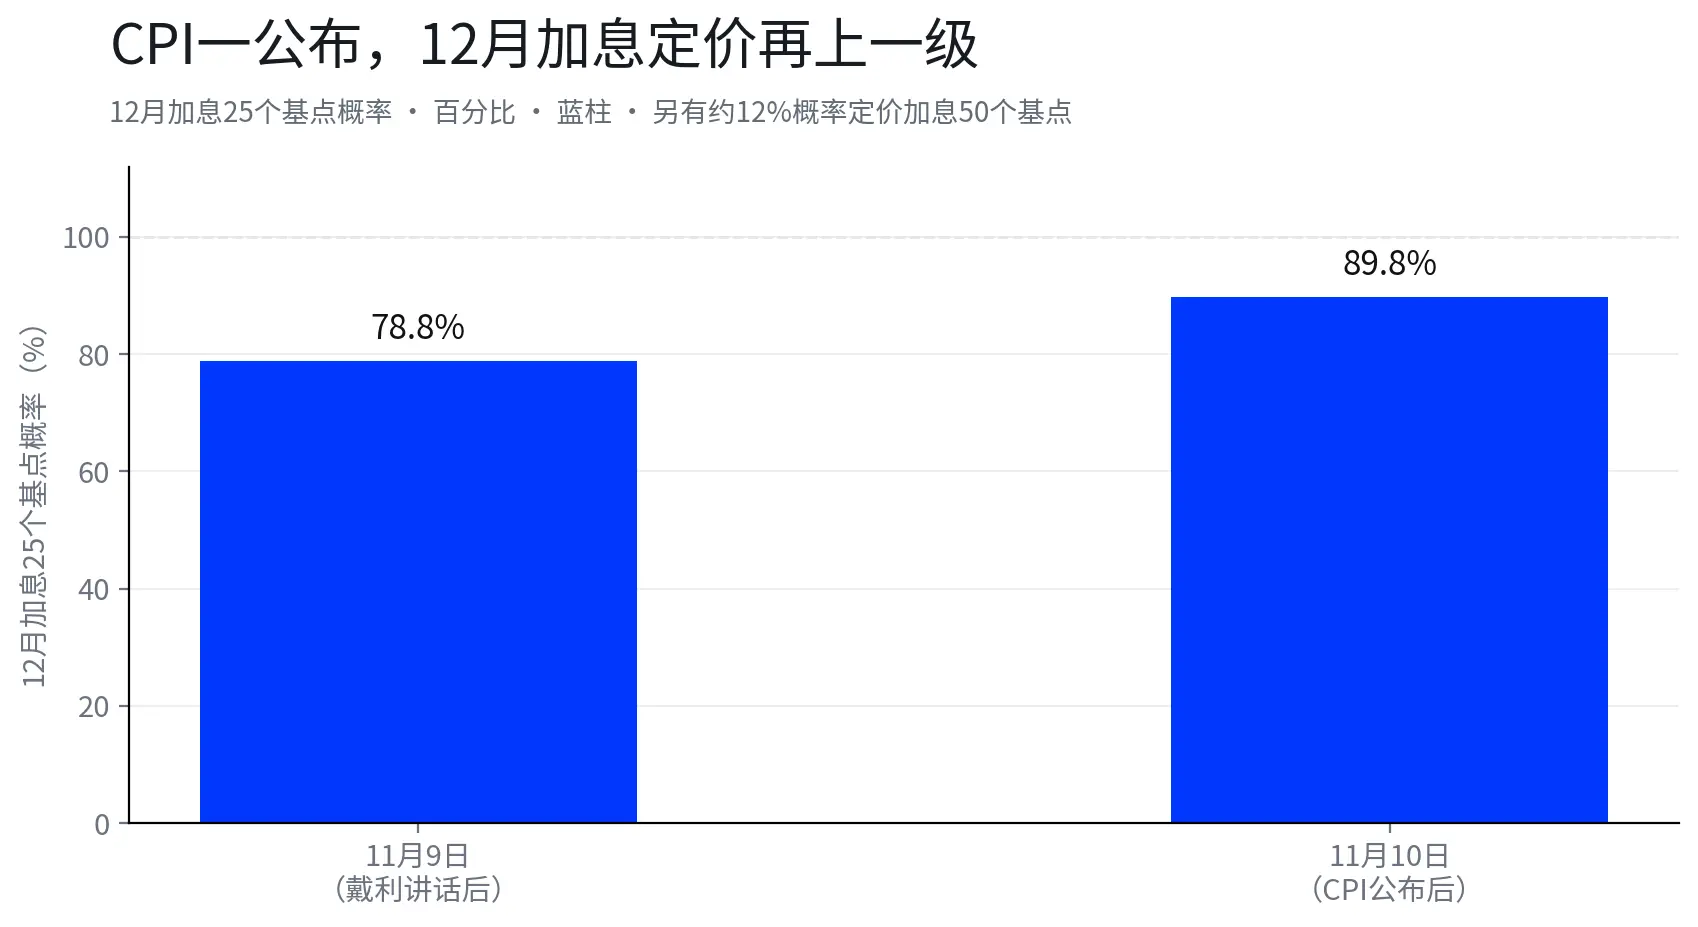
Caption: Market pricing for a 25 basis point rate hike in December, rising from 78.8% on November 9 to 89.8% after the CPI release on November 10. Additionally, about 12% of pricing is for a 50 basis point hike. The blue bars represent probability, measured in percentage.
The magnitude of the rate hike itself is getting closer to the market's baseline scenario, and the space for directional bets around 25bp or 50bp is narrowing. The stock market is truly trading on interest rate levels. After the CPI release, the market repriced the interest rate path, first pushing the 10-year U.S. Treasury yield back to the 5% mark, then transmitting that yield into the valuations of growth stocks. Therefore, don't just focus on whether to raise rates by 25 or 50 in December; the key is to watch the US10Y. How high it goes and how long it stays there will determine the valuation floor for growth stocks, with every subsequent inflation data point and Federal Reserve speech ultimately impacting stock prices through this number.
2. US10Y Above 5%, Who Gets Hit on Valuation First
The market shock on November 5 was a valuation hit, and it may not be the last before the rate hike is finalized. On that day, the Nasdaq fell by 5.52%, the S&P 500 dropped by 4.36%, and the Philadelphia Semiconductor Index plummeted by 12.25%. Among individual stocks, SanDisk fell by 22.26%, Micron by 17.46%, Western Digital by 17.35%, AMD by 17.26%, and NVIDIA by 9.26%. On November 10, there was another small drop, with the Philadelphia Semiconductor Index closing at 9998.33 points, and NVIDIA falling about 5.5% for the second consecutive trading day, resulting in a market cap reduction of approximately $430 billion over two days.
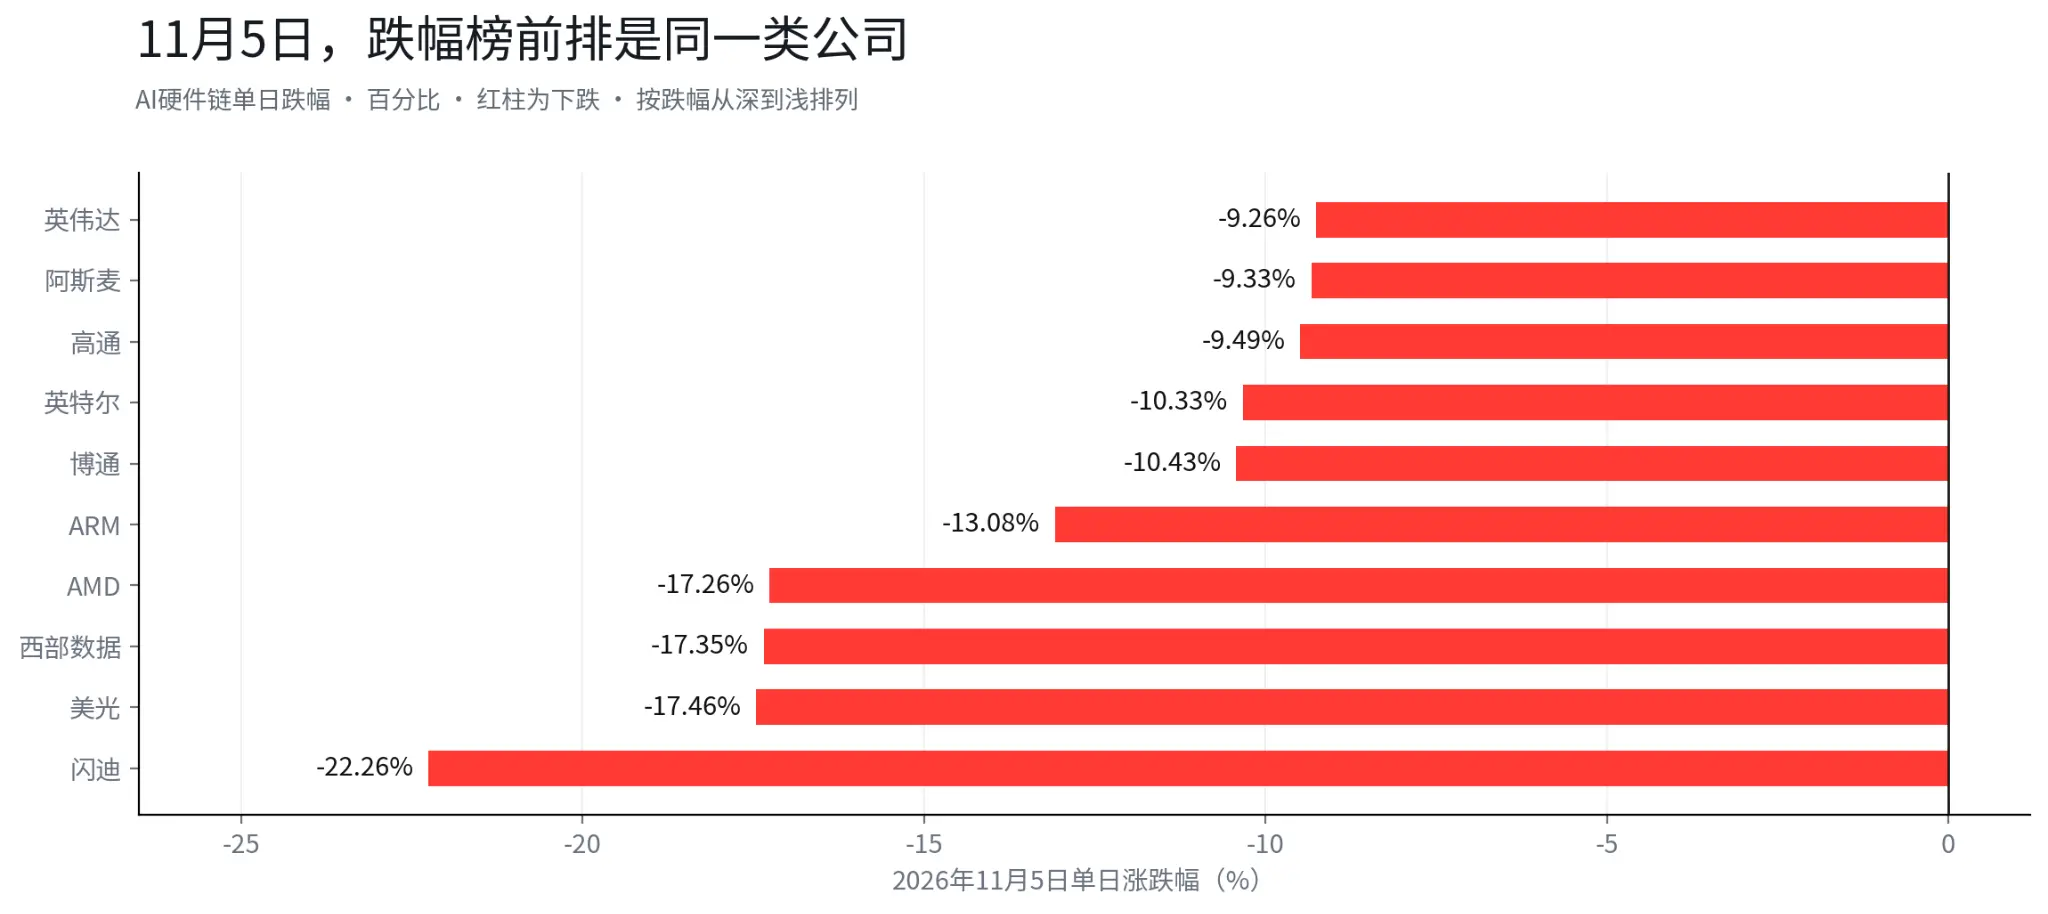
Caption: Daily drop percentages of major AI hardware chain stocks on November 5. SanDisk, Micron, Western Digital, AMD, and NVIDIA all recorded declines of over 9%. The red bars represent declines, measured in percentage.
In the three days following the drop, the market showed another side. On November 6, the S&P 500 ETF slightly rebounded by 0.31%, and on November 9, there was a noticeable rebound, with the S&P 500 ETF rising by 2.36% and the Nasdaq ETF by 3.54%. However, once the CPI was released on November 10, some of the gains were given back, with the Nasdaq ETF dropping 0.68% that day. Within a week, there were significant drops, rebounds, and then declines again; this is the typical rhythm during a period of unstable interest rates, where being overly bearish or chasing gains can easily lead to losses on both sides.
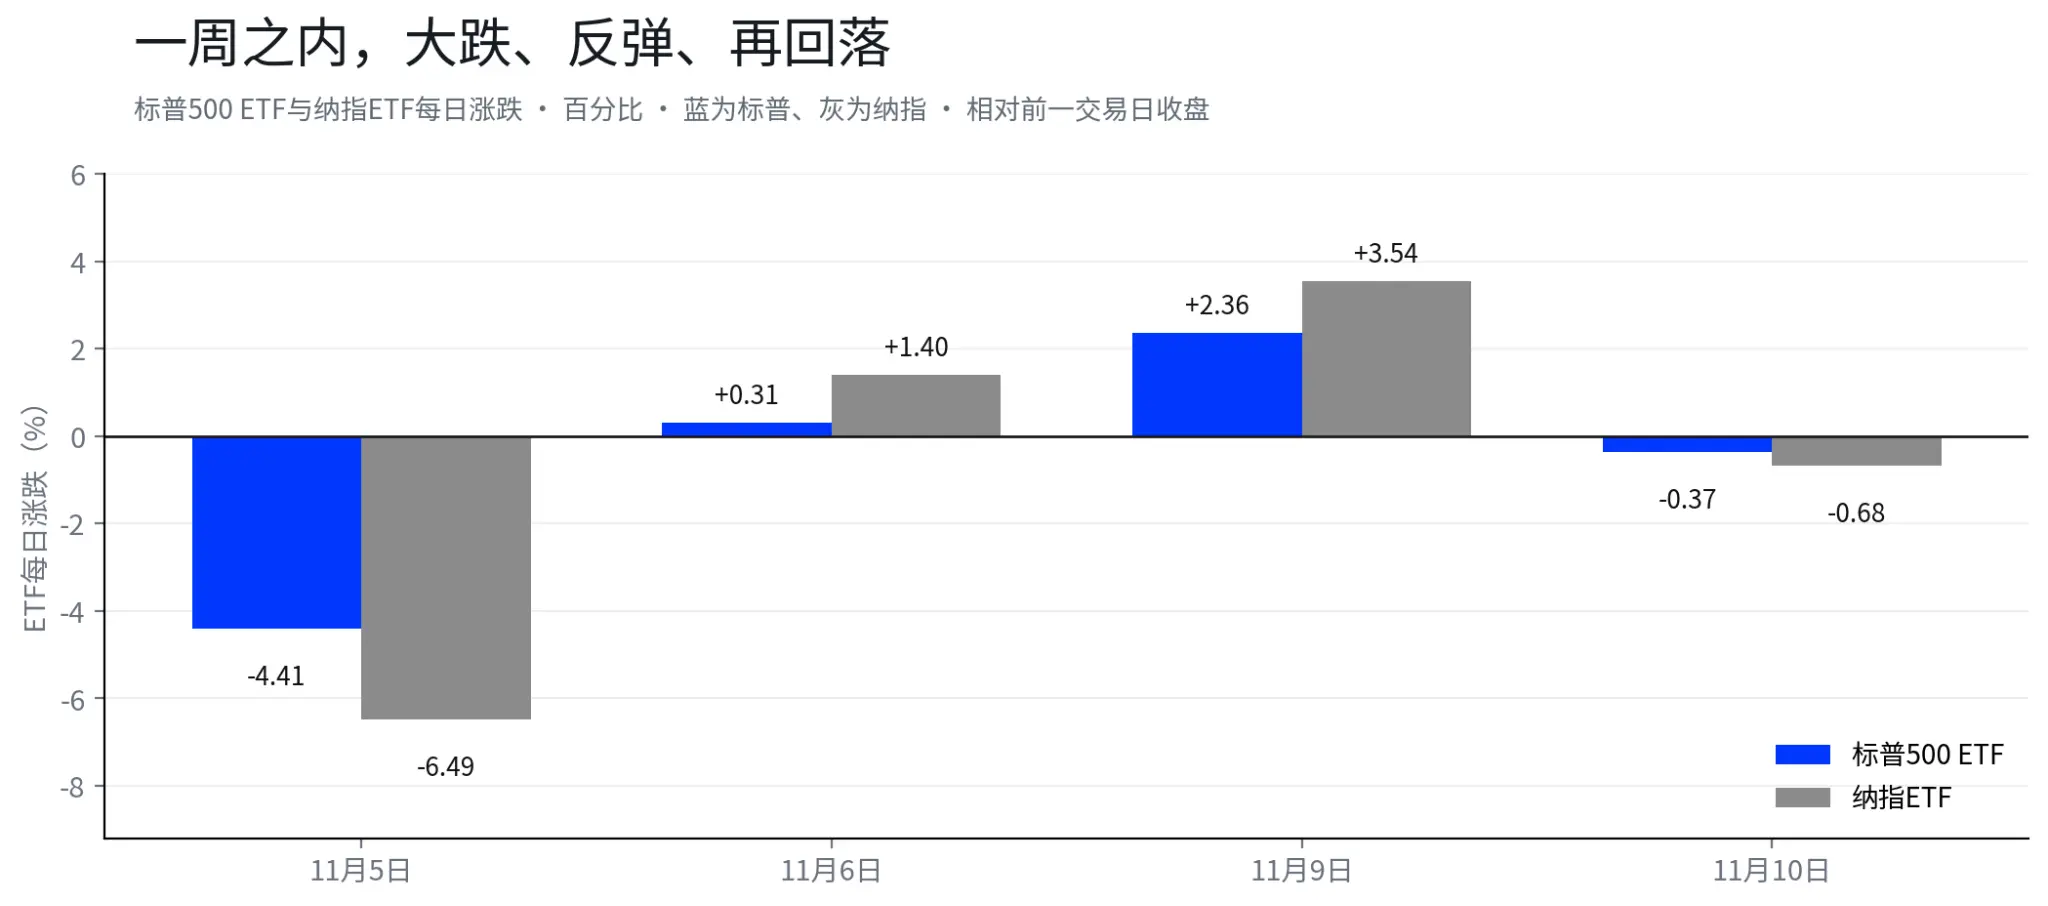
Caption: Daily fluctuations of the S&P 500 ETF and Nasdaq ETF from November 5 to 10. There were consecutive rebounds on November 6 and 9, followed by another decline on November 10. The blue bars represent the S&P 500 ETF, and the gray bars represent the Nasdaq ETF, measured in percentage.
Looking at names like NVIDIA, AMD, Micron, Western Digital, and CoreWeave together, the commonality is clear. Valuations are either based on cash flows several years out or sustained by rounds of financing. When the discount rate rises, the present value of long-term cash flows drops the fastest, and financing costs rise with interest rates, leading to pressure from both sides. This is the pool with the highest sensitivity to interest rates; during the phase when the US10Y stands above 5%, the stocks at the top of the decline list are always these.
CoreWeave exemplifies this logic most completely. From a closing price of $63.93 on October 28 to $43.66 on November 5, it fell about 32% over six trading days, approximately 65% from its 52-week high of $138.25. When the earnings report was released on November 10, revenue grew by 168% year-on-year, and guidance was raised, causing the after-hours price to jump about 7.4%. The revenue is real, and the reliance on financing is also real; good revenue can provide a boost, but interest rate news can push it back down. The conclusion is simple: CoreWeave is more suitable to be tracked in a high financing sensitivity pool and should not be placed in the same oversold tech basket as Microsoft, Broadcom, and TSMC.
What I want to convey here is not "these stocks should not be touched," but to make you aware of where the volatility mainly comes from during a rising interest rate phase. The proportion of such stocks in your portfolio determines how much your account sways with the US10Y.
3. Don't Treat AI Stocks as a Whole; Divide Them into Four Baskets
Interest rate sensitivity is one thing; whether it's worth waiting for a pullback is another. By separating AI-related holdings based on cash flow strength and valuation levels, you end up with four baskets, each requiring different actions moving forward.
Core Observation Basket, for stocks with relatively stable cash flows. Earnings and free cash flow are backed by the latest earnings reports: Microsoft's latest quarterly net profit was $36.629 billion, Broadcom's last quarter net profit was $13.088 billion with free cash flow of $13.665 billion, and TSMC's third-quarter net profit was NT$762.6 billion with free cash flow of NT$510.1 billion. The logic is to first see if the US10Y has stopped rising, then wait for valuations to return. When the market overall de-risks and brings them down, they tend to decline less than the sector and stabilize first.
Waiting for Pullback Basket, such as Google. There are no issues with earnings; the third-quarter net profit was $26.468 billion. What needs to be verified is whether the chain of AI capital expenditures, cloud and AI revenue, and free cash flow can hold up. The free cash flow for the quarter was negative $9.065 billion, due to a capital expenditure of $51.355 billion in a single quarter. The specific issue to watch with Google is when such high capital expenditures will convert back into cash flow. If capital expenditure growth starts to slow in subsequent quarters while cloud and AI revenue continues to rise, the market will reprice this investment.
High Volatility Trading Basket, exemplified by NVIDIA, AMD, Micron, and Western Digital. This basket not only looks at the US10Y but also monitors the AI capital expenditure cycle and the guidance from the next earnings report. A decline in interest rates alone does not constitute a buying reason; continued upward guidance on downstream capital expenditures does. The top decliners on November 5 and November 10 were all in this basket.
High Financing Sensitivity Basket, with CoreWeave as an example. If the interest rate and financing environment do not improve, "it's already dropped a lot" cannot be a buying reason. These companies should be tracked in a volatile market, taking some profits on rebounds, and not leveraging to buy during sharp declines; each earnings report is a point to reassess holdings.
After dividing into four baskets, one point needs to be clarified first. This is an observational framework based on cash flow and valuation, not a recommendation list. Companies within the same basket can differ significantly; the names mentioned are just examples filtered by the latest earnings reports. The actual screening criteria are more important than the list itself, and each company should be re-evaluated based on the latest earnings report before taking action. The question readers should ask has shifted from "Can AI stocks be bought?" to "Which basket does my stock belong to?" This determines how it should be treated in this interest rate environment.
4. Three Paths for US10Y, Three Corresponding Actions
The upcoming round of U.S. stock trading may be divided into three layers: US10Y impacts valuation pressure, earnings reports influence profit expectations, and cash flow affects whether AI investments have materialized.
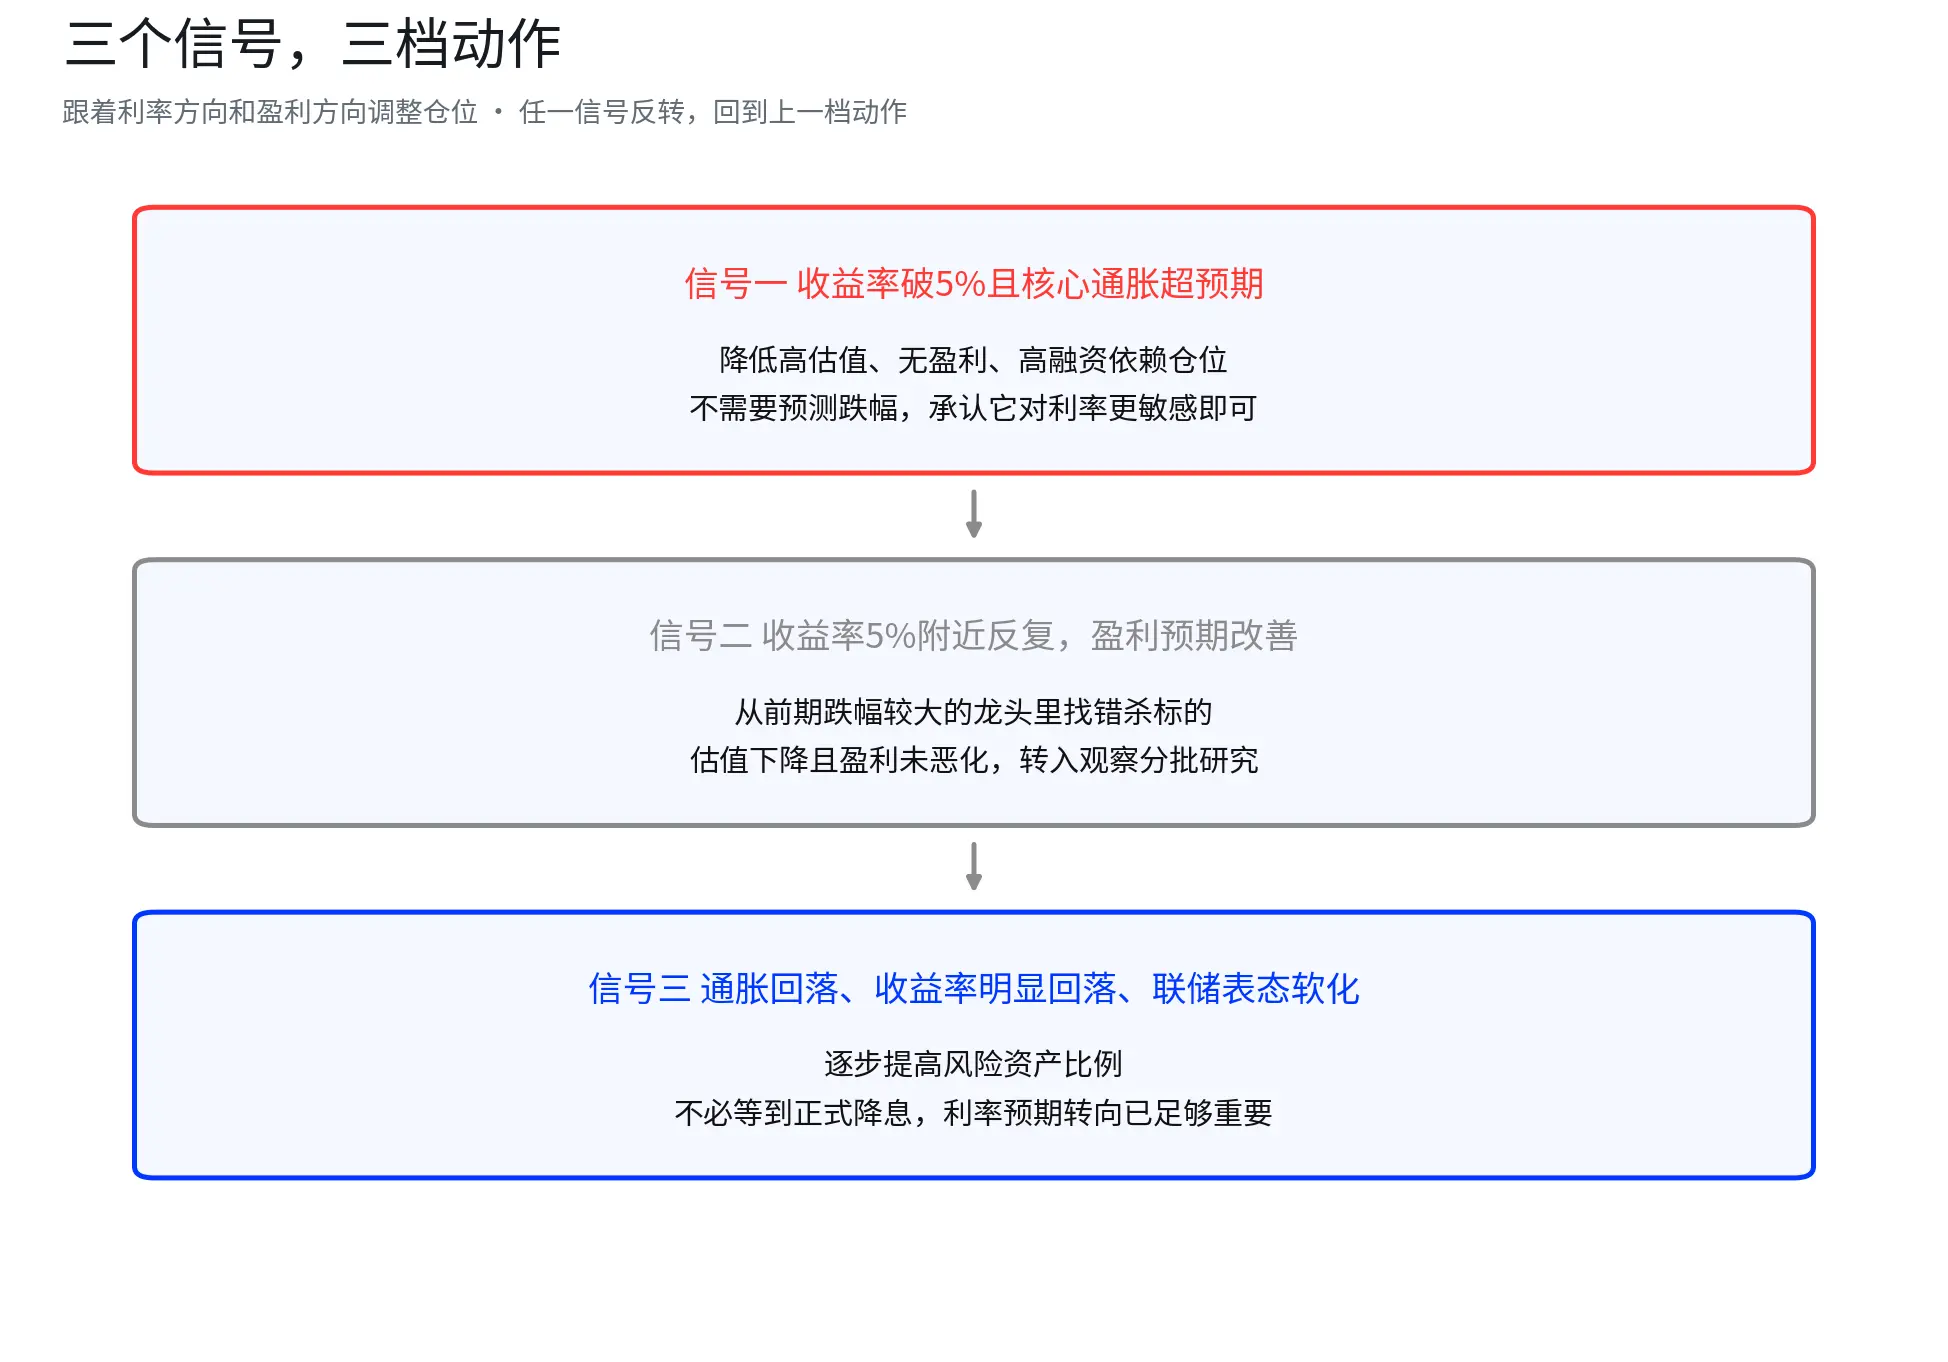
Caption: One corresponds to contraction, two corresponds to observation and phased research, three corresponds to gradually increasing risk assets. Any deviation returns to the previous action.
The first scenario is when US10Y stands above 5% and continues to rise. At this point, one should not only look at US10Y itself but also the spread between the 2-year and 10-year rates, the relative performance of the Nasdaq and Philadelphia Semiconductor Index against the broader market, and the relative strength of high-valuation growth versus profit-oriented tech. The action here is to continue reducing positions in high-valuation, negative cash flow, and financing-dependent stocks. Those still wanting to stay in the stock market might consider shifting towards defensive positions; the two options will be discussed in detail in the fifth section. Stocks like CoreWeave, which are subject to repeated volatility, should be handled on a swing basis, avoiding chasing declines or leveraging to buy. Rushing to buy back could be the most expensive mistake at this stage.
The second scenario is when US10Y remains high but does not set new highs for several consecutive trading days, and the stock market also does not set new lows in tandem with rising yields. This phase is easily overlooked and is where real opportunities lie. The index may still look poor, but some stocks have already stabilized. At this point, one should focus on two things happening simultaneously: yields not setting new highs and stocks not setting new lows. If US10Y remains high but NVIDIA, AMD, and the Philadelphia Semiconductor Index are no longer following yields to set new lows, it indicates that the market is starting to price in a peak in interest rates ahead of time, which usually occurs earlier than waiting for the Federal Reserve to officially pivot. At this stage, it is not about increasing positions; rather, the task is to narrow the observation list from the AI sector to specific stocks, identifying the first batch of candidates to buy back. Wait for US10Y to clearly decline before taking action, as good prices are likely to have already been picked off by the market.
The third scenario is when US10Y truly turns downward and inflation data also cools. In this scenario, the relative outlook for the four types of stocks may improve in phases, with those supported by cash flow potentially being more resilient than those that are cyclical or reliant on external financing. The three actions are not a one-way street. If US10Y rises back above 5% again, revert from the third scenario back to the first.
5. Directions to Watch During the Waiting Period: Defensive Sectors and Short Bonds
After completing the reduction in positions, the next question is what to watch. Sitting idle in the account incurs interest losses; immediately buying back stocks means no reduction has occurred. There are two directions: focus on defensive sectors for those wanting to stay in the stock market, and short bonds for those temporarily leaving the stock market.
First, look at defensive sectors. On the day of the big drop on November 5, the healthcare ETF fell by 2.50%, the consumer staples ETF fell by 0.75%, and the utilities ETF fell by 0.71%, while the Nasdaq dropped by 5.52%. From the close on November 4 to November 10, the S&P 500 ETF was down 2.2%, and the Nasdaq ETF was down 2.5%, while utilities turned positive and healthcare nearly recovered. The role of defensive sectors during this time is to provide a less volatile resting place for those who have reduced high-valuation positions but still want to stay in the stock market. They may not capture the gains from AI but also do not bear the pullbacks from AI, waiting for clearer interest rate signals and buying conditions from the growth basket before switching over.
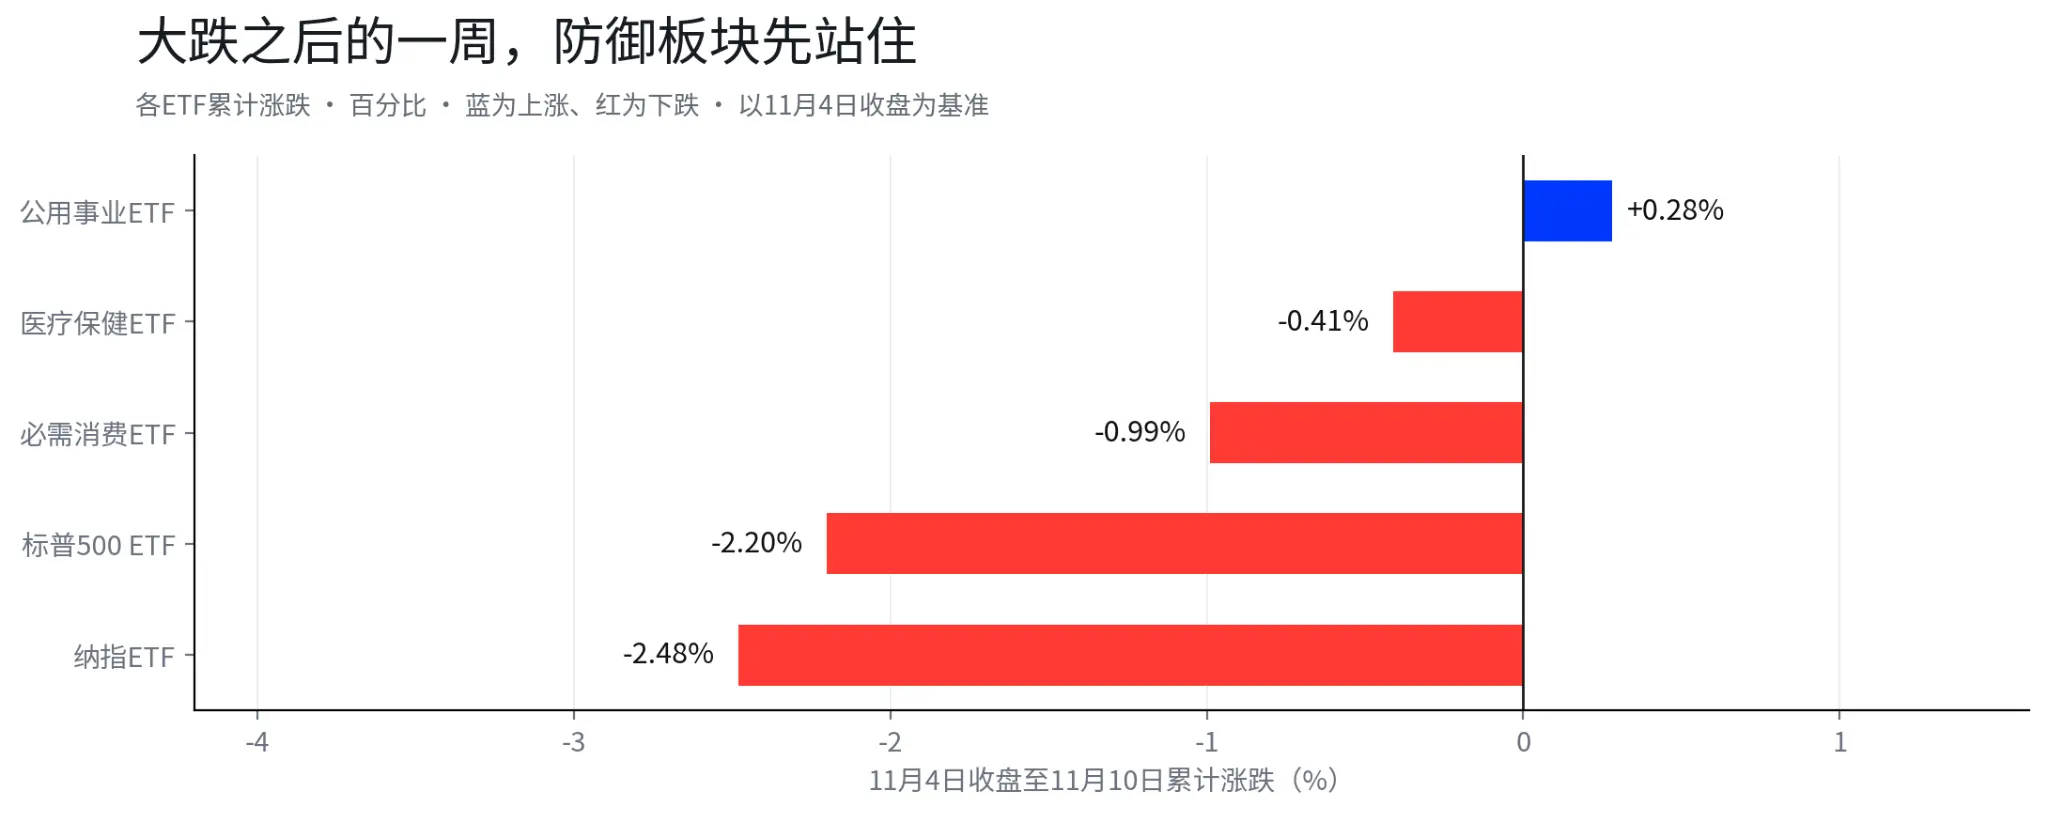
Caption: Cumulative gains and losses of various ETFs from the close on November 4 to November 10. The Utilities ETF turned positive, while the declines in Healthcare and Consumer Staples were significantly smaller than those of the S&P 500 and Nasdaq. The blue bars represent gains, and the red bars represent losses, with units in percentage.
Another option is the short-term U.S. Treasury ETF, suitable for that portion of money looking to temporarily exit the stock market. SGOV, BIL, and SHV are based on short-term U.S. Treasury bonds, with returns coming from interest and an extremely short duration. For example, SGOV has an effective duration of about 0.09 years, meaning its price is basically unaffected by interest rate movements. The underlying Treasury bills continuously mature and roll into new bonds; the higher the short-end rates, the higher the returns on the new investments. The 30-day SEC yield read 3.79% at the end of October, which is higher than the idle interest in most brokerage accounts.
The rapid interest rate hikes in 2022 serve as a ready comparison. SGOV, BIL, and SHV had total returns of approximately 1.58%, 1.38%, and 0.94% for the year, respectively, while the long-duration TLT fell 31.41%.
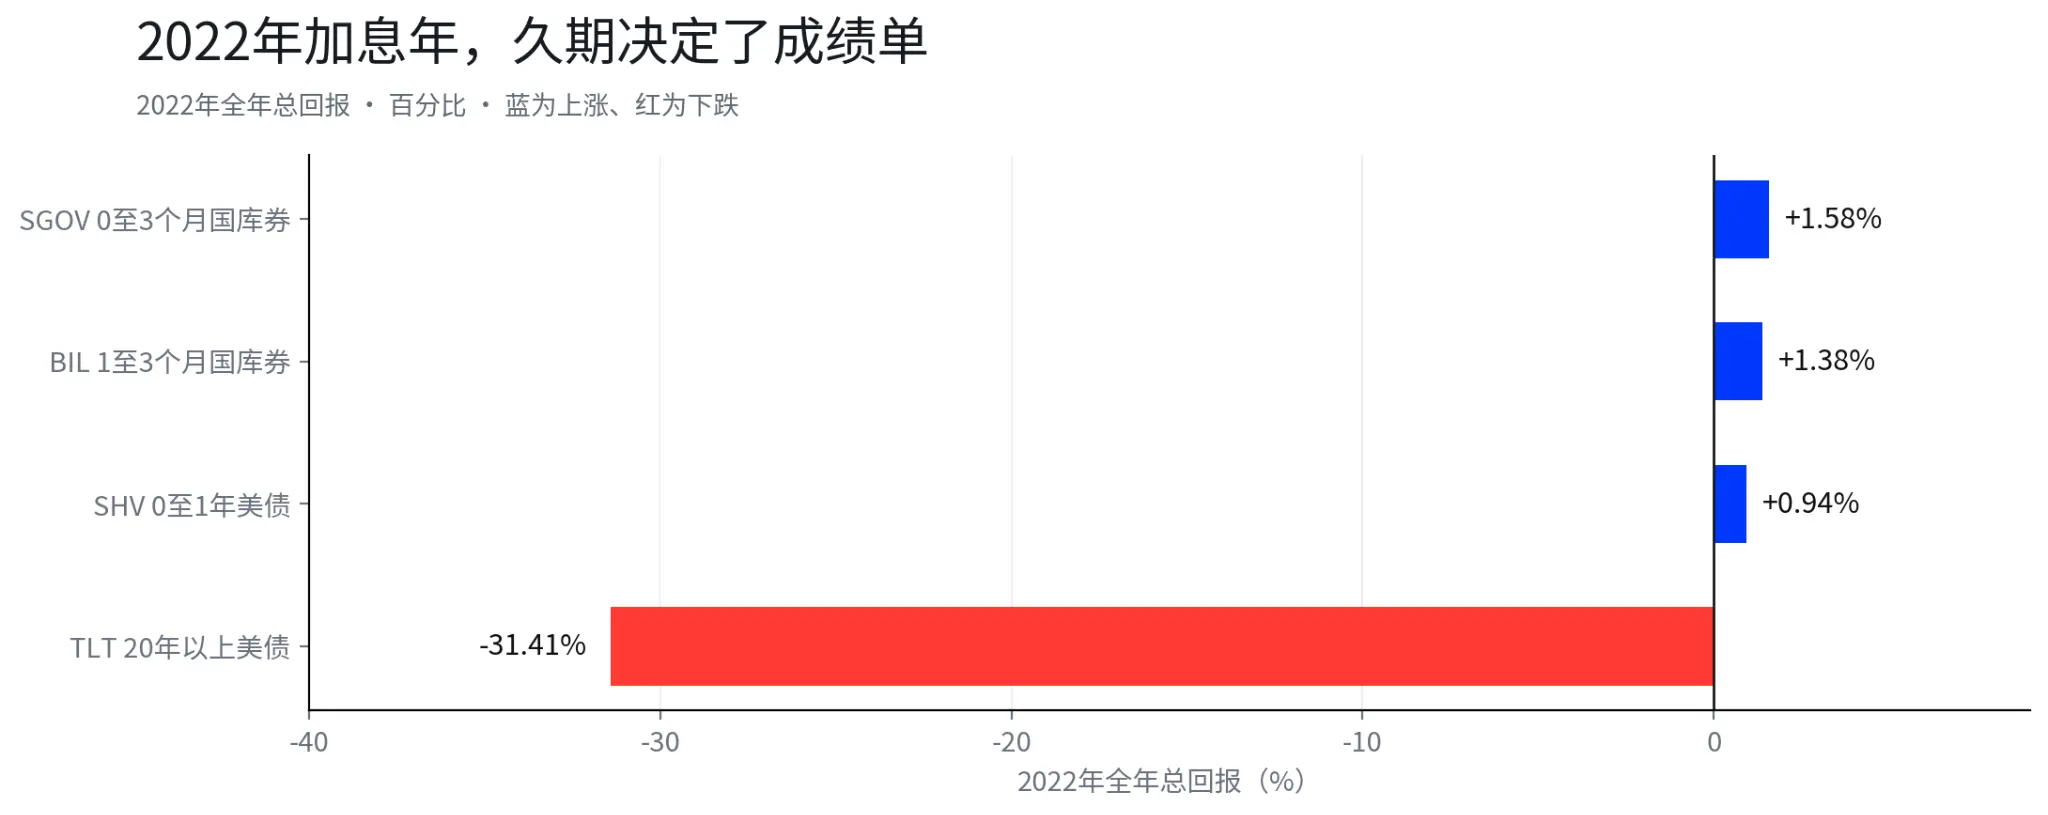
Caption: Total return comparison for the entire year of 2022. SGOV, BIL, and SHV all had positive returns, while the long-duration TLT fell 31.41%. The blue bars represent gains, and the red bars represent losses, with units in percentage.
Here’s a specific arrangement. Originally, an investor with 100 units of capital and 20 units set aside for a potential pullback in AI tech stocks would split that 20 units in half: keeping half in defensive sectors in the stock market and placing the other half in short-term debt instruments, where the short-term debt portion accumulates at an annualized rate of over 3% daily. Once the US 10Y peaks and companies on the watchlist show qualifying pullbacks, the investor can gradually shift back into stocks according to the basket order outlined in Section Four. Selling stocks, moving money in, taking profits, and returning based on signals—these four steps connect, allowing the investor to maintain profits while retaining the ability to act.
This arrangement has nothing to do with being bearish. Those reducing their positions might still believe in the long-term potential of AI; short-term debt merely ensures that the waiting period is not in vain.
VI. When the next data comes out, four items need to be verified
For this framework to work, it relies on verifying four data points when they are released.
The yield on the 10-year U.S. Treasury, whether it continues to reach new highs. This corresponds to valuations and determines whether the pool sensitive to high interest rates is expanding or contracting.
Core inflation, whether it continues to exceed expectations. This is the source of the US 10Y, and the next CPI and monthly non-farm payrolls will signal in this regard.
Earnings expectations for leading companies, whether they have been downgraded. The drops in names like Nvidia and AMD don’t count; what matters is whether the guidance for the AI capital expenditure cycle has changed in the next earnings report.
Cash flow, whether AI capital expenditures have started to convert into revenue and free cash flow. The growth rate of Google’s capital expenditures and the revenue growth rate of its cloud business are the most intuitive indicators for this item.
Review these four sets of data weekly, adjusting positions according to the results. Positions do not need to be adjusted all at once; the key is to ensure that both new funds and reduced funds follow the signals, keeping the account connected to the market.
What truly needs to be prepared in advance is a set of positions that can adjust with market changes; simply betting on "a 25bp rate hike in December" is not useful. If the US 10Y continues to rise, reduce high valuation risks; if the US 10Y stops reaching new highs, start looking for oversold leaders where the fundamentals have not deteriorated; if inflation falls and yields turn, gradually reinvest the waiting positions. The market will not tell you where the bottom is in advance, but it will continuously provide signals. When signals appear, having positions, cash, and a prepared list is more valuable than guessing any single interest rate decision.
Subject to applicable qualifications and jurisdictional restrictions, BIT provides U.S. stock trading services to qualified users, supporting trading in individual U.S. stocks and short-term U.S. Treasury ETFs, as well as funding methods such as stablecoins and traditional wire transfers. Investors can trade different types of assets such as U.S. stocks and short-term U.S. Treasury ETFs based on their risk tolerance and investment goals, and flexibly adjust their positions as market conditions change. The specific range of tradable products, fees, and service terms are subject to the latest information from the platform.
Disclaimer: The content of this article is for general information and market commentary purposes only, compiled from publicly available information as of the time mentioned in the text. Relevant market data, expectations, and probabilities may change with market conditions. The views and investment strategies cited from third-party institutions, analysts, or others represent the views of those third parties at a specific time and do not represent the views or recommendations of BIT. This article does not constitute investment advice, investment research, solicitation, or a recommendation for any securities, investment products, or trading strategies, nor should it be the basis for any investment decision. Financial markets carry risks, and securities prices and market performance may fluctuate; past performance and historical market trends do not represent or guarantee future results. Investors should independently assess the relevant risks based on their own circumstances and seek professional advice when necessary.
 Risk warning Risk warning




Popular articles