Are we in a huge bubble of NFTs and public chains?

 We are in the early stages of the first real "consumer opportunity" wave of cryptocurrency, where NFTs have a bubble, but there are also opportunities.
This article is sourced from the FTX Blog, compiled by Chain Catcher.
If you turn on the television or read financial media, financial experts and investors are discussing the topic of "everything bubble." Financial bubbles have multiple stages, and while each frenzy has its nuances, in hindsight, the experiences of the market and its participants almost always share commonalities.
Howard Marks: "We are in an everything bubble"
Dr. Jean-Paul Rodrigue published a widely circulated economic bubble chart in which he identified four different stages of a bubble, referred to as (i) the stealth phase, (ii) the awareness phase, (iii) the mania phase, and (iv) the blow-off phase. 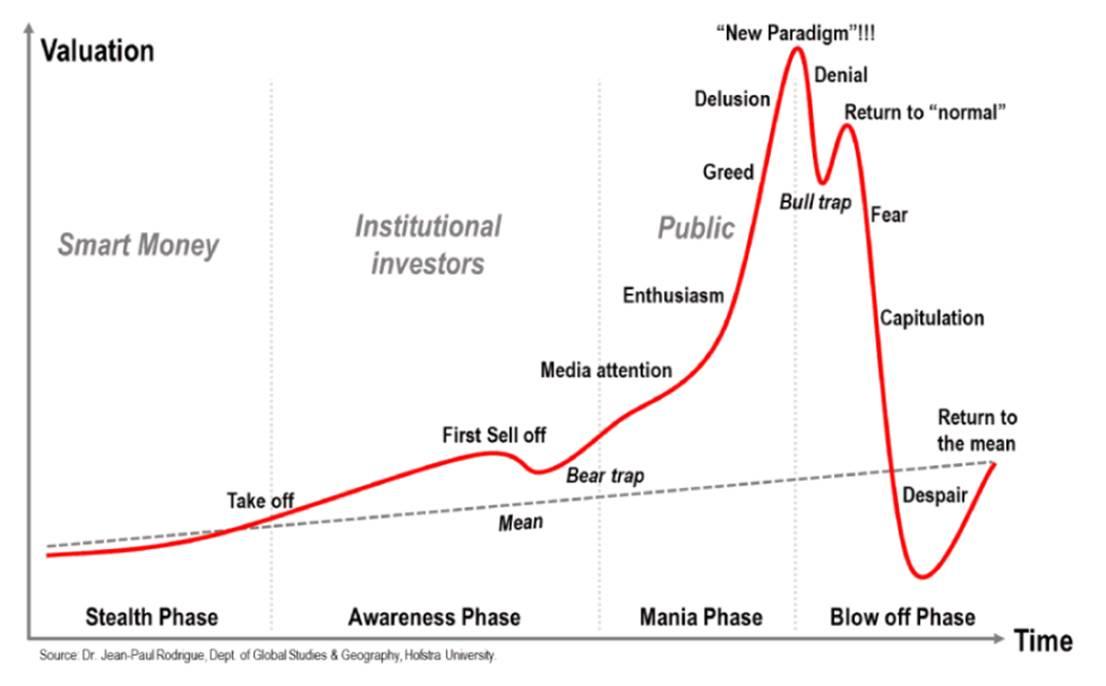
The decline of the S&P 500 index is seen as a sign of a "bubble" occurring. According to Bank of America data, there have been 17 different 30% pullbacks in the S&P 500 index since its inception, with 4 occurring in the past 30 years (2020, 2007, 2002, 2000), where the "blow-off" phase was catalyzed by the COVID-19 pandemic, the Global Financial Crisis (GFC), 9/11, and the tech bubble.

Little discussion has focused on the psychology of market participants at each stage, especially as the duration of the awareness/mania phase lengthens. This is our current situation. Despite a 30% drop from February to March 2020, the rebound was so swift that for most market participants, it felt like an extension of the bull market in risk assets since March 2009. Some market participants refer to it as "everything bubble."
In the current "mania phase," we seem to have experienced two distinctly different stages, with unprecedented fiscal and monetary stimulus, real yields, and corresponding risk asset appreciation intensifying this phase.
- There Is No Alternative (TINA) 1.0 - As signs of mania/blow-off phase begin to permeate, early adopters prefer to hold cash as it is "safe." We see personal savings rates hitting historic highs, companies raising cash and pausing dividends/buybacks/M&A, etc.
- TINA 2.0 - After experiencing several months of negative real yields, people began to shift to consider the downsides of holding cash, as the negative wealth effect is very real. Watching asset prices continue to appreciate around them, people began to deviate from the risk curve, which typically peaks in the "blow-off" phase.
The theory of "everything bubble" is overly simplistic and does not fairly represent all markets, so we hope to dissect the causes of these "bubbles." And if we do see a "blow-off" phase, where are the opportunities?
Monetary/Fiscal Stimulus
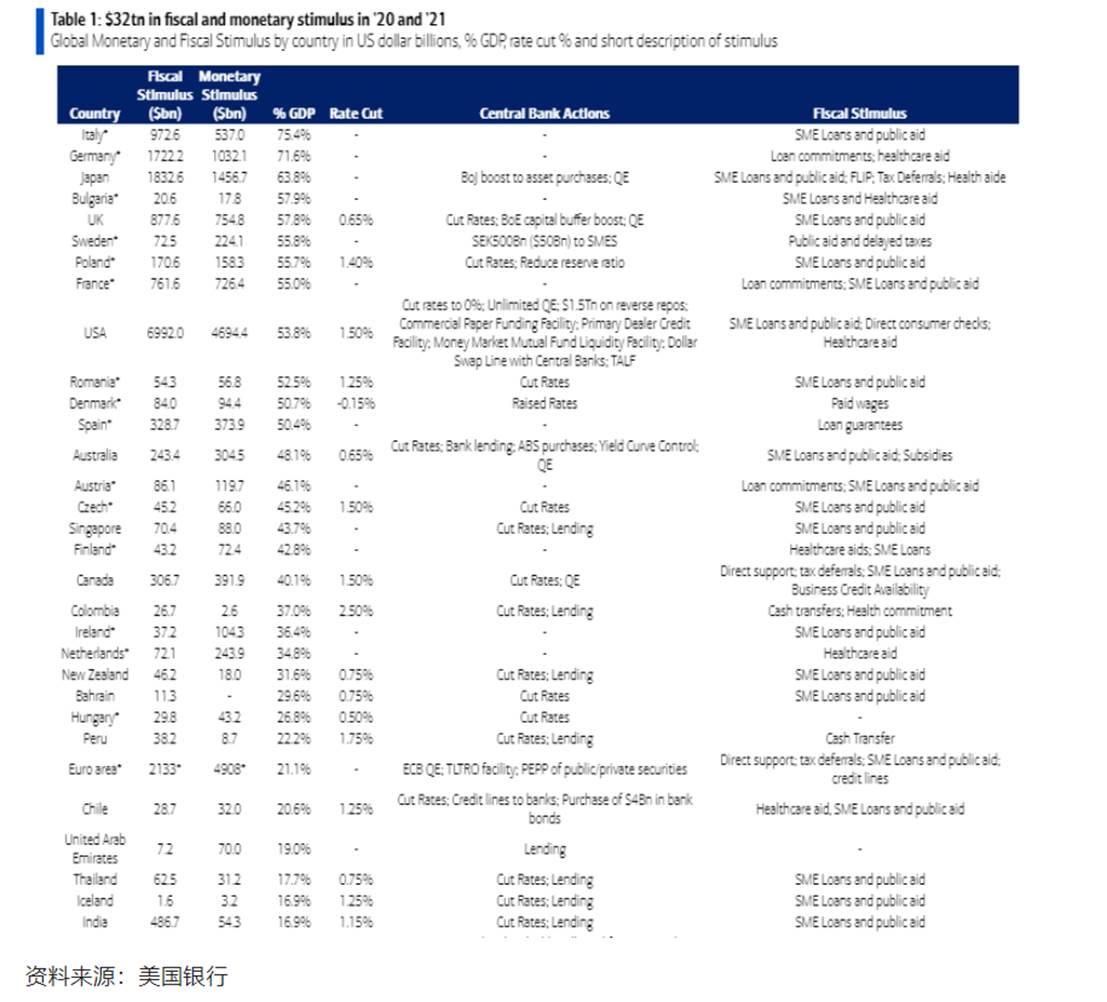
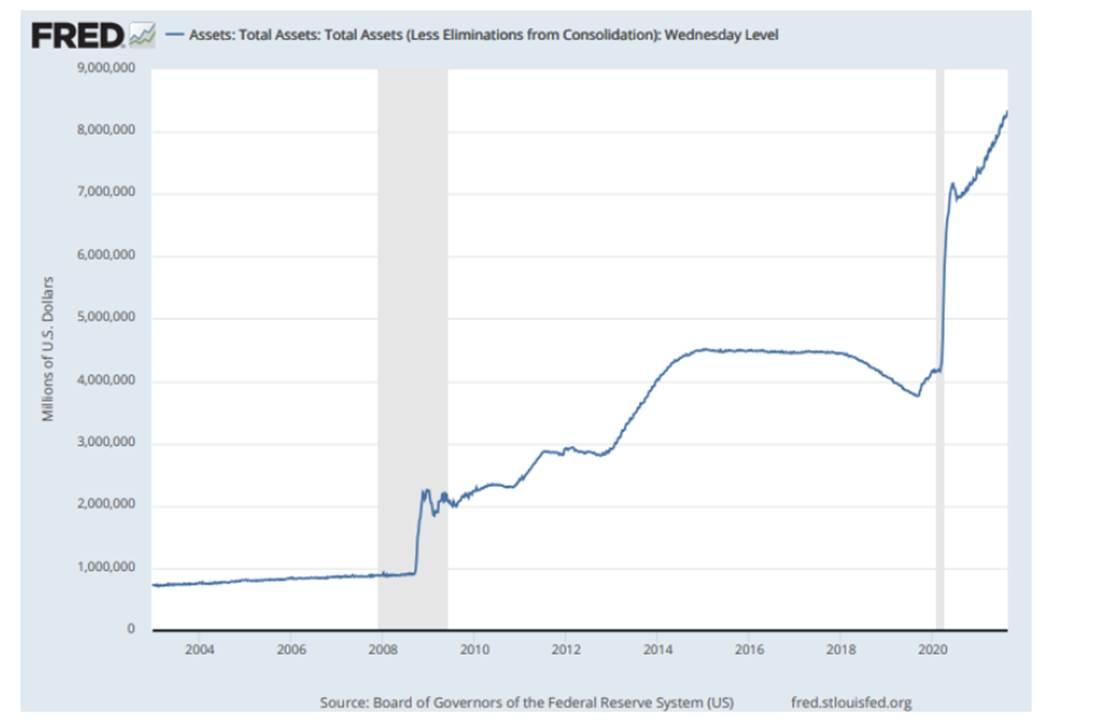
Since the COVID-19 pandemic, $32 trillion in fiscal and monetary stimulus has been implemented globally, the largest amount of stimulus in history relative to global GDP. During this period, global central banks have spent $834 million per hour buying bonds, with about 25% of government bonds currently yielding negative returns. Considering inflation, the proportion of negative real yields is much higher.
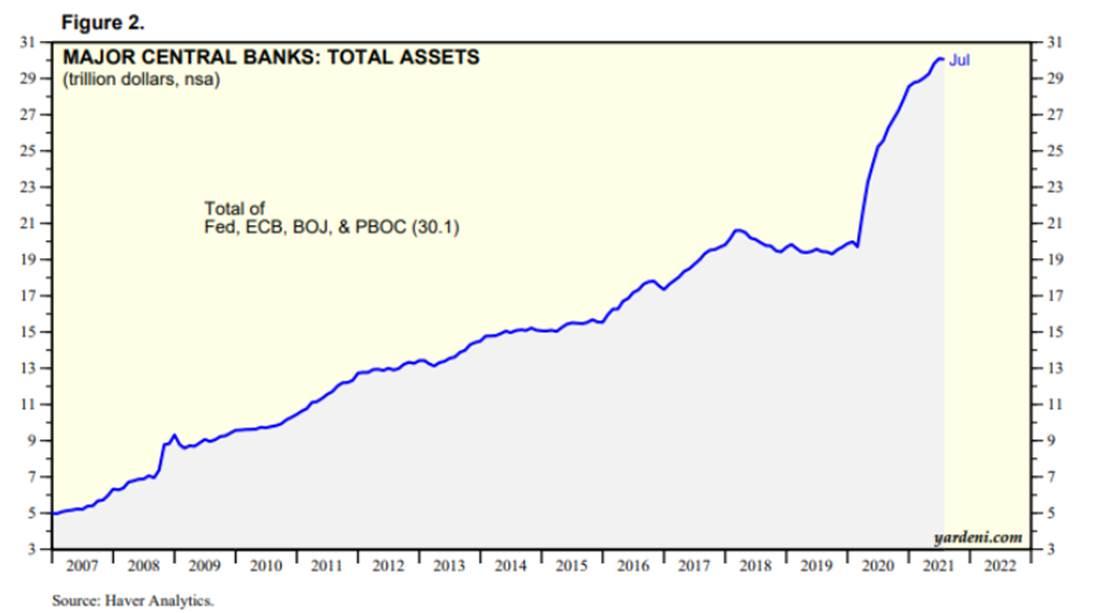
In the U.S. alone, the Federal Reserve has purchased $4 trillion in bonds over the past 18 months, while the U.S. government has spent $875 million per hour in 2021.
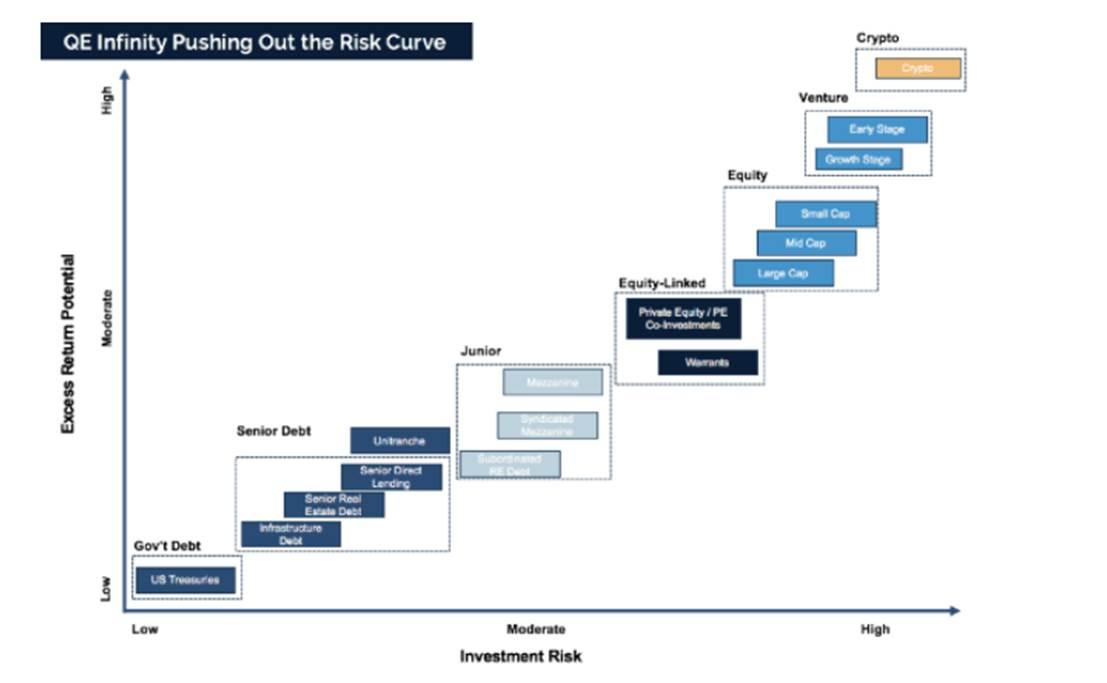
This has further deviated people from the risk curve. As we have said in the past, "unlimited quantitative easing turns your savings account into a checking account, the bond market into a savings account, the stock market into a bond market, and the venture capital market into the stock market, which in turn has made the crypto market the new venture capital market."
Response of Physical Assets
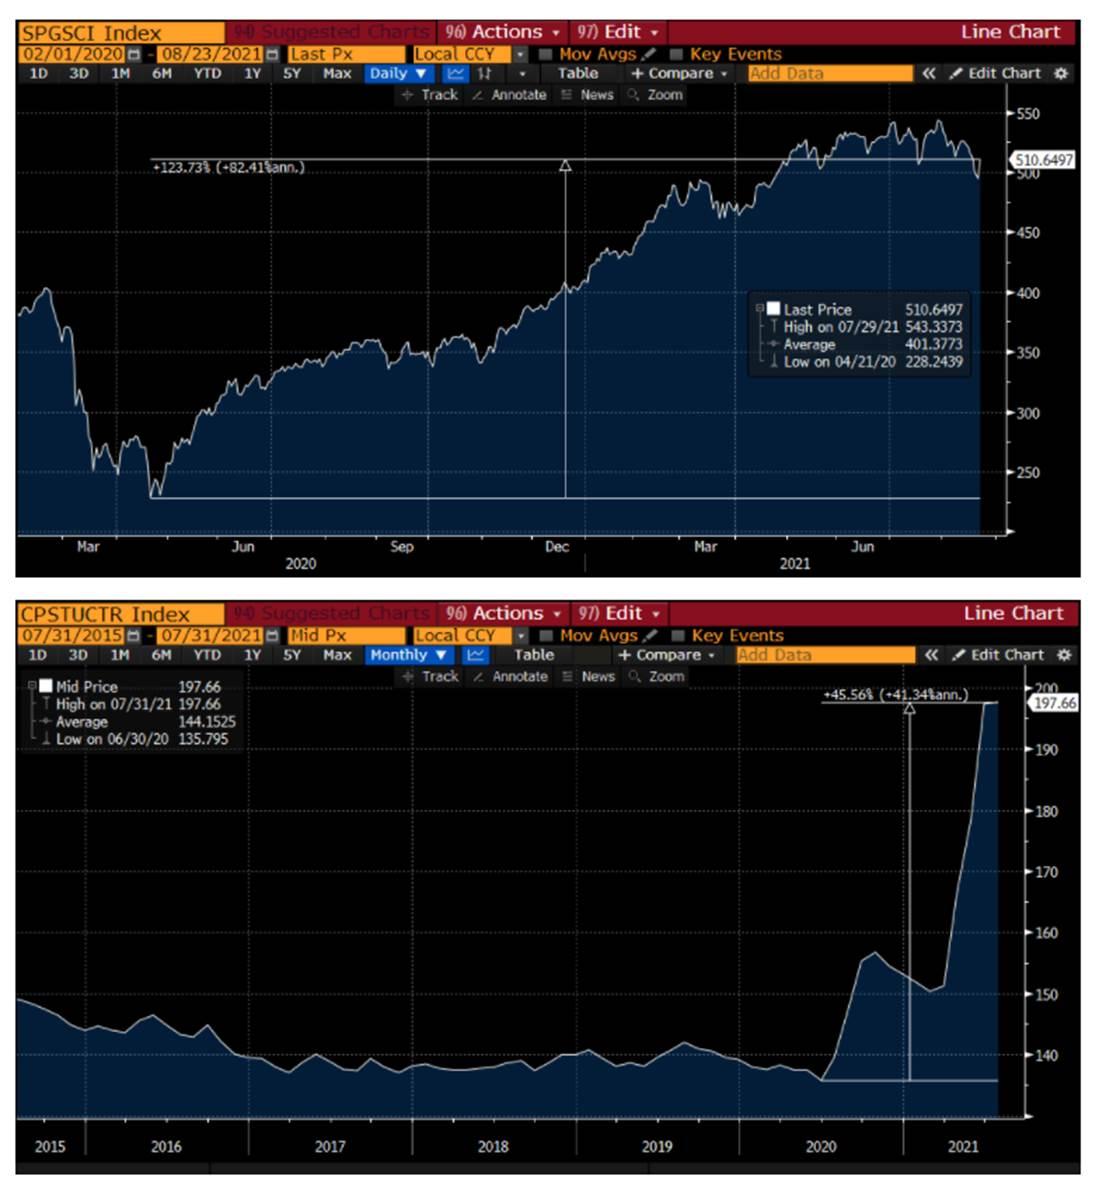
We have seen significant appreciation in commodities, with the S&P GSCI index rising 120% from its low in March last year, copper up 102%, aluminum +82%, corn +80%, nickel +49%, gold +22%, and so on… At one point, we saw lumber prices rise 300% (still 20% higher than levels in March 2020), while the U.S. CPI used car value index rose 45% year-on-year.
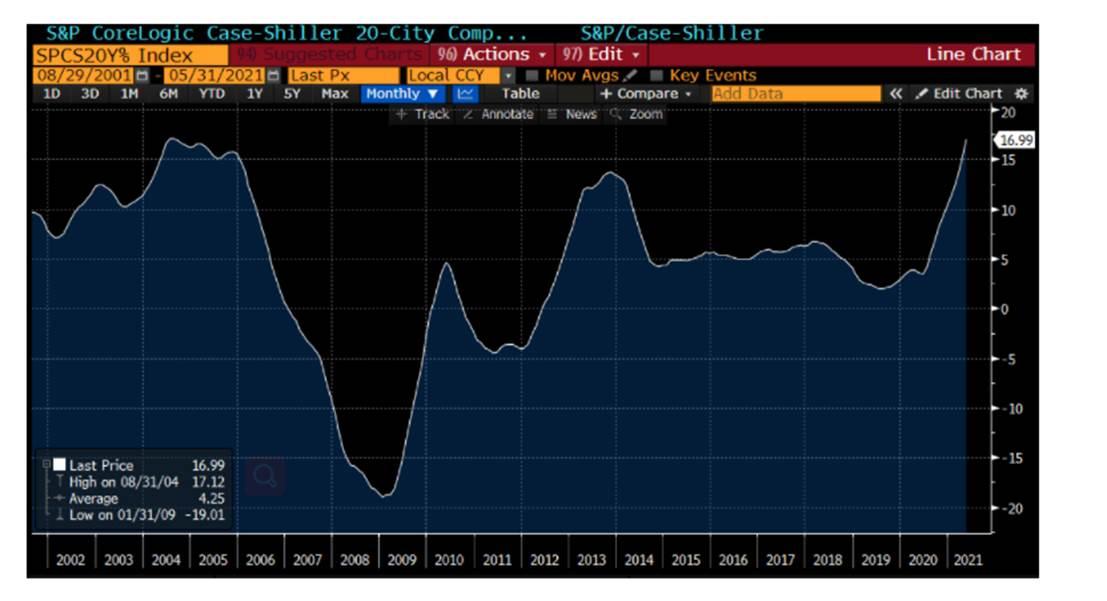
If we look at the S&P CoreLogic Case-Shiller 20-City Composite Home Price Index, we find that the year-on-year increase is approaching levels seen in 2004-2006. Currently, the median home price is a multiple of the median income, at a historical high.
Is There a Bubble in Physical Assets?
Are we in a bubble of physical assets? It depends:
- Commodities: When we consider electric vehicles, policy-driven decarbonization goals, and macro tailwinds for renewable energy, one common theme is "everything electrified." Currently, in the commodity world, there is a "six giants" story playing out among copper, nickel, silver, lithium, cobalt, and aluminum, with the supply-demand dynamics of the first three being the clearest. For example, there has been no demand destruction for copper so far, and there is no known technology other than copper that can conduct electricity. In cars, efficient motors consume 75% more copper than standard motors, and electric vehicles consume four times as much copper as ICEs, requiring copper-intensive charging stations. Additionally, renewable energy, including wind and solar, consumes 4-5 times more copper than traditional fossil fuel generation. Therefore, there are real demand drivers for copper.
- In contrast, when lumber prices rose 300% in less than 12 months due to shortages (which were quickly alleviated), a bubble appeared, but for most commodities, the market has effectively offset the increase in demand by increasing supply when feasible.
- Used Cars: The rise in used car prices is unsustainable. Due to supply chain shortages and behavioral shifts, automakers have been unable to produce the number of cars needed to meet demand. Given the average ownership duration of cars and the alleviation of supply chain bottlenecks, this situation is easing. A 2006 Ford Mustang may not continue to appreciate at over 20% per year.
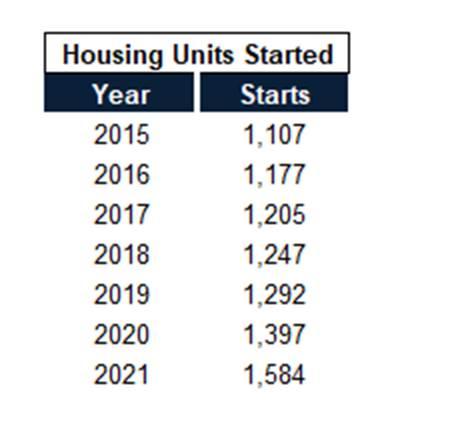
- Housing: Possibly. The only time we have seen home prices rise this quickly was before the real estate crisis. Nevertheless, in the decade following the Global Financial Crisis, we saw a substantial shift, with a structural shortage of homes in the U.S. The National Association of Realtors (NAR) estimates this number at 5.5 million (2 million single-family homes, 1.1 million 2-4 unit homes). Freddie Mac estimates the current housing shortage at 3.8 million units.
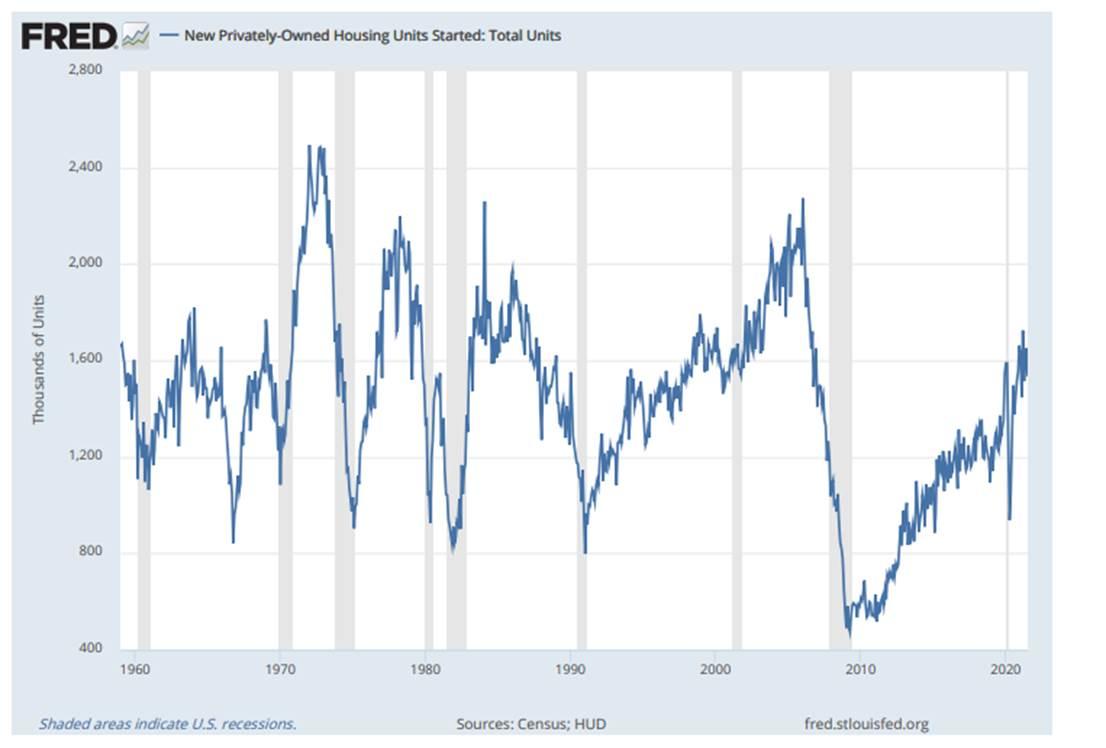
From 1968 to 2000, an average of 1.5 million new homes were added each year, while from 2010 to 2020, this number hovered around 1 million. However, as home builders observe the trend in home prices, coupled with the millennial generation finally starting to buy homes, you can expect supply to begin to climb towards 1.5 million, potentially reaching 1.8-2 million per year, which will limit the pace of existing home price appreciation and could even trigger the start of the "next round" when supply catches up with demand.
Stock Market Response
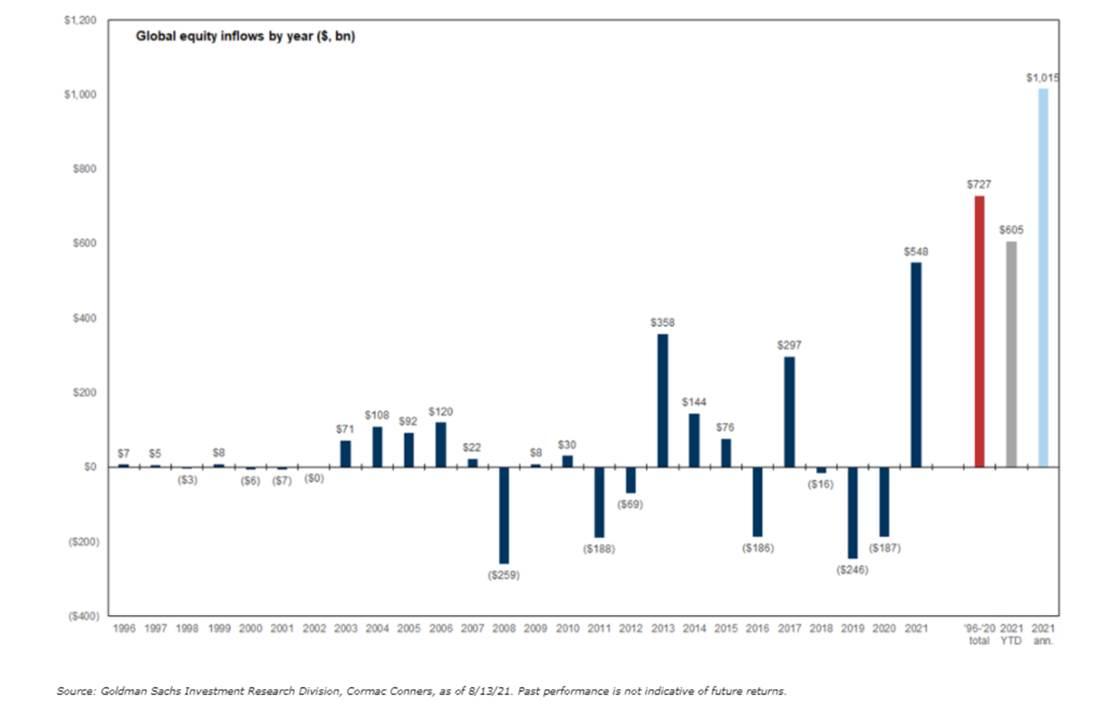
How has the stock market responded to these unprecedented fiscal and monetary stimulus measures? In the spirit of TINA 2.0, funds have flowed into the stock market at an unprecedented pace.
As of early August, Global Equity funds have seen inflows of $605 billion year-to-date, projected to reach $1.015 trillion for the year, equivalent to $3.98 billion per day. Global equity funds have accumulated inflows of $727 billion over the past 25 years (1996-2020), averaging $115 million per day. 2021 is expected to exceed the total of the previous 25 years by 40%.
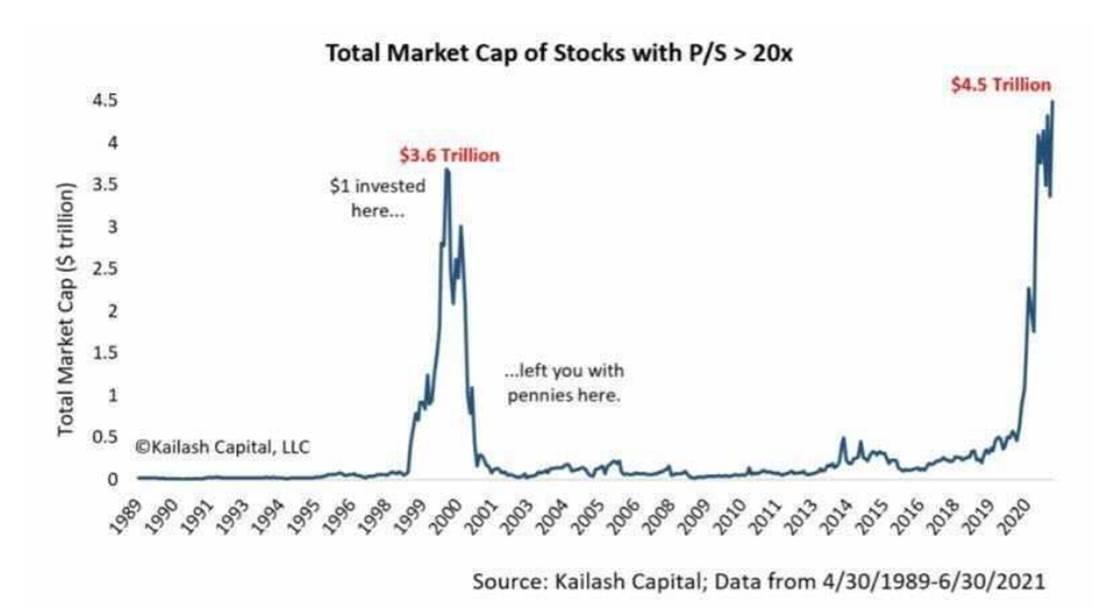
While we have seen an increase in the number of companies going public through IPOs/SPACs, the number of investable companies has not kept pace with the inflow, leading to a re-rating. Looking at the total market capitalization of stocks with a P/E ratio over 20, we have surpassed the tech bubble peak by nearly $1 trillion.
If it feels like the market is hitting new all-time highs every other day, it's because it is. As of August 24 this year, the S&P 500 has set 50 new all-time highs, with only two instances in history having so many new highs in August: 1964 and 1995.
Is there a bubble in the U.S. stock market?
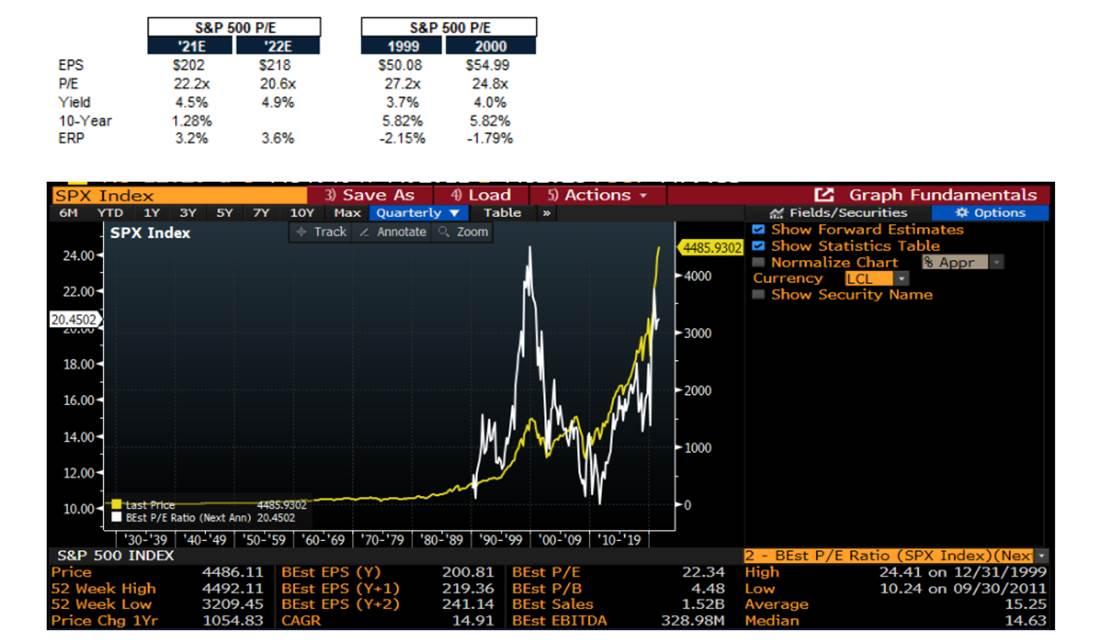
Bears point out that P/E ratios, CAPE, etc., are at historical highs… this does not take into account the equity risk premium and sources of earnings. During the 1999-2000 period, the 10-year Treasury yield was 5-6%, while it is currently around 1.0-1.5%.
Comparing today's S&P 500 index to that of August 24, 1999, the estimated P/E ratio based on earnings per share is 21E/22E, lower than the actual P/E ratio during 1999-2000. However, it is worth noting that the equity risk premium at that time was negative, as U.S. Treasury yields were higher than market yields, whereas today it is +3.2%-3.6%.
Some argue that due to several factors, the broader "fair market multiples" have been re-rated higher based on the multiples from low to high:
- Composition Change ------ Today's largest market constituents are growing faster, have higher profits, and profit margins are higher than those of the largest companies 20-50 years ago, thus ensuring higher multiples under all other conditions.
- Convenience of Diversified Investment ------ The creation of ETFs, along with the ability for investors to easily invest in 500 or 2000 different companies for $5-10, can support higher multiples than highly concentrated portfolios.
- Globalization ------ The proportion of sales of large U.S. public companies outside the U.S. continues to increase, providing stronger geographic diversification than 20-50 years ago.
- Interest Rates ------ As countries increase their debt, they cannot afford higher real interest rates, as interest will become the largest single expense, leading to higher equity multiples under all other conditions.
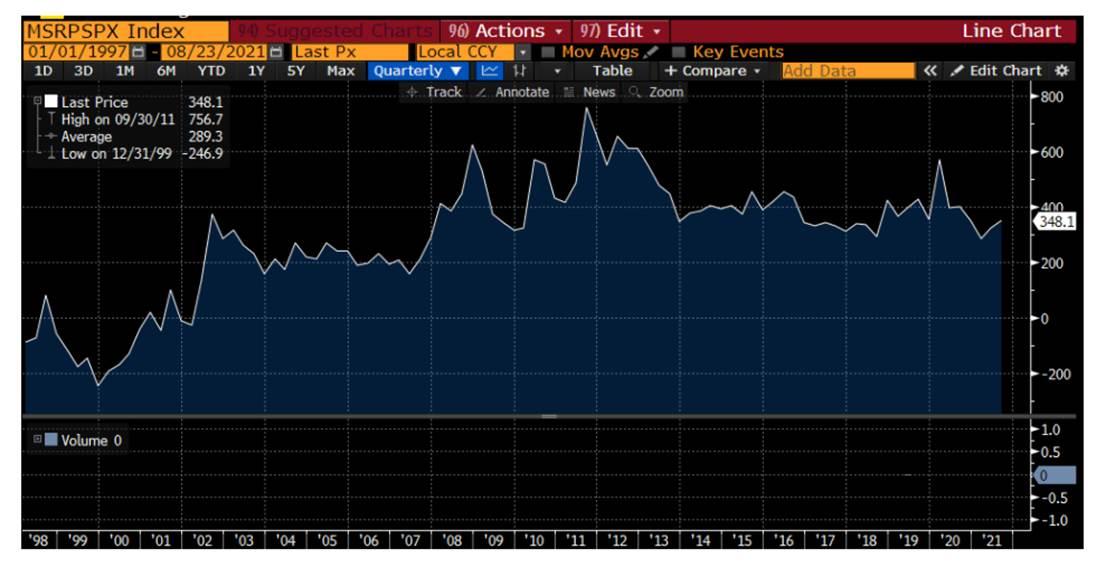
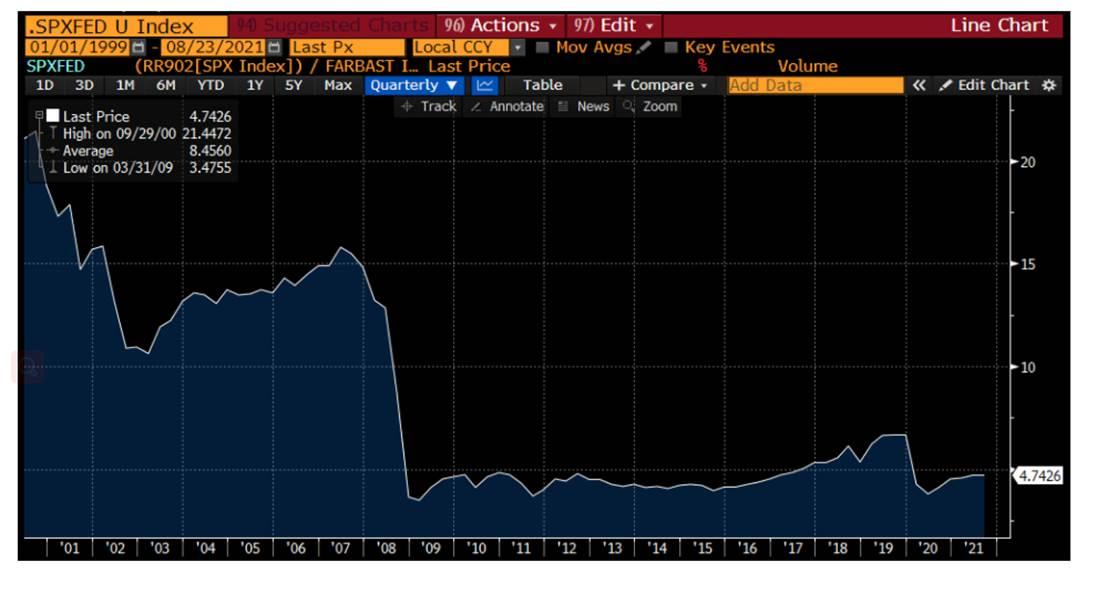
People often say "this time is different," but aside from being the same "index," today's S&P 500 index has almost nothing in common with the S&P 500 index from 30-40 years ago. After the Global Financial Crisis, if you look at the market capitalization of the S&P 500 divided by the Federal Reserve's balance sheet, it has been almost a straight line; "Don't fight the Fed." From January 2009 to now, this ratio has averaged 4.6 times, with a low of 3.4 (March 2009) and a high of 6.7 (December 2019); today, it is 4.7 times, consistent with the ten-year average.
In a TINA world, the U.S. stock market is not "shouting" bubble at current levels.
Private Equity/Venture Capital?
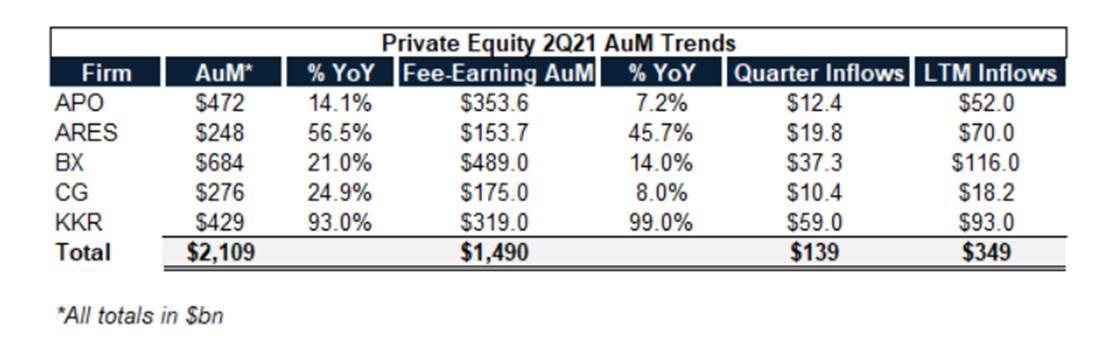
The financing environment is robust. Whether it's KKR or BX raising $59 billion/$37 billion in the second quarter, or the $350 billion capital flowing into APO, APRES, BX, CG, and KKR over the next 12 months, there is an endless interest from allocators in putting money into private equity.
Global private equity investment funds reached a historical high of $1.9 trillion in January 2021, and once these funds have capital, they need to be allocated to repeat this cycle. Acquisition activity in the first and second quarters of 2021 set quarterly records, with a total of $354.2 billion in acquisition transactions across 993 deals in the first half of 2021, surpassing the total of $257.3 billion from 1429 deals in 2020. Considering public market valuations, SPAC capital, and the broader public market's acceptance of growth, the average acquisition multiple in 2020 reached 11.4 times EBITDA.
Risks:
We have seen similar activity in the financing of the venture capital ecosystem, such as Index Ventures raising $2 billion and then another $3.1 billion a year later, Accel raising $3 billion, A16z raising $2.2 billion for a cryptocurrency-specific fund, etc…. So far this year, GPs have raised $74.1 billion, not far from the record of $81 billion for the entire year of 2020.
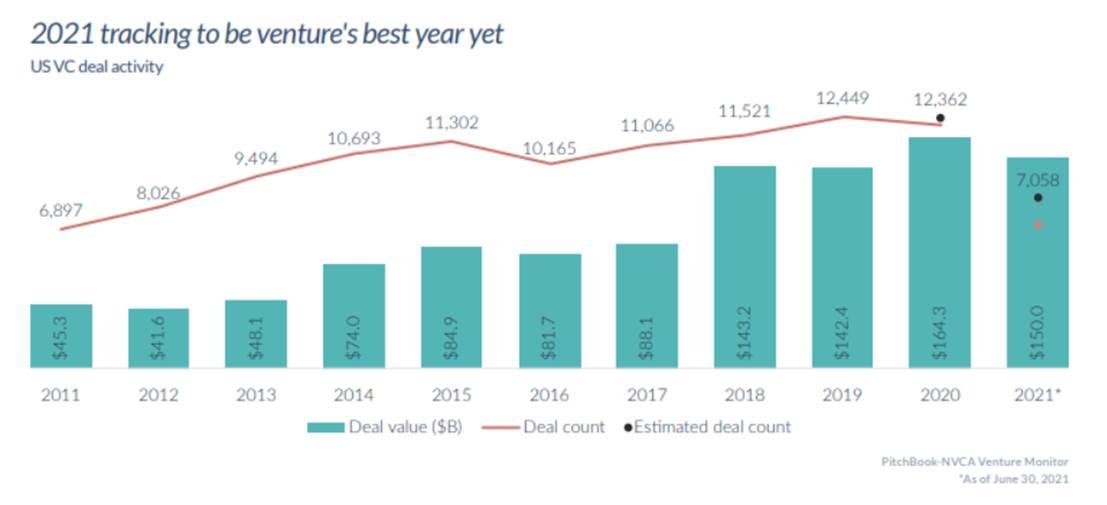
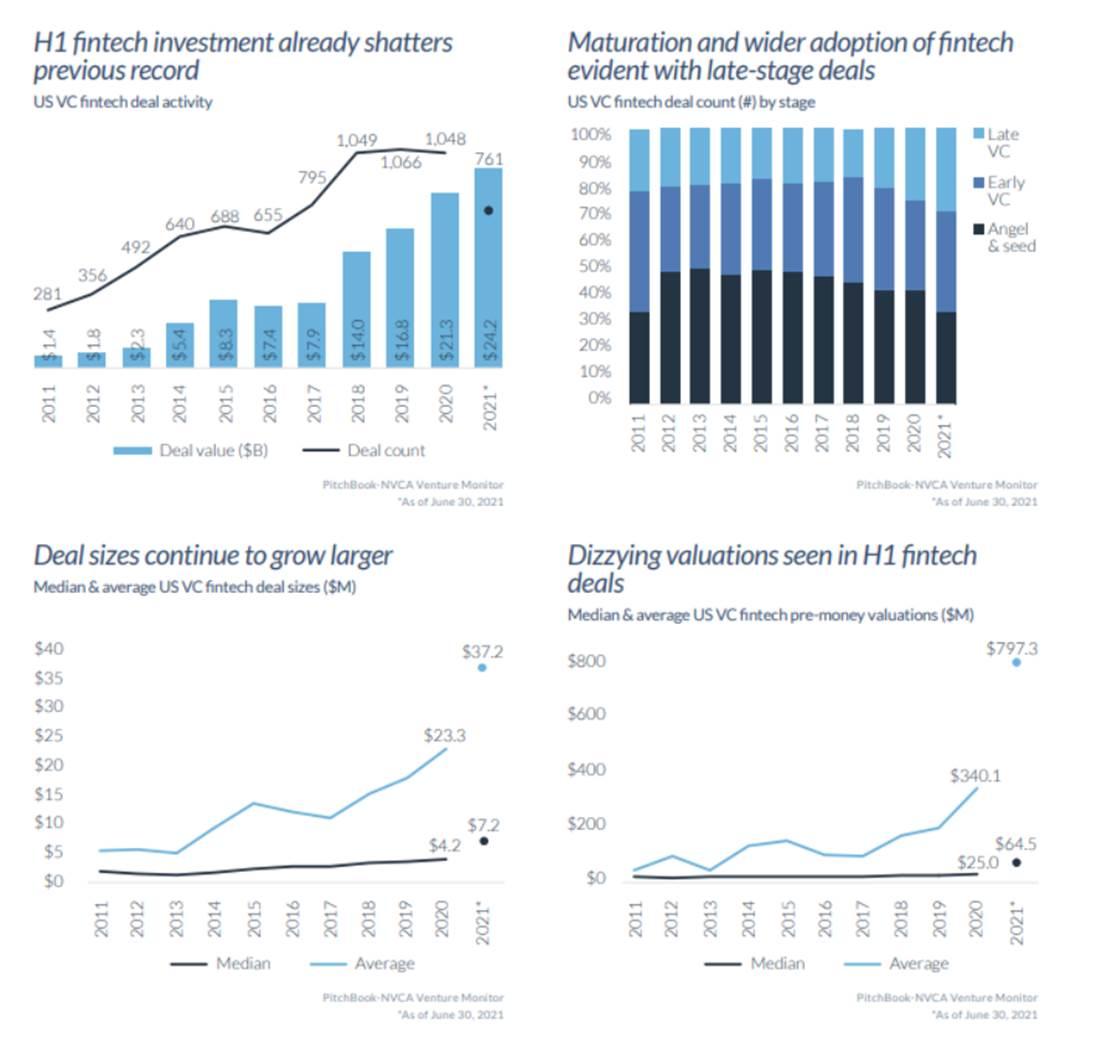
According to Pitchbook/NVCA's "2021 Q2 Venture Monitor," we saw a record $75 billion in venture capital in Q1 2021, and Q2 also reached $75 billion, leading to a total of $150 billion in the first half of 2021. The super rounds of 2021 (over $100 million) have already begun. We saw a record $75 billion in venture capital in Q1 2021, and another $75 billion in Q2, leading to a total of $150 billion in the first half of the year. The super rounds of 2021 (over $100 million) have reached an annual historical high of $85.5 billion.
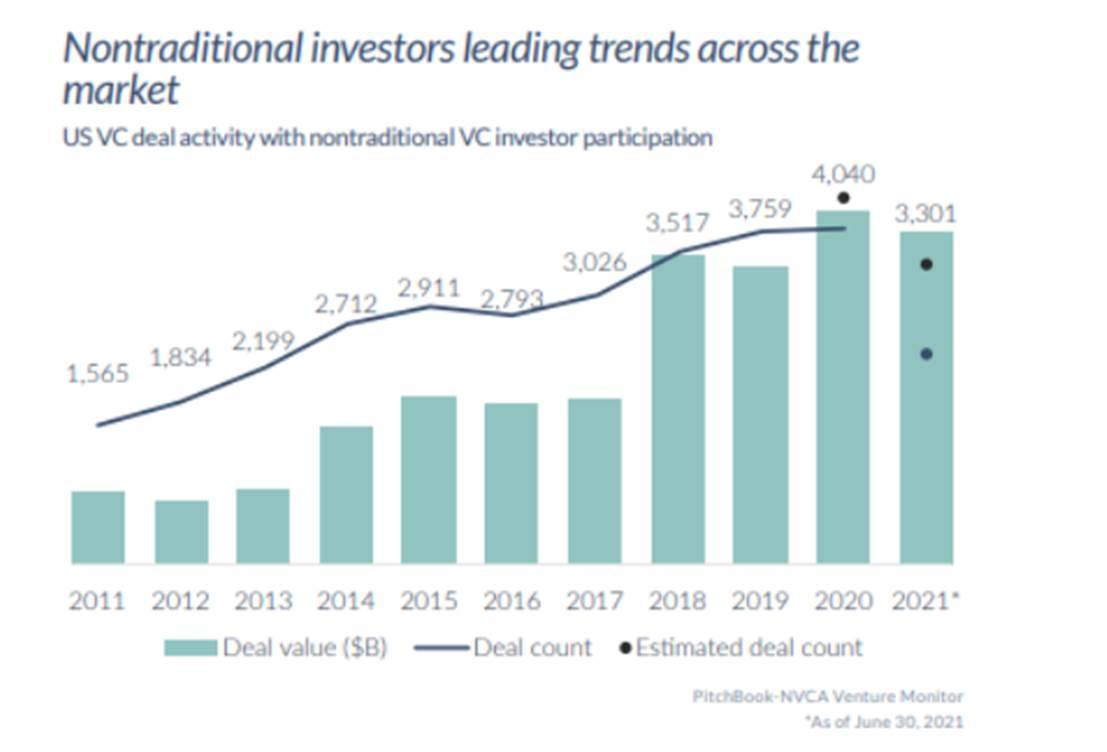
We are seeing more and more "non-traditional" venture capital investors getting involved, such as mutual funds, hedge funds, corporate investors, and crossover investors.
"It is estimated that 3,301 deals received investments from non-traditional institutions (81.8% of the historical high in 2020), with a total deal value of $115.9 billion (close to the total for 2020). While the participation rate of these institutions in deals has only slightly increased in recent years, the deal value represented by non-traditional institutions has skyrocketed. The median size of late-stage deals involving non-traditional investors exceeded $43 million in 2021, nearly $18 million higher than the same median in 2020."
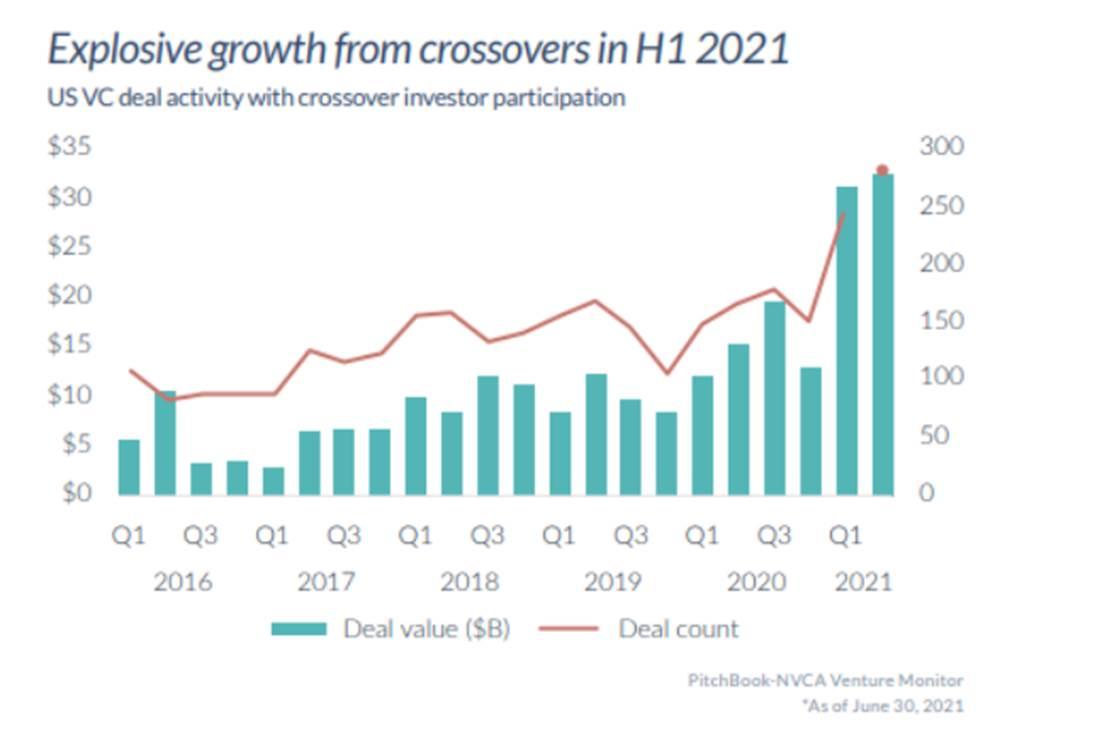
The first half of 2021 witnessed explosive growth in participation from crossover investors, with a total of $63.5 billion in capital across 524 VC deals, expected to exceed $100 billion by the end of the year.
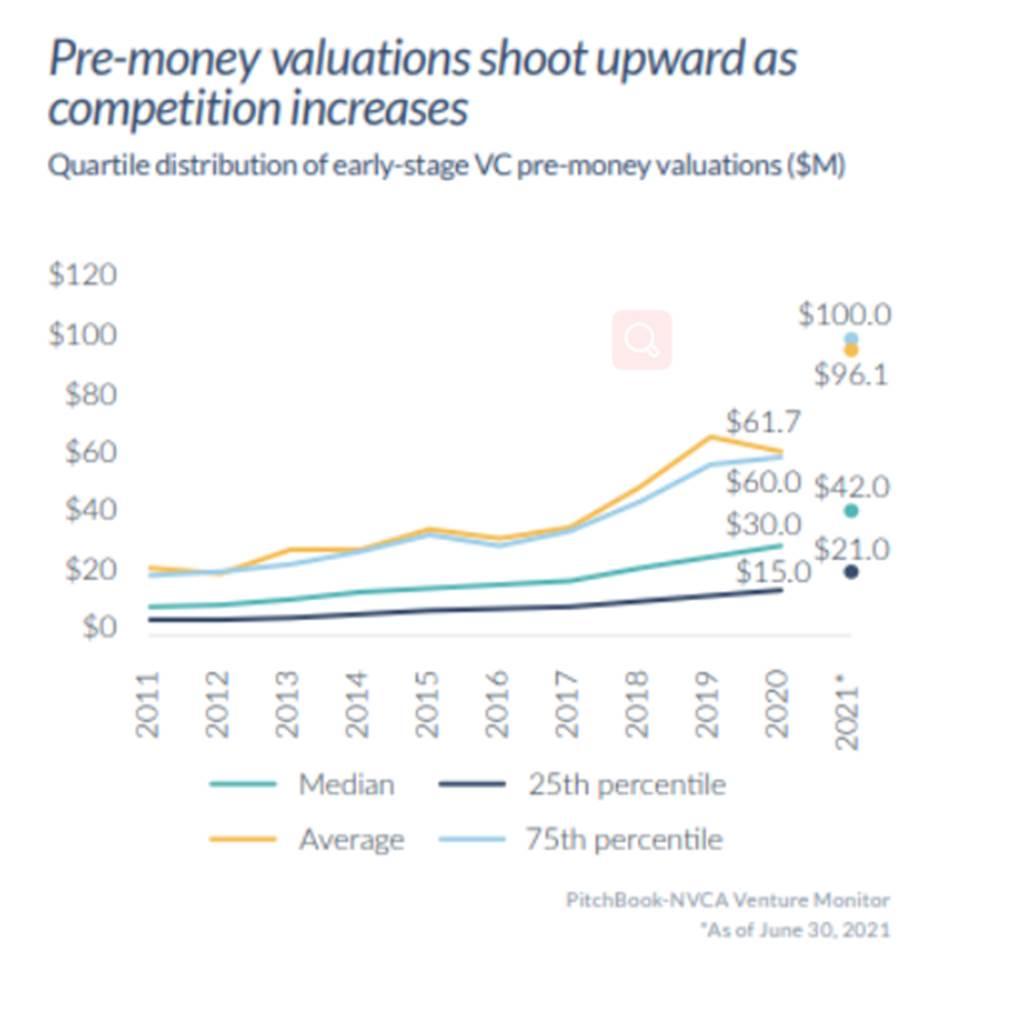
Considering the capital amounts, we see rising valuations in both early and late-stage deals. Pitchbook states: "In terms of valuations, the median and average early-stage valuations in the first half of 2021 also significantly increased to $42 million and $96.1 million, respectively, compared to $30 million and $61.7 million in 2020."
Specifically in the fintech sector, we have seen record capital investments, larger deal sizes, and significant increases in median/average valuations.
Paul Tudor Jones wrote an excellent letter last May titled "The Great Monetary Inflation," in which he outlined assets that could serve as inflation hedges, identifying gold, the yield curve, the Nasdaq 100, and Bitcoin as the most likely assets to outperform.
"I also made the case for owning Bitcoin, which is the essence of scarcity premium. It is actually the only large tradable asset in the world with a known fixed maximum supply. According to its design, the total number of Bitcoins (including those yet to be mined) cannot exceed 21 million. Approximately 18.5 million Bitcoins have been mined, leaving about 10% remaining. On May 12, the Bitcoin mining reward—the rate at which Bitcoin supply increases—was halved for the third time (from 12.5 Bitcoins per block added to the blockchain to 6.25 Bitcoins). Future halvings will similarly occur approximately every four years, according to Bitcoin's design, continuing to slow the rate of supply growth. Some estimate that the last Bitcoin will not be mined for another 100 years."
It turns out this was largely the correct choice, especially regarding Bitcoin.
Crypto Bubble?
Now the "market cap" of cryptocurrencies has risen 1358% over the past 18 months, with BTC rising 885%.
Are we in a crypto bubble? We believe it is important to differentiate between major cryptocurrencies and some more speculative fringe parts while delving into BTC, Layer 1 smart contract protocols/DeFi, and NFTs.
Bitcoin
On Black Thursday last year, Bitcoin was sold off by about 50%, and few could have predicted that 18 months later, our Bitcoin price would reach $50,000, with companies like Square, Tesla, and Microstrategy purchasing Bitcoin for their balance sheets, insurance companies like MassMutual buying $100 million, wirehouse banks offering Bitcoin exposure to their PWM clients, or that the $1.2 trillion infrastructure bill might be stalled due to crypto lobbyists, while the SEC indicated that a futures-based BTC ETF might (eventually) be approved in the fourth quarter.
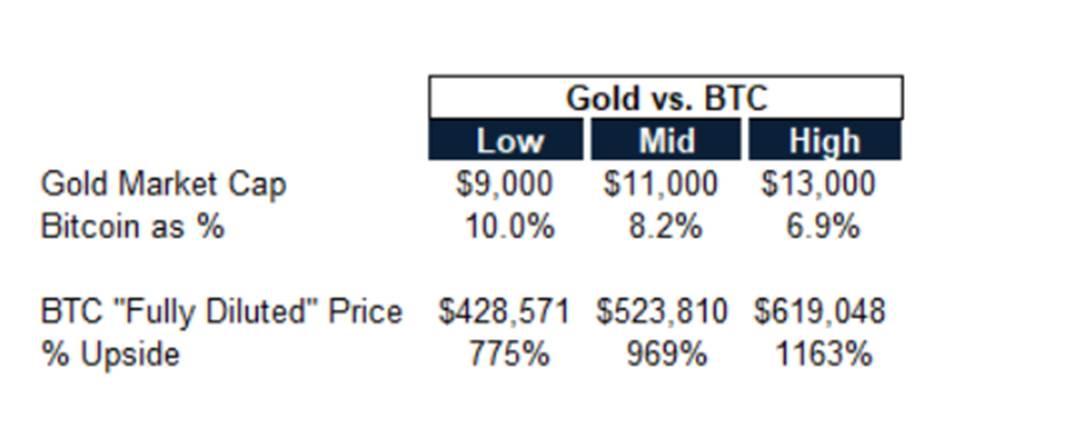
Bitcoin currently has a market cap of $900 billion, making it the fifth most valuable currency in the world, behind the U.S. dollar, euro, renminbi, and yen. From this perspective, you might consider it an extension, as the number of commercial transactions conducted via BTC is limited. However, the bull market theme for some time has been "digital gold," which is precisely what corporations/pensions/insurance companies/macroeconomic funds are buying, so fiat currency may not be the correct reference point.
While we cannot accurately estimate the current market cap of gold, a safe range is between $9 trillion and $13 trillion, which translates to $428,000 to $620,000 per Bitcoin, representing an upside of 775%-1163% from current levels. Few macro investors can allocate billions of dollars with an upside of 8.5-12.5 times and a downside of 60%-70%.
When Stanley Druckenmiller first bought Bitcoin, it was because Paul Tudor Jones told him:
"Did you know that when Bitcoin dropped from $17,000 to $3,000, 86% of people held Bitcoin at $17,000 but never sold it?" In my view, that's a big deal. So it's a limited supply thing, and 86% of holders are 'religious' zealots."
There is more "downside support," and those most vocal will have you believe that Bitcoin "has no support" (despite having the world's largest dedicated computing power resources).
What makes something a good store of value? PTJ ranks assets based on four characteristics:
- Purchasing Power ------ How does this asset maintain its value over time?
- Integrity ------ How has it been regarded over time and universally accepted as a store of value?
- Liquidity ------ How quickly can the asset be converted into a trading currency?
- Portability ------ If you had to do so for unforeseen reasons, can you geographically move this asset?
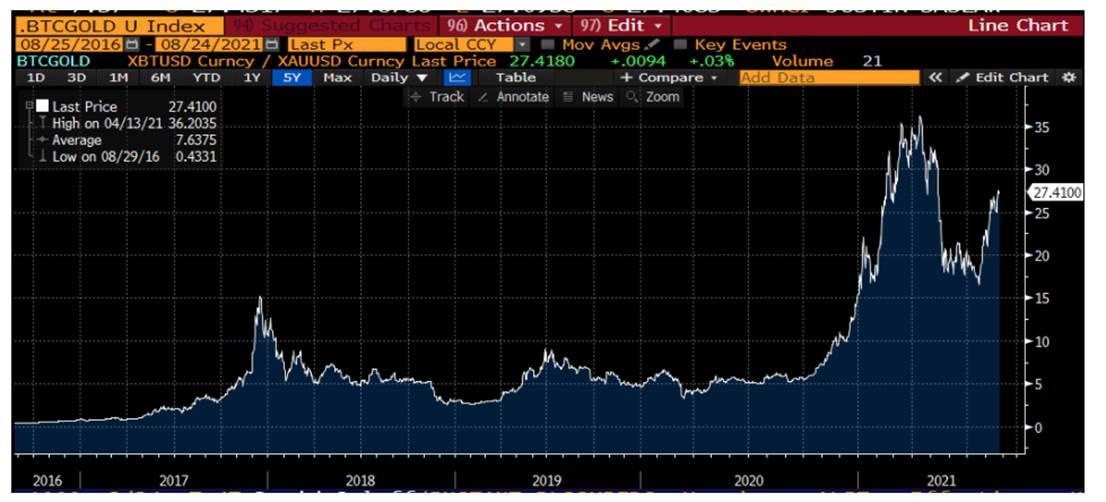
Today, Bitcoin scores higher than gold in liquidity/portability, and while gold has had a leading advantage for thousands of years, Bitcoin has outperformed in "purchasing power" since its inception. Below is a chart of the BTC/gold ratio.
Those bearish on Bitcoin often reference MySpace/Facebook or Blackberry to emphasize that "first" technologies do not always win. This indicates a fundamental misunderstanding of Bitcoin's purpose as a store of value. Bitcoin's origin story with an anonymous founder cannot be replicated; he will be one of the richest people in the world and has not sold any BTC in 12 years. It is a fair launch without VCs, where anyone in the world can participate, completely open-source with volunteers dedicated to completing the "project," with FTEs at 0 and a marketing budget of 0. Subsequent attempts have been funded by venture funds, early crypto whales, and well-known teams. What wins is not the technology, but the security and decentralization of the network, where Bitcoin seems to have an insurmountable lead.
As we see the intergenerational wealth shift from the Baby Boomers to Millennials, Gen Z (late 90s to early 10s), and Generation Alpha (10-25 years), who have grown up in a native digital environment and spend all their time in the virtual world, which form of value preservation do they prefer? As Travis Kiling said, it is "a non-sovereign, hard supply, global, immutable, decentralized, digital store of value," which can serve as insurance against irresponsible monetary and fiscal policies of central banks and global governments, or is it just a "yellow rock"?
The BTC/gold ratio has about a 10% chance of flipping, and in fact, you hold a perpetual call option with no expiration or theta decay, making BTC a very attractive macro asset, and it is difficult to consider the emergence of a "bubble" at current levels, even if we see another 50-75% drop (as we have already seen this year).
ETH/Other L1s
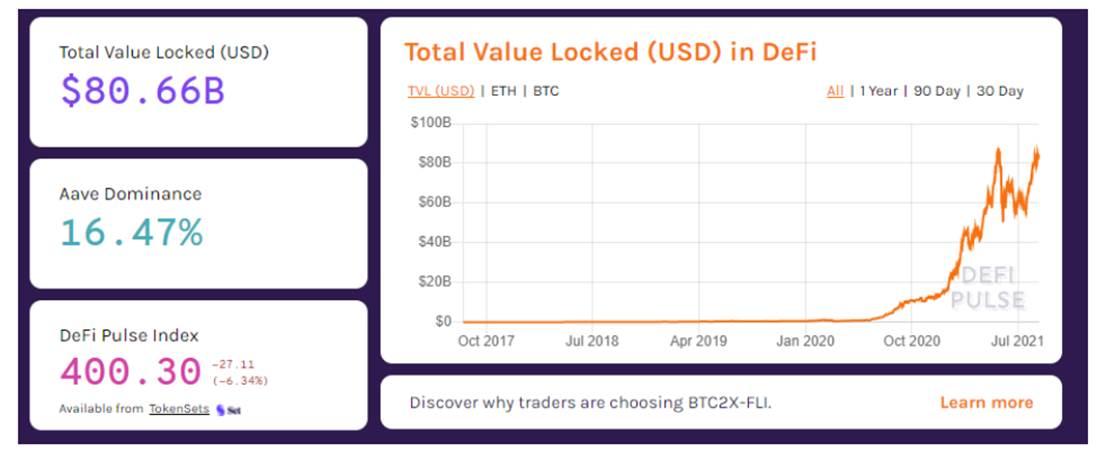
In the past 18 months, there has been much debate about DeFi, as the total locked value (TVL) in DeFi smart contracts has risen from $925 million in March last year to $80.6 billion now. We have written here about the evolution of DeFi and existing financial market infrastructure.
ETH, as the leading L1 protocol, continues to dominate market share in DeFi, Web 3.0, NFTs, and gaming, measured by market cap, developer activity, TVL, and nominal trading dollar value.
Is ETH in a Bubble? Raoul Pal recently referred to ETH as "the greatest trade in financial market history" over the next six to nine months. He mentioned that ETH was set up for "three halvings," with EIP 1559 significantly reducing ETH supply by burning fees, and the launch of ETH 2.0 transitioning to proof of stake ("PoS"). He emphasized that the number of ETH addresses is growing faster than BTC (60% per year vs. 30% per year), and more importantly, the number of transactions is also increasing. By early August, about 26% of ETH was locked in DeFi smart contracts, with only about 13% of ETH remaining on exchanges for trading. In his view, this is a perfect storm of massive supply shock for an asset presenting exponential demand.
We could argue that ETH faces more intense competition from other L1 competitors, which is indeed a technological battle. To win in DeFi, Web 3.0, NFTs, and gaming, you need to have a high-performance blockchain and make appropriate trade-offs between scalability, security, and decentralization in the blockchain trilemma. Currently, ETH is working on scalability, as the network can handle about 30 TPS, with block times of 14 seconds, and transaction fees ranging from a few dollars to thousands of dollars, depending on network congestion. It is not enough to bring billions of people into Web 3.0. Users will expect an experience comparable to today's internet usage—instantaneous/free, with intuitive UI/UX, which we are certainly not there yet.
We do not believe there will be "one chain to rule them all," but liquidity and network effects often cluster around a few winners that specialize in technology (e.g., AWS/Azure/Google) and trading (e.g., ICE/NDAQ/CME/CBOE), so it is necessary to invest in that aspect. Similar to Bitcoin's origins, ETH's advantage lies in the intergenerational wealth it has created for thousands or even tens of thousands of developers who participated in ICOs or early purchases of ETH, providing them with a very loyal developer ecosystem and incentivizing them to see it work. While pure decentralization purists may shrink at this, investing in protocols is akin to investing in teams. Vitalik Buterin is the most well-known cryptocurrency developer aside from Satoshi Nakamoto, and there is good reason for that.
The winners of L1 protocols could earn over $1 trillion in rewards, so is the $375 billion ETH in a bubble? If ETH 2.0 fails, and sharding proves suboptimal, and decentralization actually hinders the product roadmap/process, then undoubtedly, the $375 billion Ethereum will become the 24th largest company in the world. But what if they can execute ETH 2.0? There remains asymmetric upside potential without having to make a binary bet due to liquidity. The ETH currently issued is either a trade of supply-demand dynamics in the short term or a clear bet that they will execute according to the established roadmap (which has been in development since 2016).
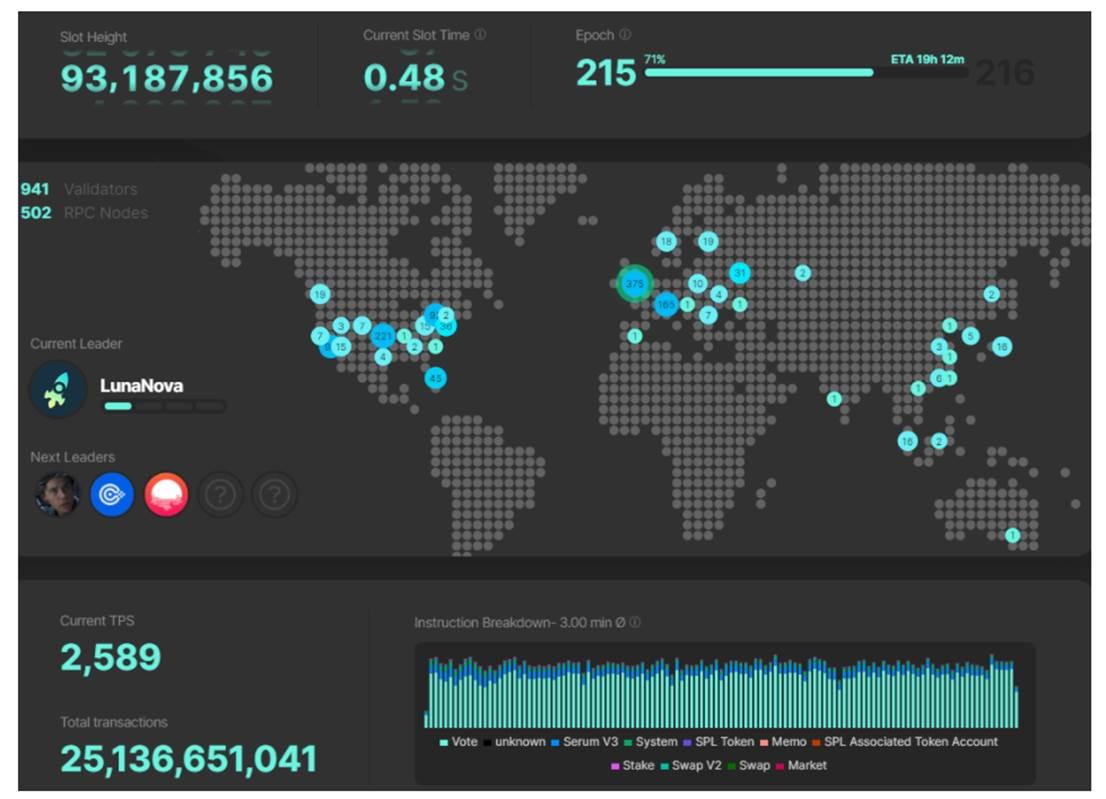
Who else has a chance to earn L1 rewards? Let's look at Solana. There has been much discussion on Twitter about the "Solana Summer," with Solana's price rising from $24 to $70 from Memorial Day to now (August 24), while its price was less than $2 at the beginning of the year. Packy McCormick just published a great overview of Solana, which speaks for itself, but as we see, Solana is currently the most significant direct competitor to ETH. Solana's block time is 0.4 seconds, and transaction fees are just a fraction of a penny, with a current maximum capacity of about 65,000 TPS. You can monitor the network's status here.
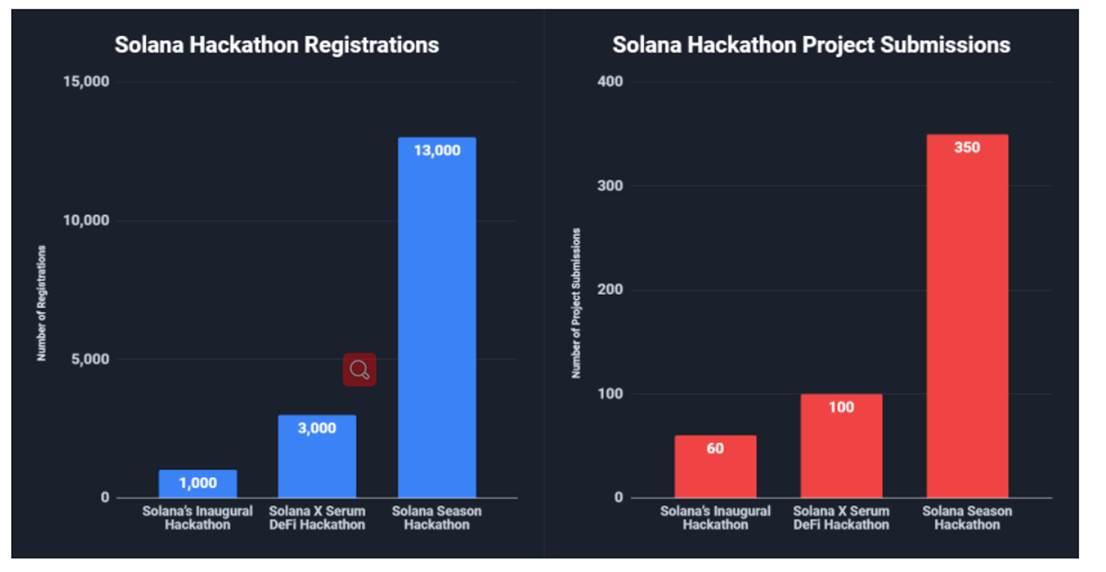
Ironically, while protocols like Dfinity, Polkadot, Tezos, Cosmos, EOS, Algorand, and Dfinity raised billions of dollars, Solana's failure to secure significant venture capital in 2017-2018 turned out to be the best thing for them. Similar to ETH, they had to release products and organically build a developer community. They launched their first hackathon in November 2020, with 1,000 registrants, the second in February with 3,000 registrants, and by May, the third had 13,000 registrants.
You will see real teams building on SOL and real trading activity. The FTX team built Serum on SOL, and SBF referred to it as "the highest-performing blockchain." Since the mainnet launch in March 2020, we have seen about $25 billion in transactions on SOL (this includes consensus messages, so the actual number may be half of that), while ETH has about $1.25 trillion and BTC about $665 billion. When users are provided with near-instant and free transactions, they will engage in more transactions.
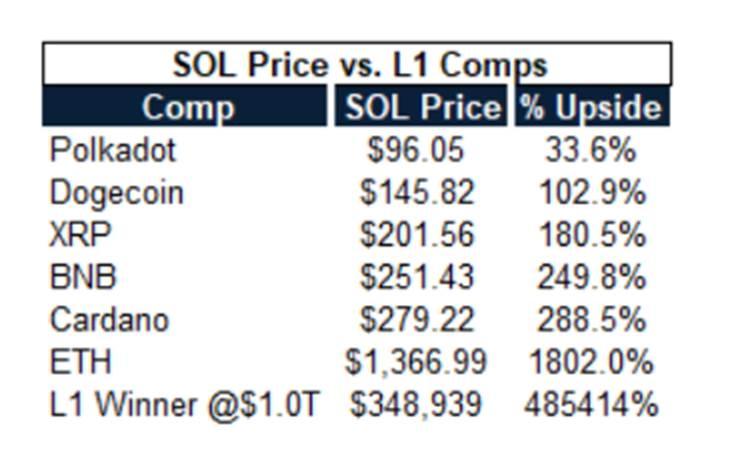
Does SOL have a bubble? Considering the rewards for winning the L1 race, the adoption by traditional trading firms and crypto-native companies, and the growing organic developer ecosystem, combined with the discounts it offers compared to other L1s, if it can become one of the L1 winners, you could argue that its relative value is still undervalued.
What about other major cryptocurrencies?
When you look at assets like Cardano, valued at $90.5 billion (without smart contract functionality for over 4 years), XRP at $54.6 billion, and DOGE at $39.1 billion, it is hard to see how token holders will generate above-market returns from holding these assets over the next 3-5 years. This is cryptocurrency, anything can happen, but those undoubtedly represent bubbles among "major cryptocurrencies."
Looking further down, hundreds of "zombie chains" are valued at hundreds of millions, with countless "zombie chains" valued solely based on "circulating" supply, serving no purpose other than speculation. For some, that is all you need, but over time, attention will shift, and most of the focus will certainly be on signs of a crypto market bubble and excess, and we expect significant "wealth" destruction to occur there over the next 3-5 years.
NFTs
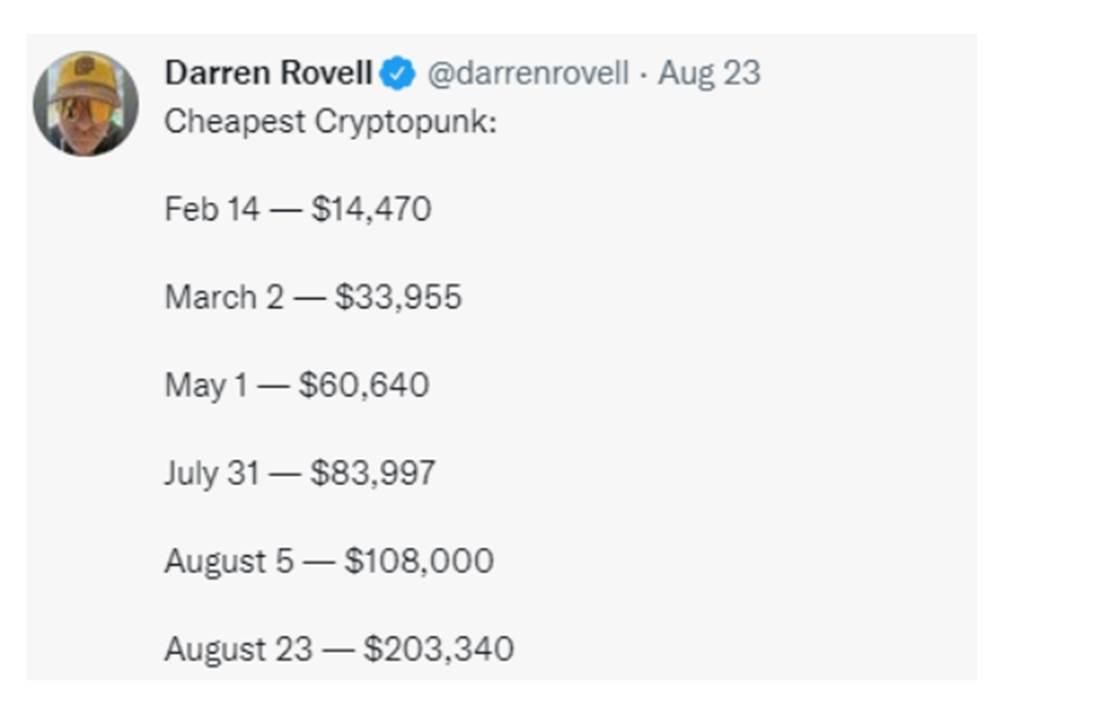
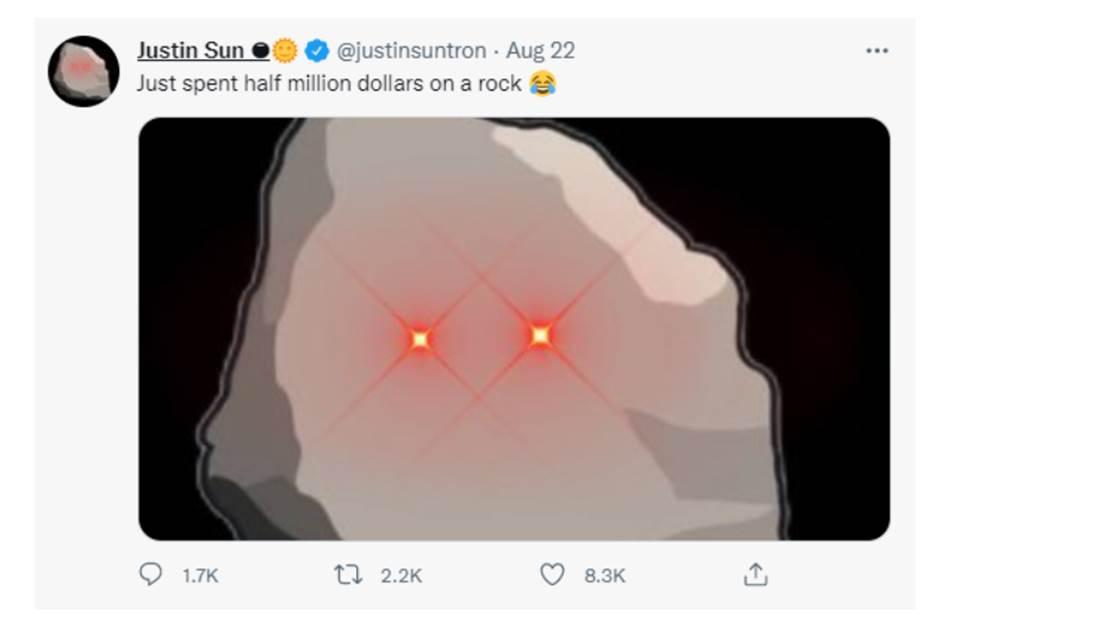
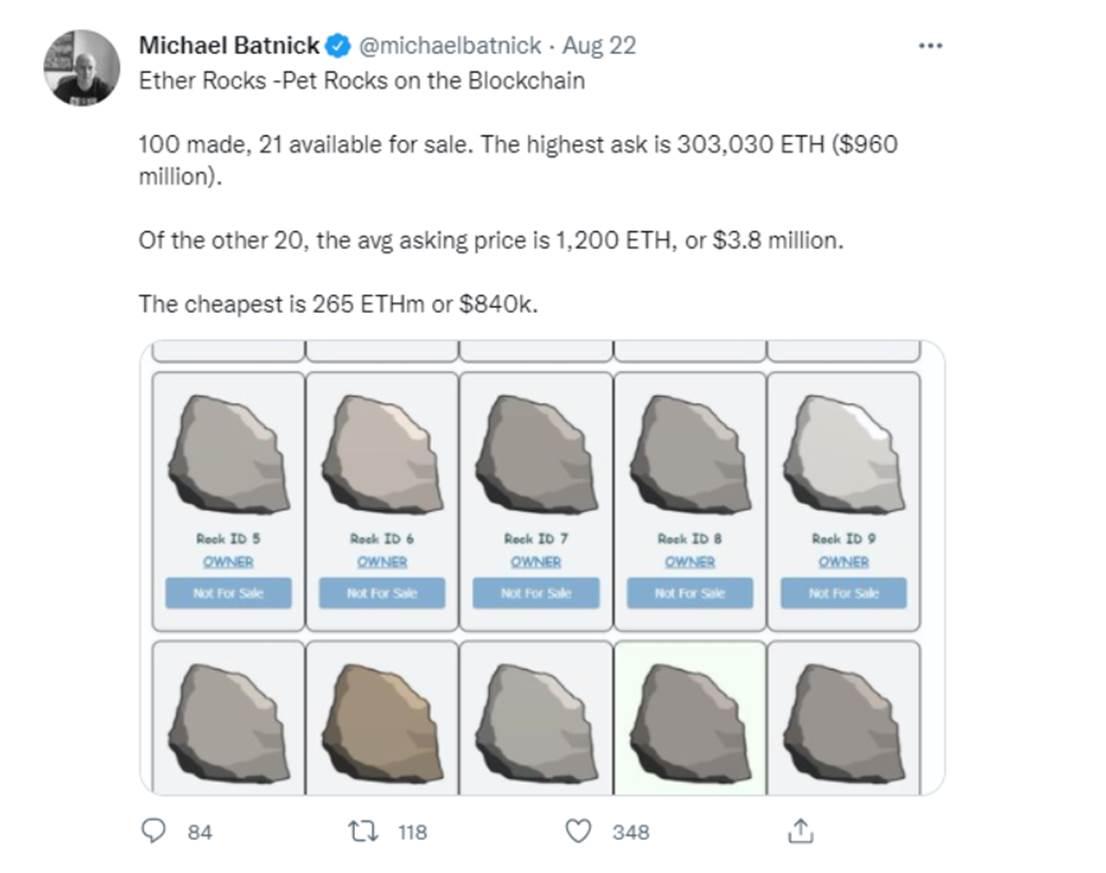
In a March SNL skit, NFTs clearly became mainstream. While some early excess products have disappeared from the market, since then we have seen Beeple sell for $69 million at Christie's, the "cheapest" Cryptopunk's price has risen over 15 times since the beginning of the year, Visa made a "reassessment" of the market overnight with a purchase price of $150,000, a punk sold for a record $7.8 million, and other listed "bids" ranged from $5.5 million to $7.7 million, Degen Apes sold out in 8 minutes despite server crashes, and Sun Yuchen spent $500,000 on a pet rock.
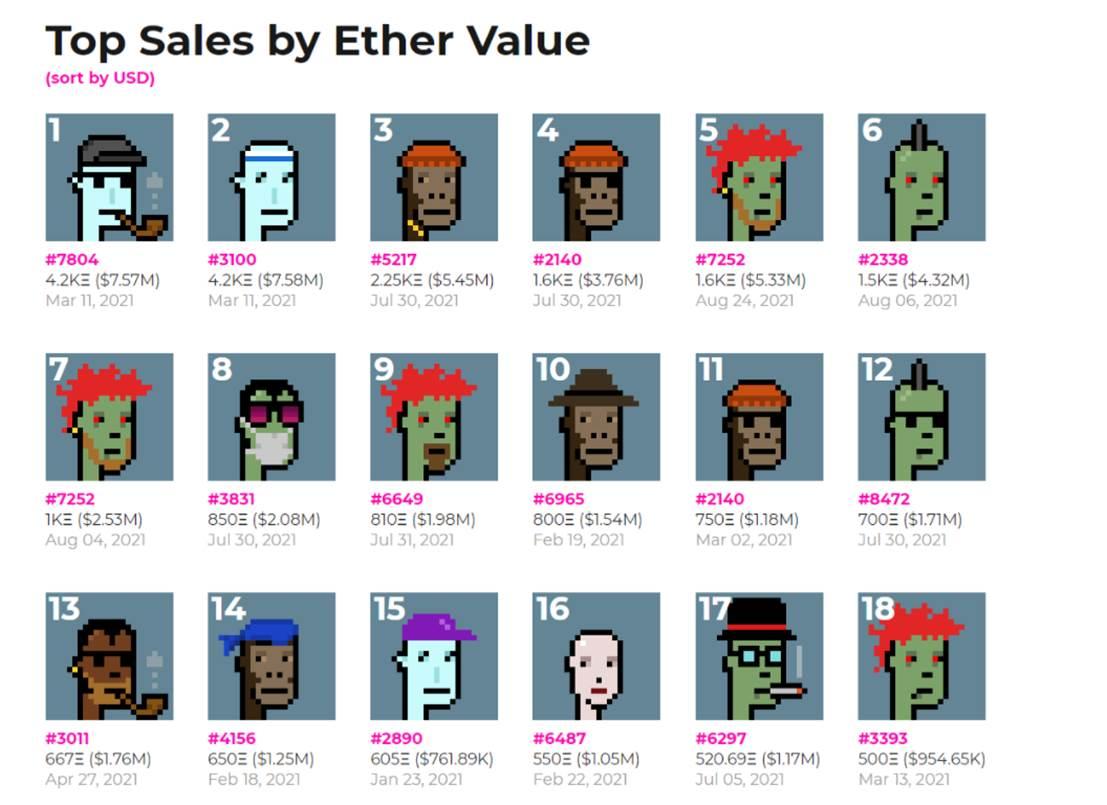
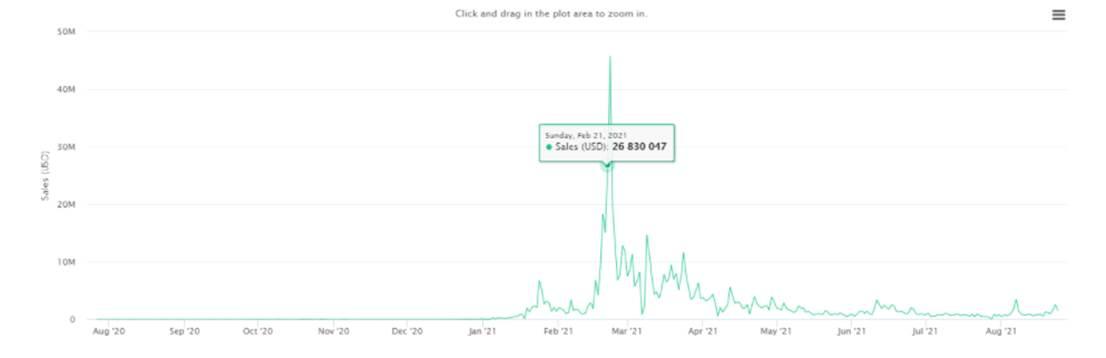
Anything that seems to be in a vacuum appears to be a "topping" indicator, like the video clip of LeBron dunking in a meaningless regular season game, selling for $208,000 (which was his first four cards), seems to indicate the NBA Top Shot in February (up until today), or when Cryptokitties reached six-figure sales on December 17, marking a peak.
Similar to collectibles/art in the real world, some things are worth what others are willing to pay for them, and the world of NFTs will be no different. Owning a Cryptopunk means you can afford a Cryptopunk. There is debate about whether this is a new form of wealth flaunting in the virtual world, like owning a Ferrari or a Patek Philippe.
Are we in an NFT bubble? There is undoubtedly excess, as the world of high-end art, sports memorabilia, cars, and watches has created universally accepted "valuation" rankings based on cultural significance, scarcity, longevity, etc., the world of NFTs will coalesce around similar value hierarchies, but there is currently none. Can someone sell a "pet rock" for $500,000 in 3 years? Probably not. Can that buyer sell a random dunk video of LeBron from a meaningless regular season game for $200,000? Unlikely. Can Visa sell its "floor punk" for $150,000 in 3-5 years? That is more questionable. People are having fun now, as Fred Wilson said, NFTs are at the intersection of "games, online communities, and social networks."
We are in the early stages of the first true "consumer opportunity" wave in cryptocurrency. When you see Jay-Z using a Cryptopunk as his Twitter avatar, or Paris Hilton receiving a Degenape, or the explosive growth of Axie Infinity's game revenue (to the point that it caught the attention of Philippine regulators, emphasizing that players need to pay income tax on their gaming earnings), it is hard to ignore the momentum of potential consumer experiences built on the crypto stack, and now NFTs are showcasing this trend.
Much of this may not suit us, but art, cars, watches, or wine may not suit us either. Just be cautious of the market's relentless machine of creating supply to meet demand, as creating digital supply is much easier than in the physical world.
Conclusion
If global central banks and governments continue to print money, investors will face the dilemma of TINA 2.0, where cash is truly "burning a hole" in their pockets, pushing them not only towards risk assets but further away from the risk curve, exacerbating wealth inequality along the way, leading to further risk-taking.
So are we in an "everything bubble"? There are certainly excesses in almost every corner of the financial markets, but there are also ample opportunities.
 Risk warning
 Risk warning


Popular articles