Goodbye bear market? Bitcoin shows strong performance returning

 Driven by long-term spot demand and a series of short squeezes, the Bitcoin market has seen its strongest monthly price performance since October 2021.
Original Title: 《A Volatility Slumber》
Author: Checkmate, Glassnode
Compilation: Daling Think Tank
Under the long-term spot demand and a series of short squeezes, the Bitcoin market has shown its strongest monthly price performance since October 2021. In this article, we will explore the dynamics of the derivatives market and spot trading platforms.
This week, digital assets continued to rise, with Bitcoin reaching a high of $23,900 on the evening of January 29. January 2023 recorded the best monthly price performance since October 2021, with a year-to-date increase of over 43%, the highest level since August 2022, rising 6.6% from the weekly low of $22,400.
In this article, we will study and analyze the recent rebound in the derivatives market and trading platforms, covering:
Although the total leverage ratio has decreased relative to market size, recent futures short squeezes have returned the basis to positive values.
Despite a decrease in on-chain trading activity related to trading platforms, the balances on trading platforms have generally declined.
The average acquisition prices of several market groups have been breached, including Bitcoin investors who purchased in 2019, customers of Binance and Coinbase, and Bitcoin whales who bought in 2017.
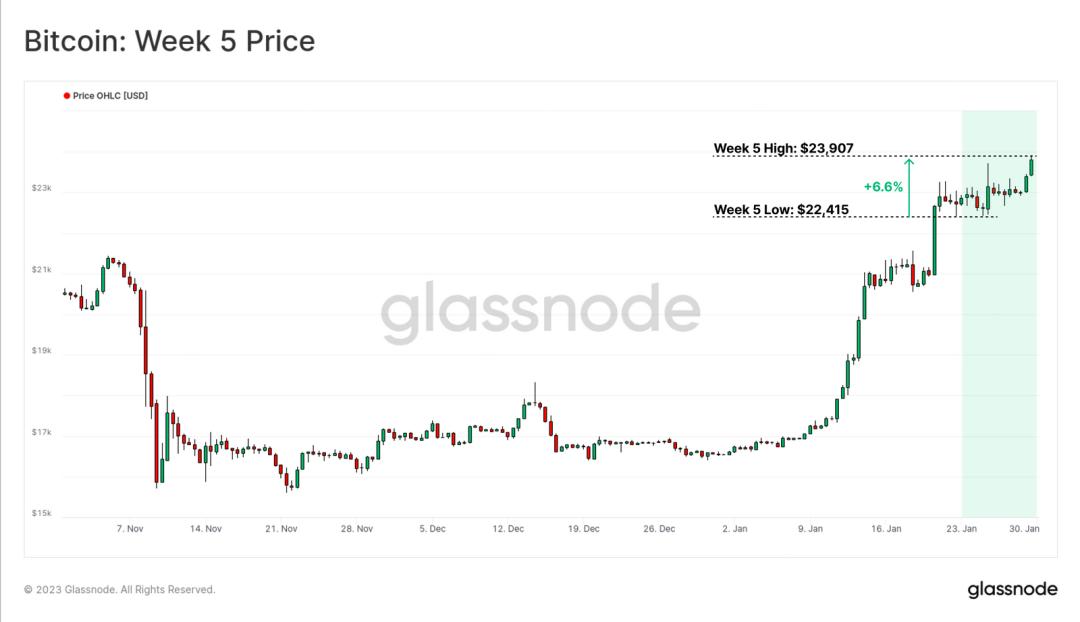 Figure 1: Bitcoin price from January 24 to 30
Short Futures Market Under Pressure
After a long, painful, and arduous 2022, January 2023 began to reverse this downward trend. Typically, such rebounds are driven by some degree of short squeezing within the derivatives market, and this rebound is no exception.
So far, three waves of trading have liquidated over $495 million in short futures contracts, and the scale has decreased as the rebound ended.
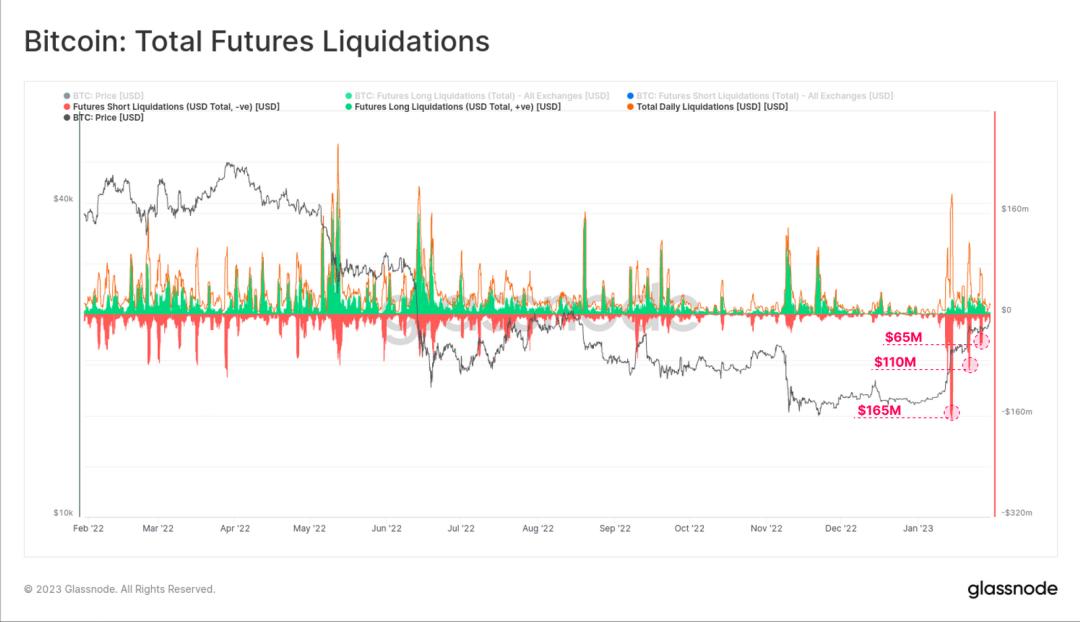 Figure 2: Total Bitcoin futures liquidations
We can see that the initial short squeeze in mid-January caught many traders off guard, with long liquidations accounting for a historic low of 15%. This means that 85% of the liquidations were shorts, which is higher than the 75% long liquidations during the FTX collapse, indicating a high level of investor overextension.
Figure 2: Total Bitcoin futures liquidations
We can see that the initial short squeeze in mid-January caught many traders off guard, with long liquidations accounting for a historic low of 15%. This means that 85% of the liquidations were shorts, which is higher than the 75% long liquidations during the FTX collapse, indicating a high level of investor overextension.
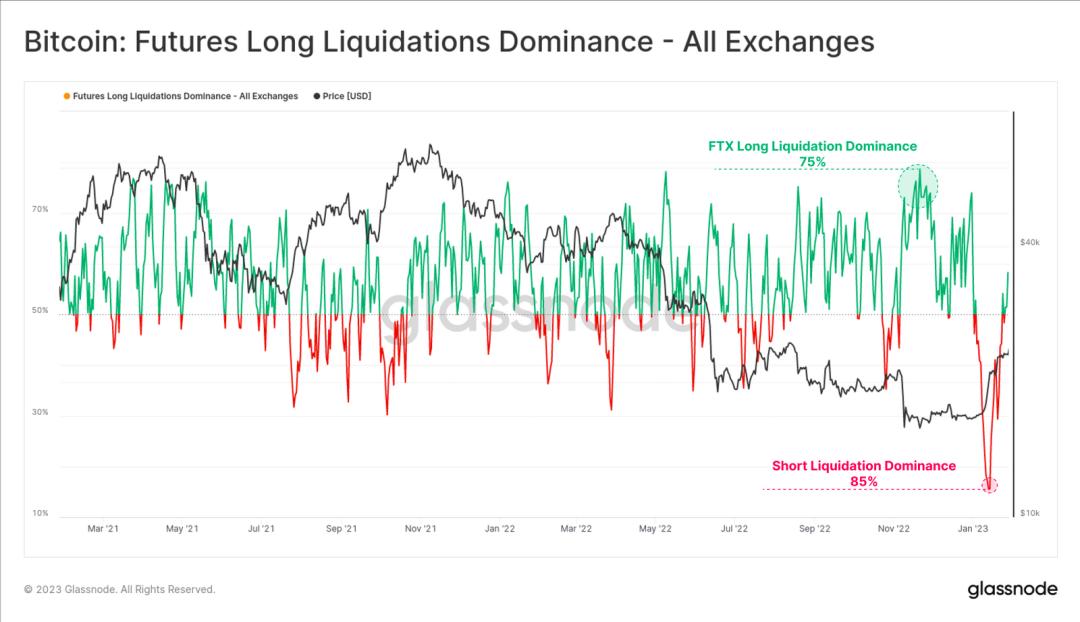 Figure 3: Long liquidations as a percentage of all trading platforms
In perpetual swaps and calendar futures, cash and arbitrage basis have now returned to positive territory, with annualized yields of 7.3% and 3.3%, respectively. For most of November and December, all futures markets exhibited spot premiums, indicating a return of positive market sentiment, possibly accompanied by some speculative sentiment.
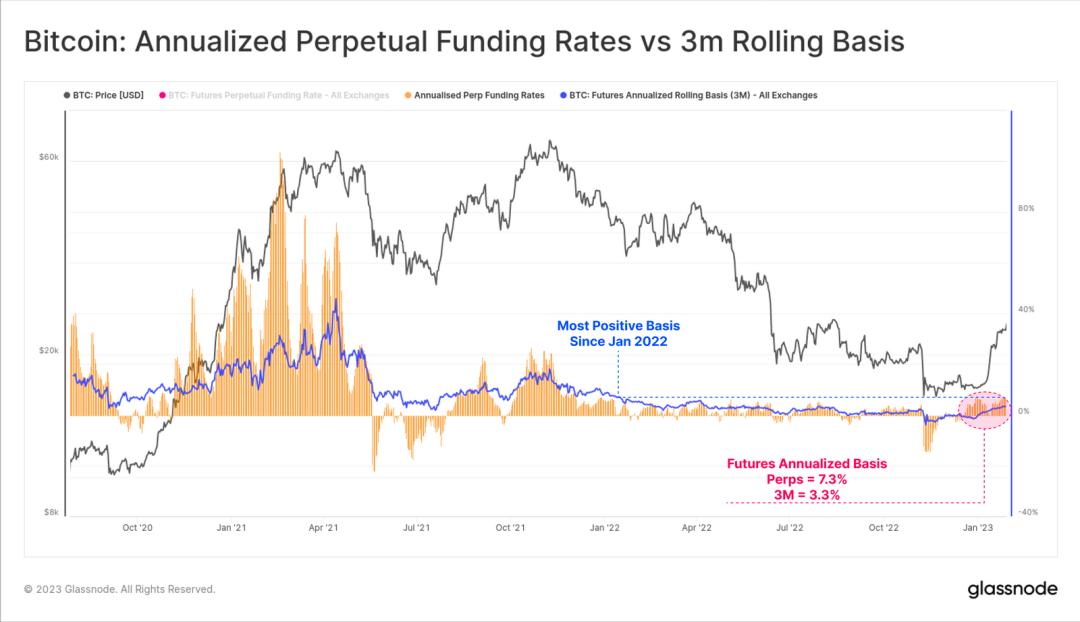 Figure 4: Annualized returns of perpetual futures versus 3-month yields
However, despite the futures basis returning to positive values, the number of open contracts has been declining relative to Bitcoin's market capitalization since mid-November. During this period, the value of open futures contracts denominated in Bitcoin decreased by 36%, from 650,000 Bitcoins in mid-November to 414,000 Bitcoins today.
Note that the 40% decline can be directly viewed as the loss of open contracts worth 95,000 BTC held by the FTX trading platform.
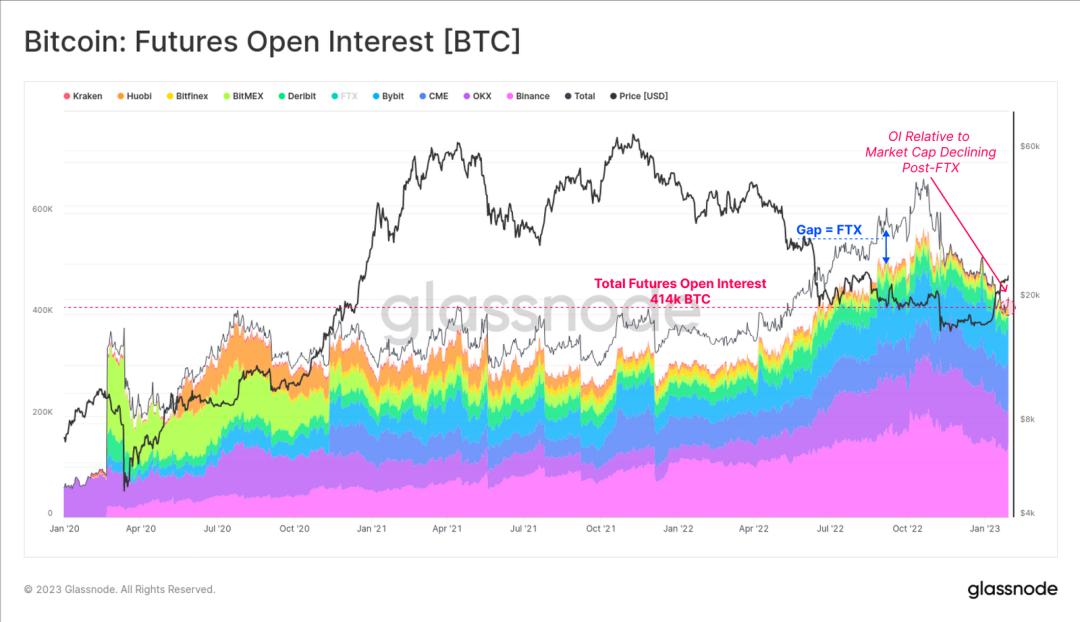 Figure 5: Futures open contracts
If we compare the nominal size of open futures contracts with the corresponding BTC balances on trading platforms, we can gauge the relative scale of leverage within the market. Over the past 75 days, this leverage ratio has decreased from 40% of open contracts relative to trading platform spot balances to just 25%.
Overall, this reflects a significant reduction in futures leverage and a cooling of short speculative sentiment. This may also indicate a reduction in short-term downside hedging positions. Relatively, as an increase in on-chain self-custody behavior is observed, this further emphasizes that the spot market is a key driver of the current market structure.
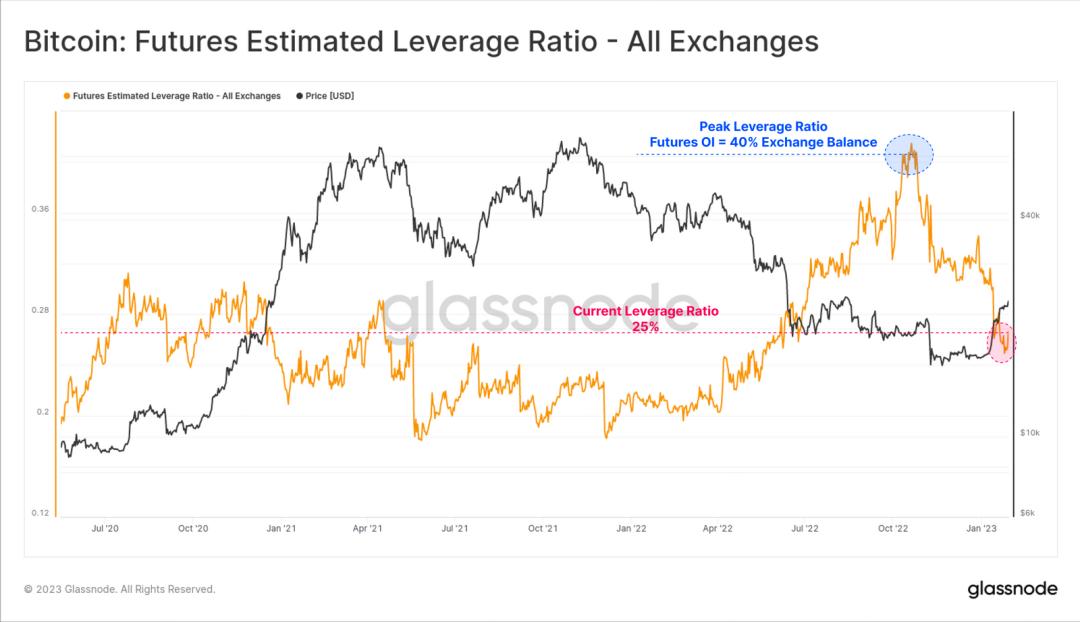 Figure 6: Futures leverage ratio valuation - all trading platforms
Trading Platform Flow Stabilizes
Since March 2020, the trend of spot outflows from trading platforms has been a closely monitored theme, with asset balances on trading platforms remaining high. Currently, the total amount of Bitcoin held by the trading platforms we track is approximately 2.251 million Bitcoins, accounting for 11.7% of the circulating supply, marking a multi-year low since February 2018.
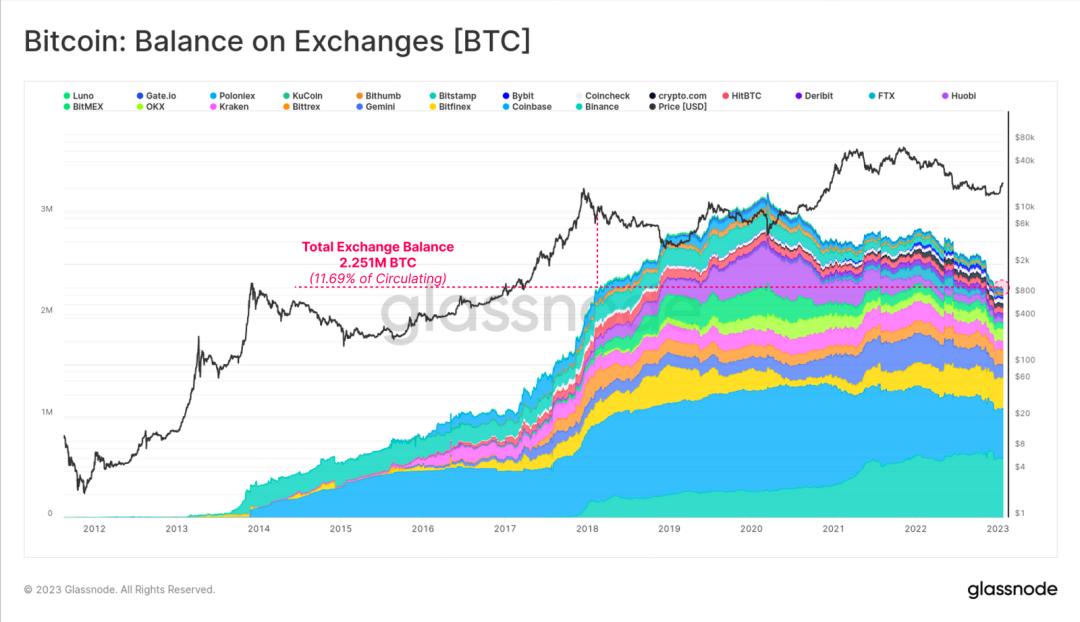 Figure 7: Trading platform balances
Currently, the average inflow and outflow amounts for trading platforms are approximately $625 million per day (totaling $1.25 billion per day). In terms of net value, the daily net outflow is about $20 million, accounting for only 1.5% of the total flow, indicating that trading platform flows are in a balanced state. This is in contrast to November-December, when the net outflow from trading platforms was about $200 million to $300 million per day.
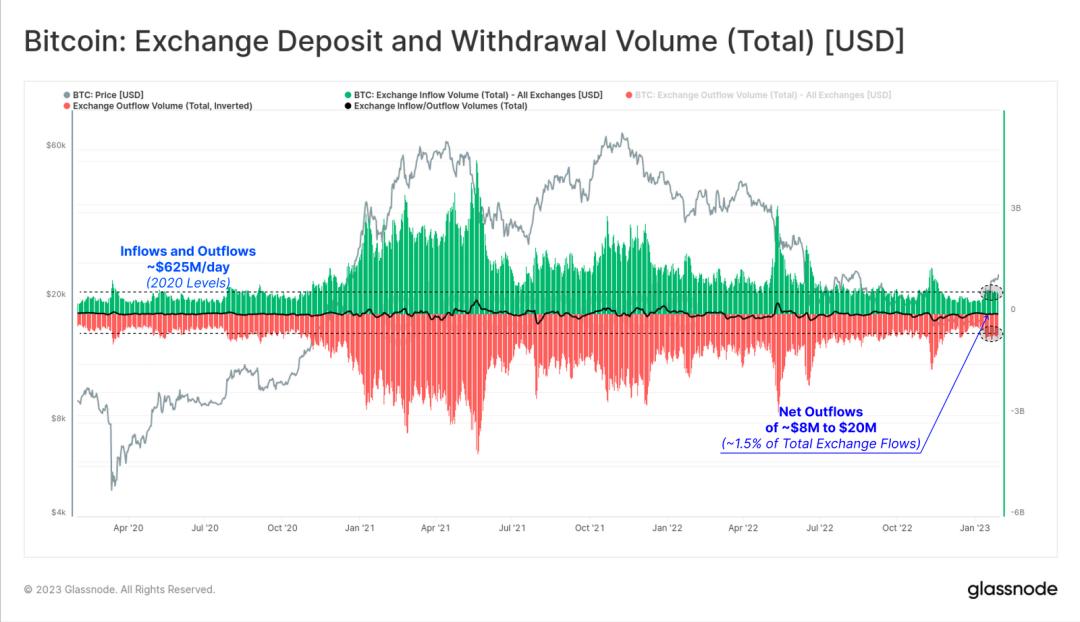 Figure 8: Trading platform inflow and outflow
The highest monthly outflow of Bitcoin occurred during November to December, with outflows from all trading platforms reaching 200,000 Bitcoins per month. Currently, the net flow from trading platforms has stabilized, and capital outflows are cooling. This may indicate that market demand has slowed, as prices have rebounded over 43% year-to-date.
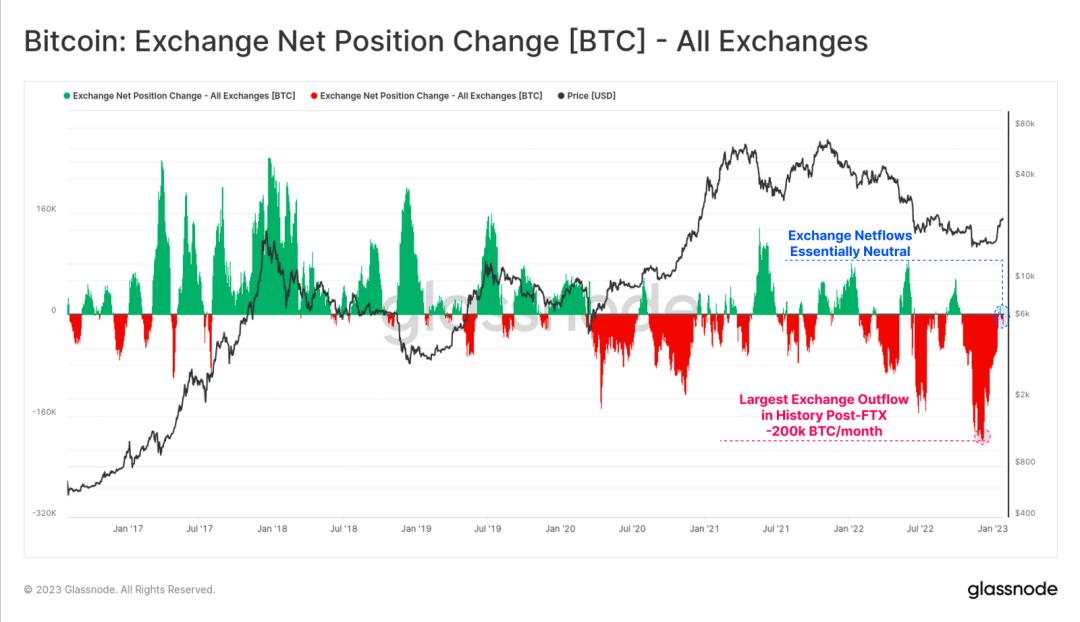 Figure 9: Changes in net positions of Bitcoin across all trading platforms
Positive Indicators for Bitcoin
This week, on-chain Bitcoin transactions surged by over 50,000 per day, but the number of deposits or withdrawals on trading platforms did not increase correspondingly. Currently, transactions related to trading platforms account for only 35% of the total number of transactions, a declining share since the market peak in May 2021.
This surge in transaction volume can also be seen in the adjusted data for entities, indicating that it is unrelated to individual entities or internal wallet management. It is evident that the recent increase in trading activity is occurring elsewhere in the Bitcoin economy.
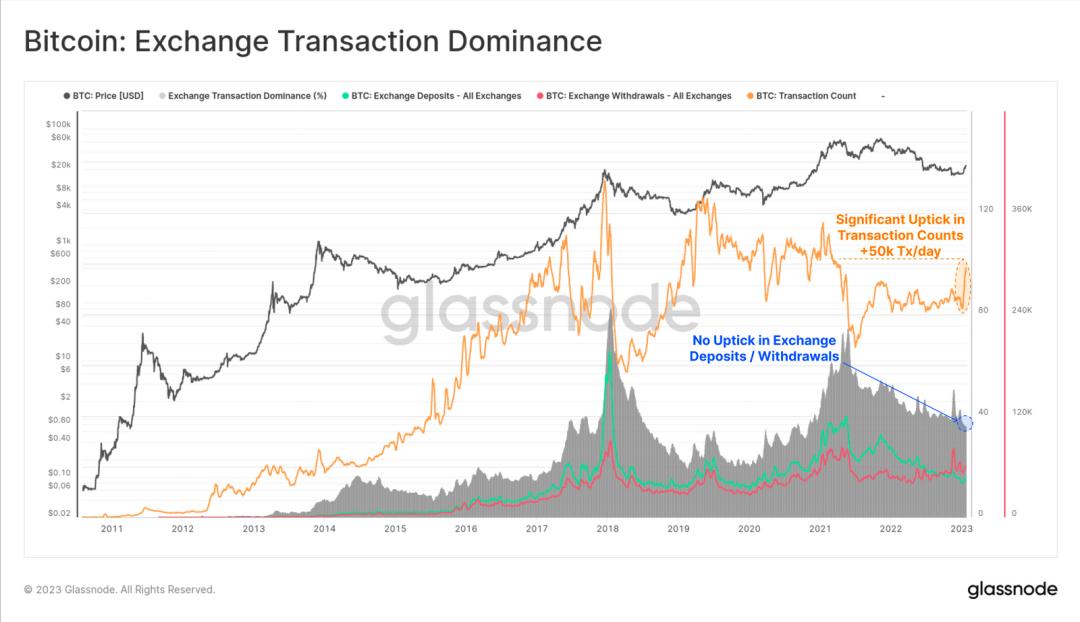 Figure 10: Proportion of trading platform transactions
In recent weeks, the transaction volumes flowing into and out of trading platforms have remained relatively stable, yet the proportion of on-chain trading volumes related to trading platforms has increased from 2.5% to over 16%.
The global trading volume of Bitcoin has sharply declined since November. This may be due to the deleveraging across the entire industry and the mismanagement of assets by FTX/Alameda during the period from August 2021 to November 2022.
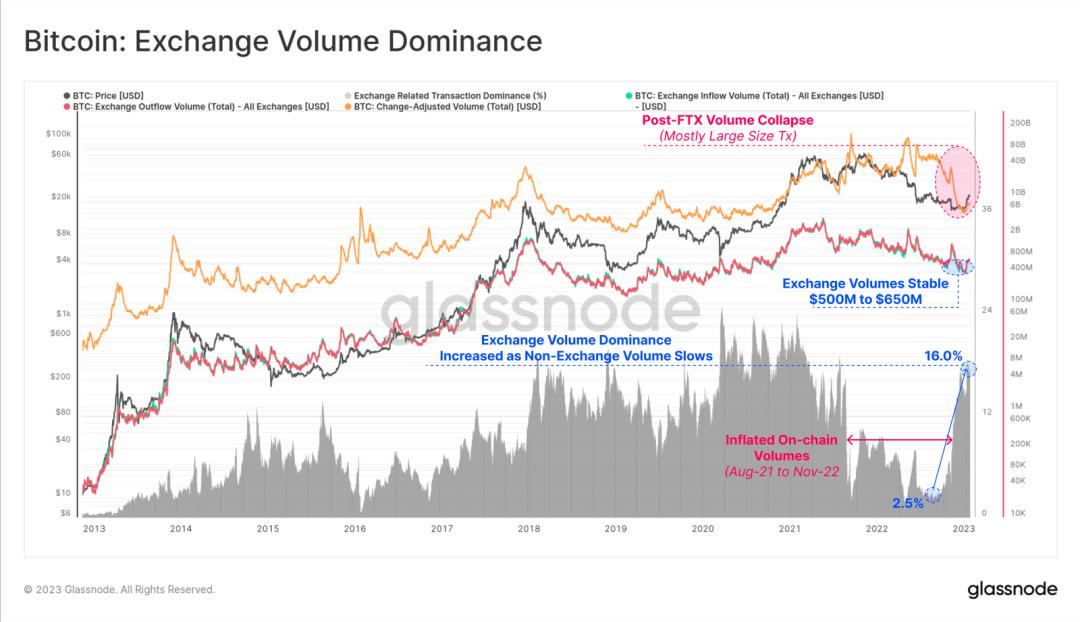 Figure 11: Proportion of trading platform transaction volumes
Typically, as investors and traders become more active, it should manifest as a strengthening market accompanied by an increase in total on-chain transaction volumes. We can see that the current trading platform transaction volumes remain weak, although the monthly average transaction volumes have begun to rise, they are still far below the annual baseline.
PS: A trading platform inflow or outflow volume [USD] (30D-SMA) exceeding $875 million would indicate a recent return of trading volumes related to trading platforms to the annual baseline.
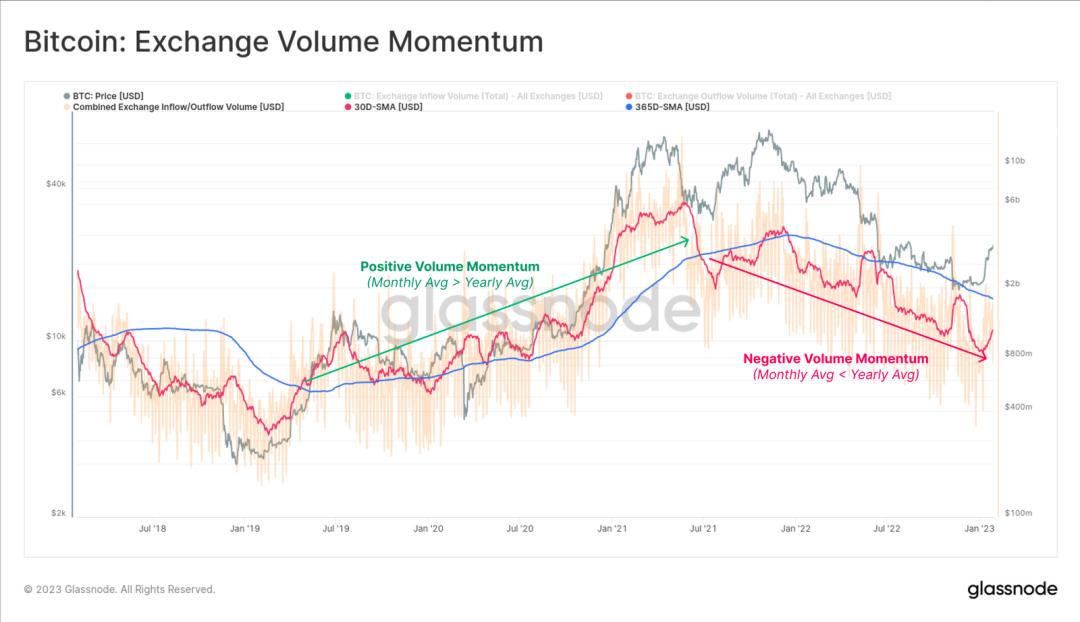 Figure 12: Trend of transaction volume changes
By studying the whales holding over 1,000 BTC, we can also see that their deposit and withdrawal volumes on trading platforms have increased. Throughout January, whales contributed $185 million to $215 million in inflows (and outflows) to trading platforms, with a net outflow of about $25 million.
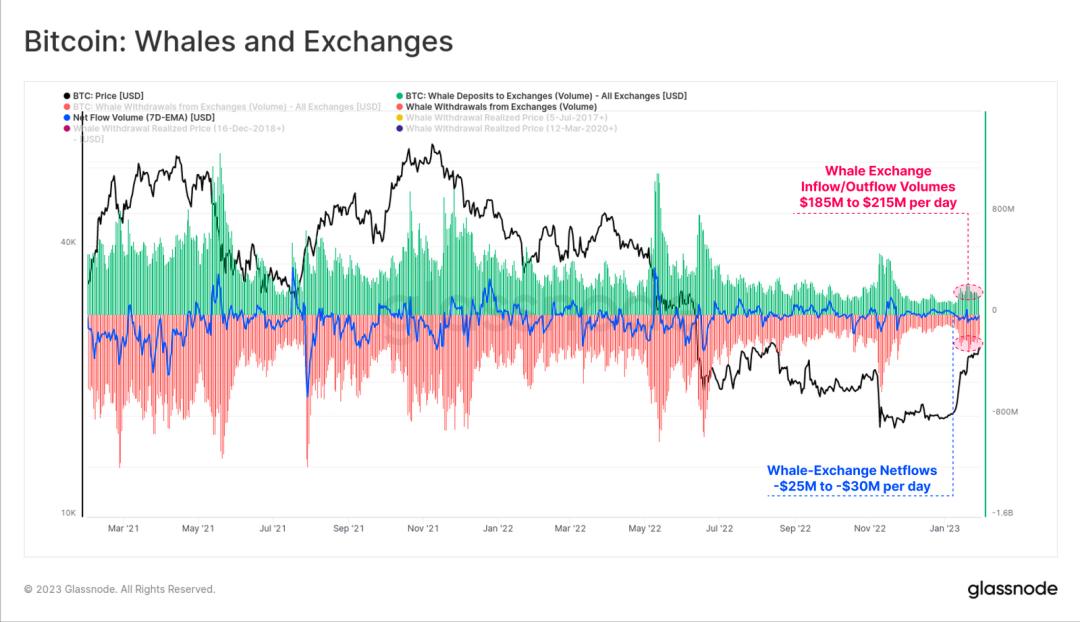 Figure 13: Whale flow on trading platforms
Breaking Through the Cost Basis Price
Due to such a large volume of Bitcoin flowing in and out of trading platforms, we can estimate the average acquisition prices of various groups in the Bitcoin market. The first chart plots the average acquisition price annually, starting from January 1 each year, establishing a cost basis for a long-only DCA (Dollar-Cost Averaging).
During the downtrend of 2022, only buyers from 2017 and earlier avoided unrealized losses, while the cost basis for investors after 2018 was replaced by the red candles of FTX. However, the current rebound has pushed buyers from 2019 ($21,800) and earlier back into unrealized profits.
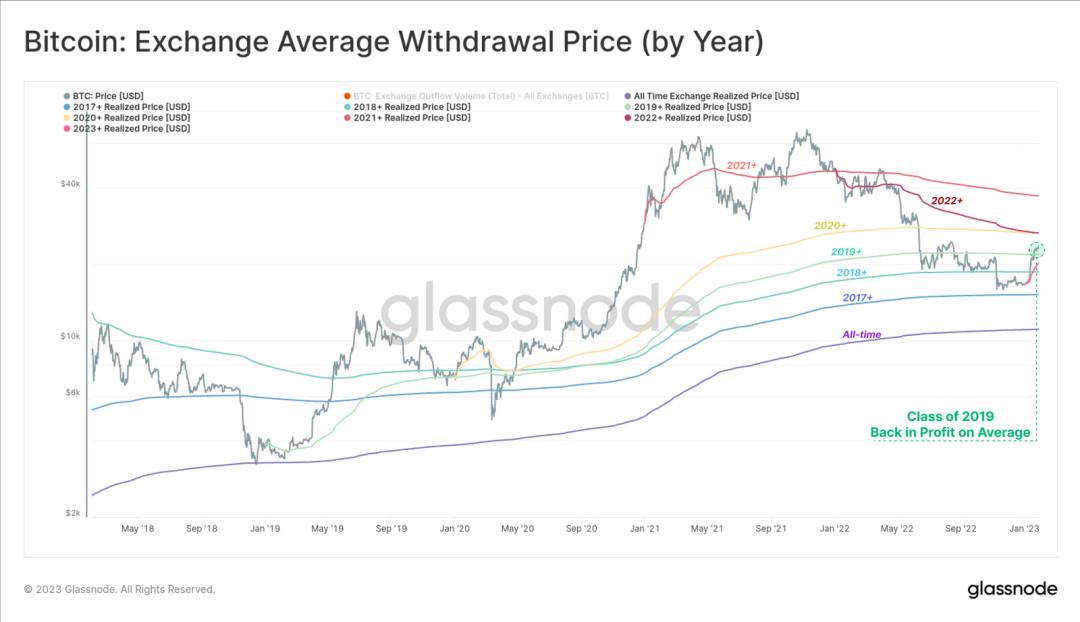 Figure 14: Average acquisition price (by year)
We can create a similar model for each trading platform, and the following chart shows recent price movements intersecting with three key cost basis levels:
(Orange) The historical purchase price across all trading platforms intersects at around $16,700, providing a form of support within the consolidation range at the end of the year.
The average purchase price of the two largest trading platforms, Coinbase and Binance (Yellow) + (Blue), has just broken through around $21,000 since July 2017.
This can also be seen from indicators such as the proportion of profitable supply, which has surged sharply as prices rise above their on-chain acquisition prices.
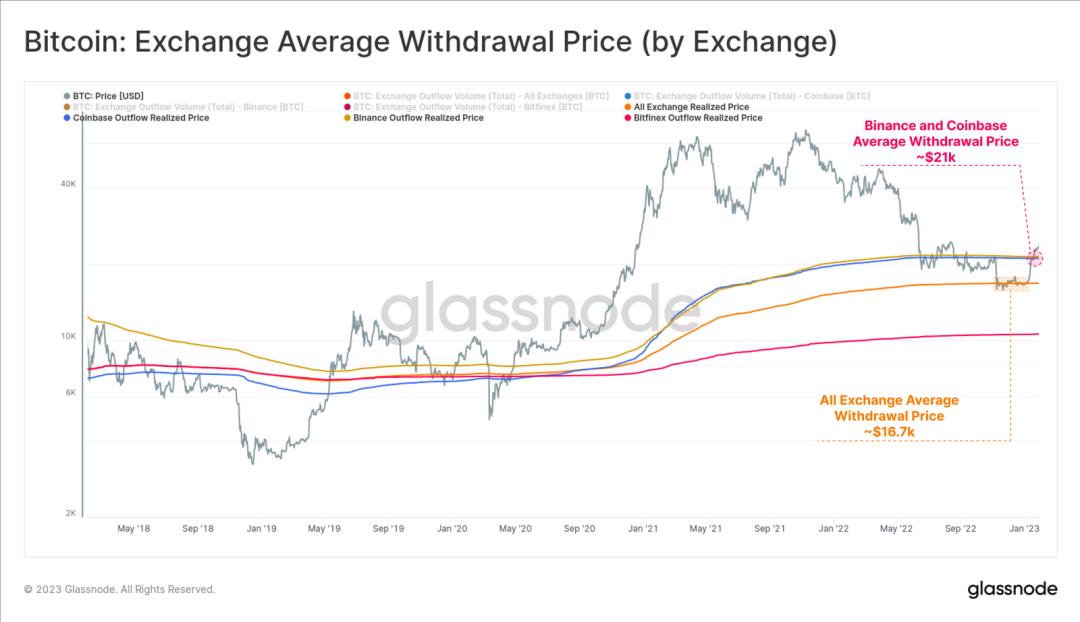 Figure 15: Average acquisition price (trading platforms)
Finally, we return to the whales discussed earlier, but this time we will review the average acquisition prices since the market bottomed out. By starting these trajectories from the market lows, we can estimate the most favorable prices for whales.
What we see is that even whales that have been active since 2017 (Yellow) entered unrealized losses as prices fell below $18,000 in 2022. Since the low in March 2020, the acquisition price for whales has been $23,800.
All three models demonstrate how ruthless the bear market of 2022-23 has been, pushing even groups that started from the most favorable positions into unrealized losses.
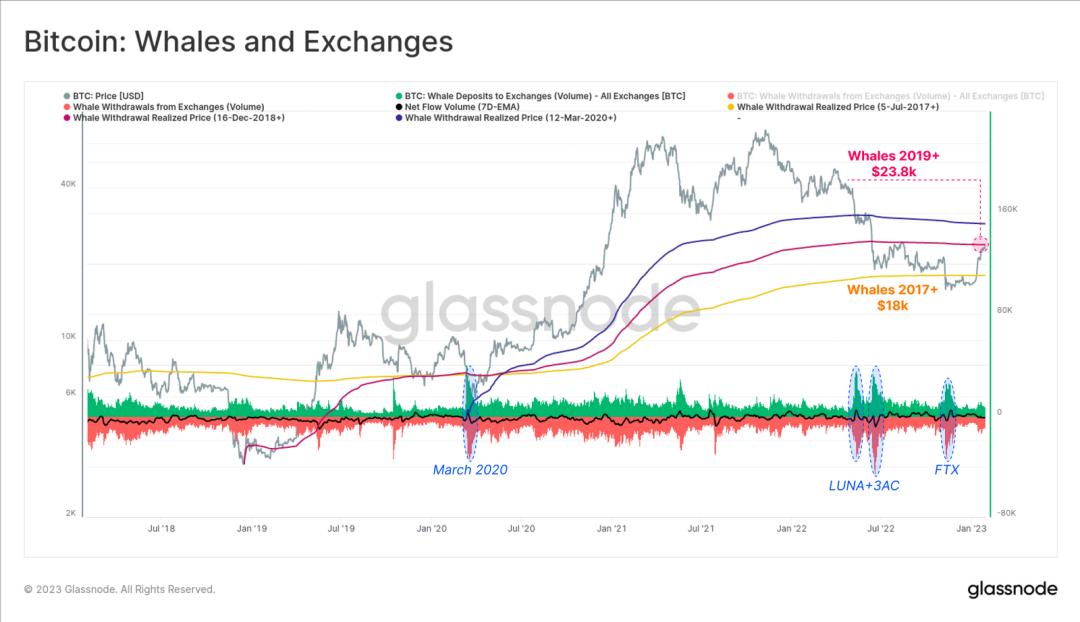 Figure 16: Whales and trading platforms
Conclusion
As January draws to a close, driven by long-term spot demand and a series of short squeezes, the Bitcoin market has experienced its strongest monthly price performance since October 2021. This rebound has restored profitability for most of the market, with the futures market trading at a healthy positive basis. Additionally, the initial outflow trend from trading platforms following the FTX collapse has stabilized.
 Risk warning
 Risk warning


Popular articles