glassnode: The altcoin season is coming, and funds are rotating

 Indicator interpretation.
Author: Ding HAN, Alice Kohn
Compiled by: glassnode
Since last October, our altcoin momentum indicator has shown an increasing willingness among investors to shift capital further along the risk curve.
While Bitcoin's dominance remains significant, we have seen early signs of more capital beginning to flow into the Ethereum, Solana, Polkadot, and Cosmos ecosystems.
By examining Uniswap liquidity pools, we can see that most capital still remains in the most mature assets. Although the total value locked (TVL) is moving outward along the risk curve, the follow-through in trading volume has been relatively slow.
1. Anticipating "Altcoin Season"
With the momentum of new spot Bitcoin exchange-traded funds (ETFs) gaining strength, a bull market in the digital asset space may have already begun. In this context, we will continue to explore whether the capital we covered in the Week 4 on-chain report will flow into altcoins. This issue will focus on the performance of assets further out on the risk curve.
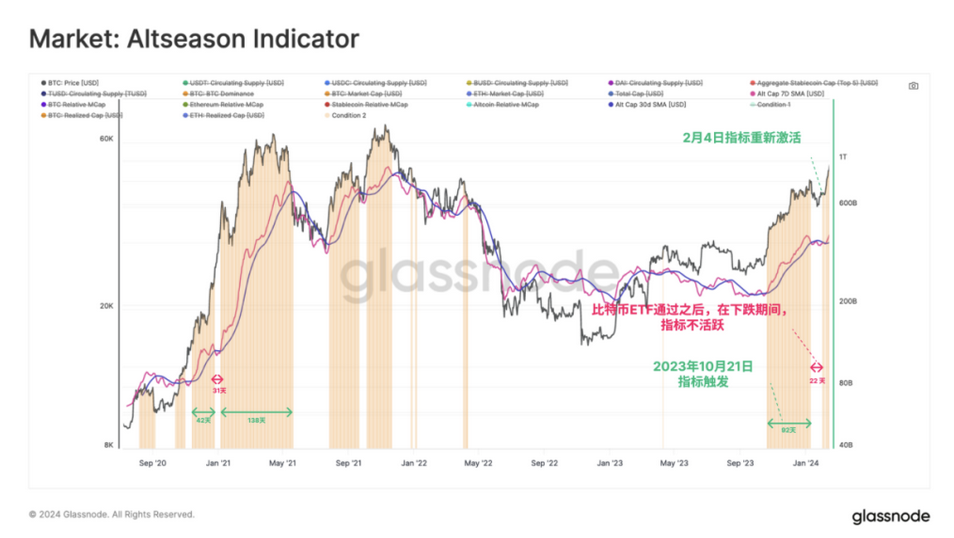
The goal is to assess how capital rotates and flows within the altcoin market. We will again use our altcoin indicator as a macro indicator (see Week 41 report of 2023). This indicator assesses whether positive momentum is forming within the total market capitalization of exchange coins, accompanied by continuous inflows into Bitcoin, Ethereum, and stablecoins.
Our altcoin indicator has shown positive momentum since last October, despite a brief pause during the "sell the news" event following the approval of the Bitcoin ETF. It re-triggered on February 4.
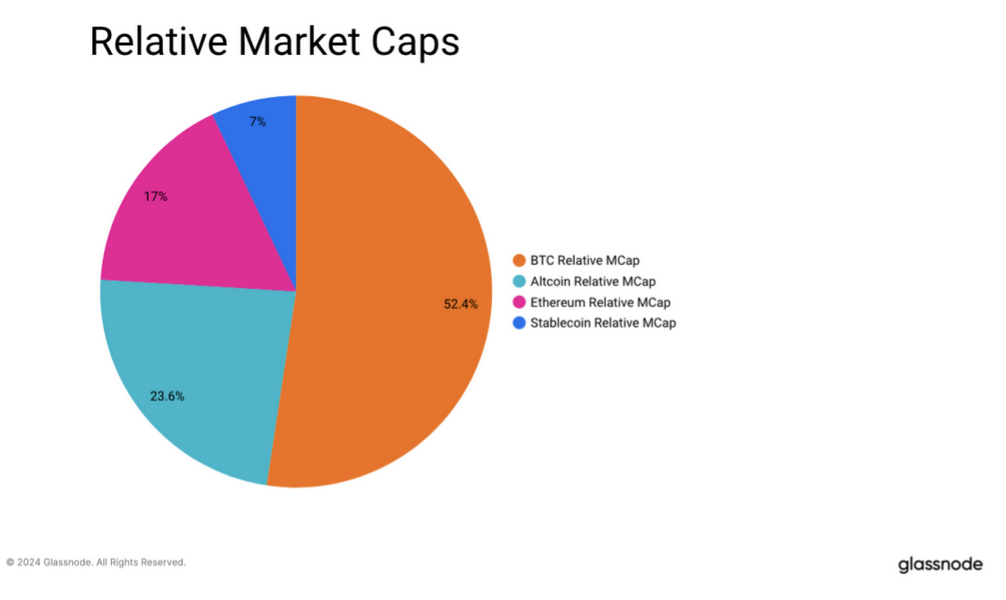
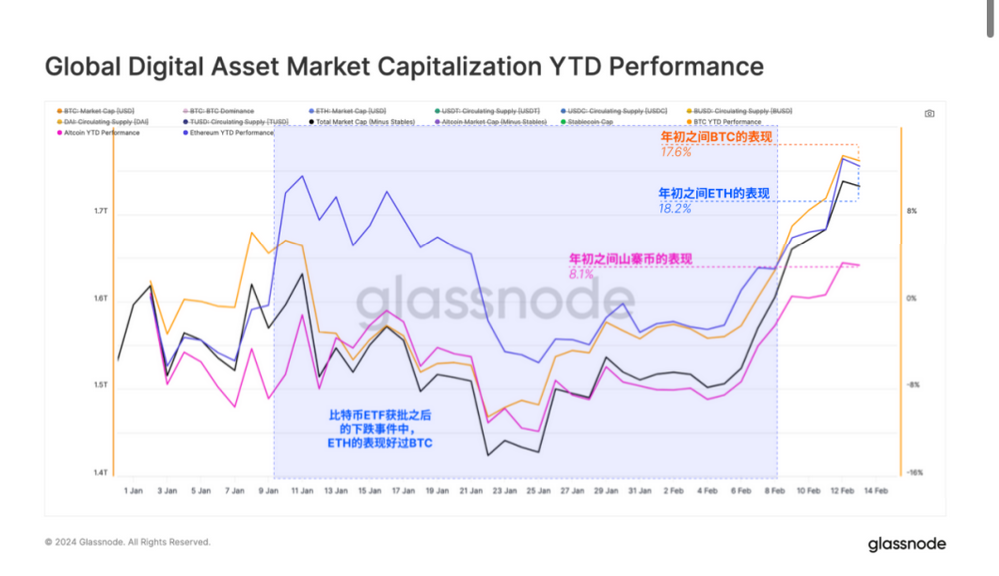
In terms of market capitalization share, Bitcoin continues to lead the entire digital asset market with over 52% market share. In comparison, Ethereum accounts for 17%, stablecoins for 7%, and the remaining altcoins for 24%.
In terms of asset performance, BTC and ETH are leading, with year-to-date (YTD) gains of +17.6% and +18.2%, respectively. We note that after the approval of the Bitcoin ETF, ETH began to outperform BTC, which marks a change from its relatively poor performance since 2023.
However, overall, the market capitalization performance of altcoins has been poor, with YTD growth being less than half of the two major currencies.
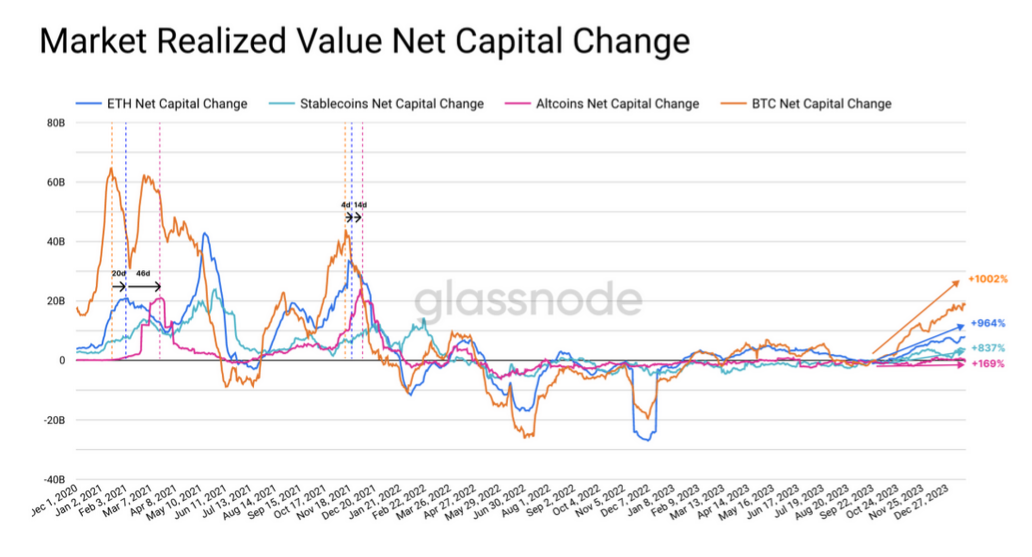
Another way to track performance is by using the realized market capitalization for each sector, which aggregates the cost basis value of all coins transferred on-chain. From this perspective, we can better assess the flow of capital within the digital asset market.
Bitcoin again clearly leads, with nearly $20 billion flowing in monthly.
Ethereum's inflows tend to lag behind Bitcoin, indicating that investors seek confidence and confirmation that the digital asset market is growing. During the 2021 cycle, the peak of new capital inflows into BTC occurred 20 days before the peak inflow into ETH.
Altcoins tend to see capital flow similarly after ETH shows strength, with a lag of 46 days in mid-2021 and 14 days at the end of 2021.
Clearly, the speed at which capital flows into altcoins is slower than the rotation between the two major cryptocurrencies, and this trend seems to be repeating itself.
2. Sector Rotation
With signs of capital flowing into the two major coins, the next question is to observe how it further flows along the risk curve over time. In the previous cycle, several new Layer-1 ecosystems emerged. Many of these ecosystems not only compete with Ethereum in terms of innovation and attracting users but also in terms of investment capital.
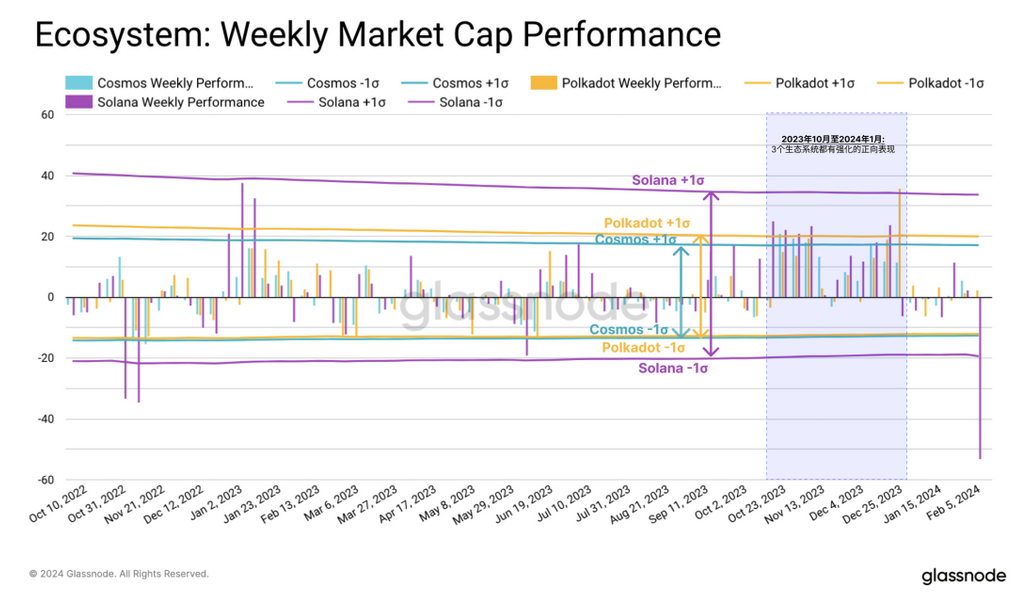
Therefore, we examined the top five tokens from selected ecosystems: Ethereum, Cosmos, Polkadot, and Solana, to assess which attracted the most investor interest.
Here we compared the weekly changes in total market capitalization of the top five tokens within each ecosystem. Over the past 18 months, Solana has shown relatively high volatility, particularly in its upward performance. Polkadot and Cosmos have similar volatility, but the Polkadot ecosystem has outperformed the latter.
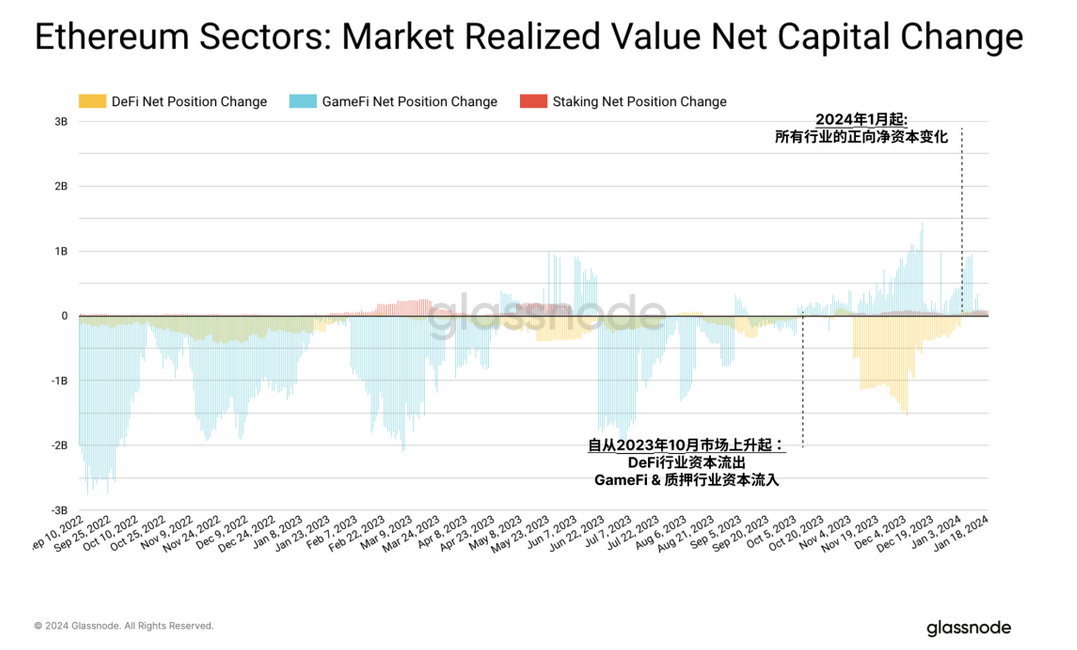
Within the Ethereum ecosystem, we can identify three main sectors: DeFi, GameFi, and staking. Since the beginning of this year, all three sectors have seen inflows, however, both DeFi and GameFi sectors have experienced relatively large capital outflows in 2022 and 2023.
This year, the GameFi sector has seen a reversal, with significant inflows starting in October, coinciding with the timing of our altcoin indicator triggering. In contrast, staking tokens have consistently experienced positive capital inflows, albeit in smaller absolute amounts.
3. Moving Along the Risk Curve
To determine whether and to what extent investor interest is shifting outward along the risk curve, we can refer to data from Uniswap liquidity pools. Since altcoins are often traded by more crypto-native traders through decentralized exchanges, activity on the earliest established DEX can serve as a proxy for altcoin trading trends (note: this data reflects Uniswap trading on the Ethereum mainnet).
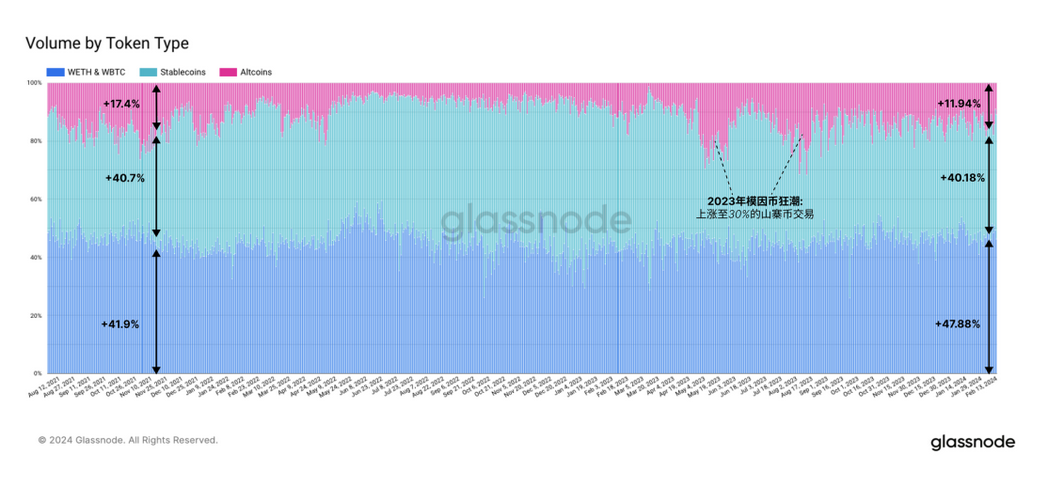
During the bear market of 2022, interest in altcoin trading was very low, but it began to increase in mid-2023, primarily driven by the "meme coin frenzy." Currently, altcoin trading accounts for nearly 12% of Uniswap's trading volume, close to the 17.4% peak during the last bull market. In comparison, WBTC and WETH account for 47% of trading volume, while stablecoins account for 40%.
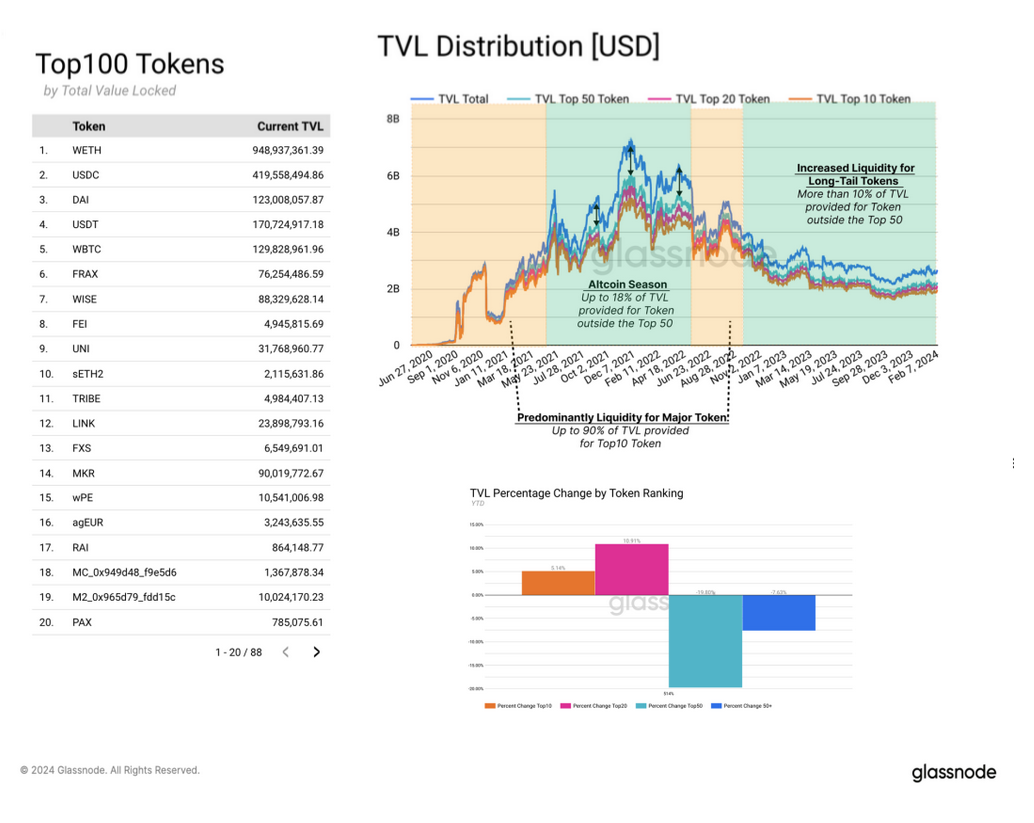
Liquidity providers on Uniswap tend to closely monitor the market, and changes in liquidity distribution across various pools can provide indications of market trends. By examining the composition of total value locked (TVL) on Uniswap, we observe that during altcoin season, liquidity allocation for tokens outside the top 50 has increased. This trend indicates growing investor interest in long-tail tokens.
During the bear market, liquidity was primarily provided for the top 50 tokens, as this is where most trading volume occurred. The top 10 tokens were mainly composed of WETH, WBTC, and stablecoins.
By looking at the percentage change in TVL for each token category, we can detect an increase in liquidity provided for the top 10 (5.14%) and top 20 (10.9%) tokens, while liquidity for tokens ranked 20 to 50 has been removed. This suggests that demand for long-tail assets has not yet significantly increased.
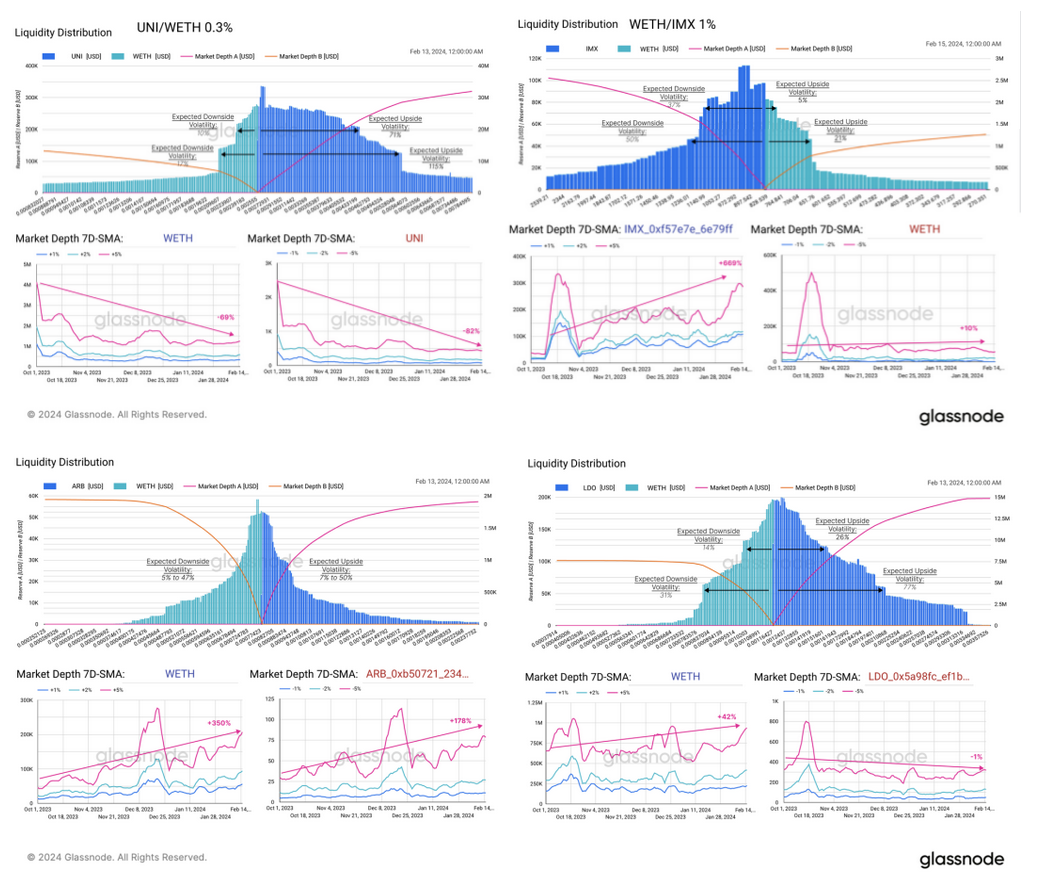
We will now examine the liquidity pools of the top tokens across various sectors within Ethereum. This includes assessing the distribution of liquidity across different price ranges and observing the evolution of market depth (similar to the hypothesis we established in the Week 36 on-chain report).
The distribution between altcoins and WETH reserves is relatively balanced, with overall expected upward volatility slightly higher. This indicates that liquidity providers generally hold a bullish view on these tokens. The GameFi token IMX is an exception.
When observing the rate of change in liquidity distribution, we see an increase in market depth within the -5% and +5% range, indicating that liquidity providers are preparing for a period of higher price volatility.
UNI is an exception, as market makers are increasingly concentrating liquidity around the current price range. This suggests that the expected price volatility for UNI tokens is low, which is not surprising given that it is one of the most mature and stable tokens. Now, comparing this with trader behavior, we can observe an increase in trading volume on Uniswap since October 2023, including tokens outside the top 10.
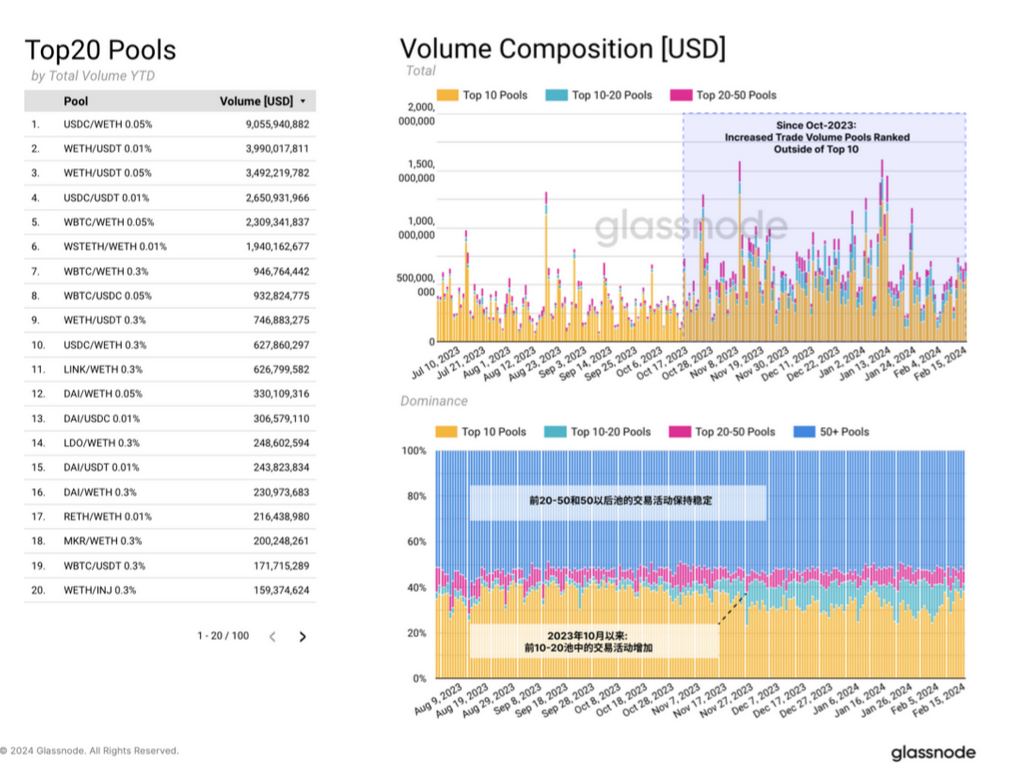
In contrast to trader behavior, we can observe an increase in trading volume on Uniswap since October 2023, including tokens outside the top 10. Trading activity for pairs ranked from 10 to 20 is also on the rise.
However, trading activity for pairs ranked from 20 to 50 and those ranked 50+ remains unchanged, which again validates our previous hypothesis. While liquidity is moving positively further along the risk curve, trading volume has not kept pace.
4. Summary and Conclusion
The market momentum from the new Bitcoin ETF, along with expectations for a bull market in digital assets, is beginning to shift funds toward altcoins. Our altcoin indicator suggests that the alternative coin market may see a more mature and potentially sustained rise, but it is still relatively concentrated in higher market cap assets.
In the past cycle, the landscape of digital assets has changed significantly, with new ecosystems emerging to challenge Ethereum's dominance. Solana has performed the strongest over the past year, but there has also been activity within the Polkadot and Cosmos ecosystems. Within the Ethereum ecosystem, the top tokens in the staking sector have shown the most consistent capital inflows.
The revival of altcoin trading on Uniswap, along with liquidity and trading volume patterns, emphasizes the growing interest in long-tail assets, which is initially reflected in changing liquidity provision and expectations for high volatility. However, this is particularly evident within the TVL in the pools, where investor trading volume has yet to follow suit.
 Risk warning Risk warning


Popular articles