
The master said about the coin: 6.7 Bitcoin is still in an upward trend, mainly focusing on buying on dips during the day

 Yesterday (6th), the price of Bitcoin retraced from a recent high of 71758 to 70454, and then selling pressure emerged, causing it to drop again to around 70140.
Price breakouts after a period of price consolidation are often worthwhile trading opportunities. ------ André Kostolany
Yesterday (6th), the price of Bitcoin pulled back from a recent high of 71758 to 70454, and then selling pressure emerged, causing it to drop again to around 70140. In yesterday's article "Master Says Coin: 6.6 Bitcoin's Upward Momentum Weakens, After Pullback, Go Long" by the master, the suggested long position between 70200-70500 was provided. I wonder if the readers who were fortunate enough to see this article followed the master's advice to go long.
Bitcoin 4-Hour Chart

According to the analysis of the Bitcoin 4H chart, we can see that the current market is showing an upward trend. The DIF line in the MACD is below the DEA line, indicating significant selling pressure in the market. However, the green histogram is gradually shortening, suggesting that selling pressure is weakening, which indicates the possibility of a rebound in the short term.
On the other hand, in the KDJ indicator, both the K line value and the D line value are hovering around 50, indicating that the market is in a consolidation state. Currently, the K line value and the D line value are below 50 and forming a golden cross upwards, suggesting that the price of Bitcoin will rebound in the short term. If the K line value and the D line value continue to rise, the price will further increase.
Finally, through the Bollinger Bands indicator, we can see that the price of Bitcoin is currently fluctuating above the middle band, indicating that the overall market still leans towards bullishness. If the price can break through the upper band and maintain above it, the bullish trend will be further confirmed. Conversely, if the price falls below the middle band, it will pull back towards the lower band.
Bitcoin 1-Hour Chart
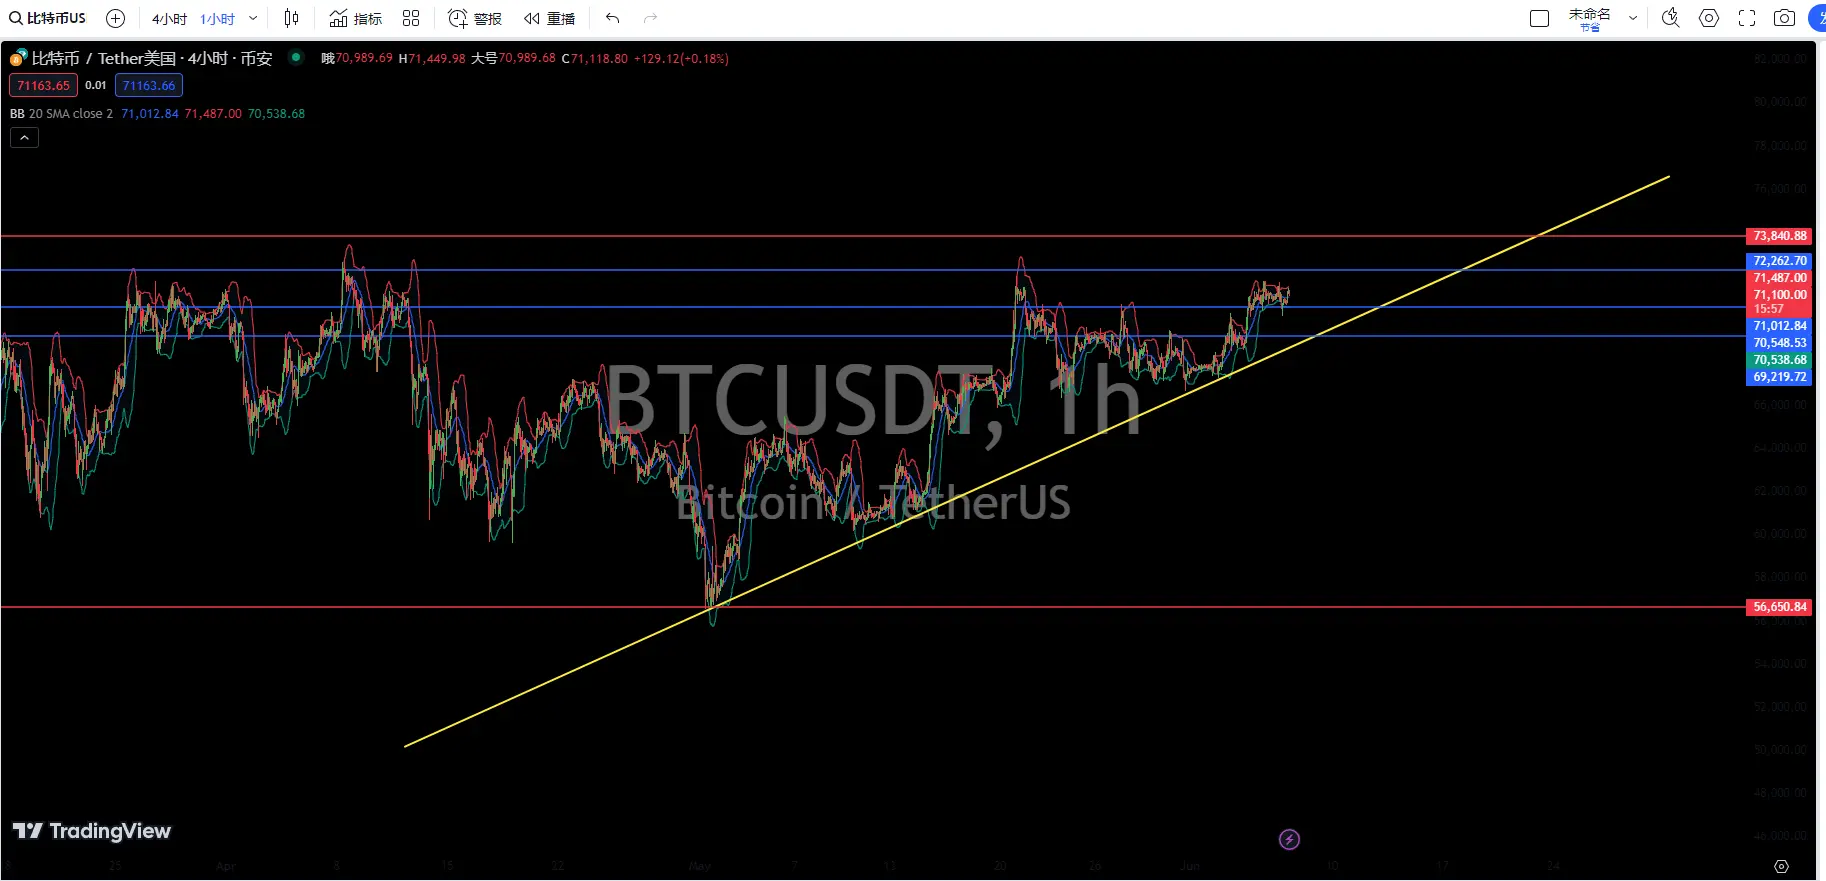
According to the Bitcoin 1H chart, first, we can see that the DIF line and DEA line in the MACD are above the 0 axis, and the DIF line is crossing down through the DEA line. This situation generally indicates that there will be downward pressure on the price in the short term.
Secondly, we can see from the KDJ indicator that both the K line value and the D line value are above 50, while the J line value is close to 100. However, the J line value shows signs of turning down, indicating that the market is currently in an overbought state and a pullback may occur at any time.
Finally, through the Bollinger Bands indicator, we can see that the current price is between the middle band (71016) and the upper band (71498), and the price just broke through the upper band before falling back below it. As we all know, when the price breaks through the upper band but fails to maintain above it, it indicates that this price level is creating some resistance to the market's upward movement, and it will likely pull back to the middle band or even the lower band (70539) nearby.
Comprehensive Analysis: Overall, Bitcoin is still in an upward trend, but both MACD and KDJ show certain sell signals, and the Bollinger Bands indicator also indicates that the price failed to maintain after breaking through the upper band, suggesting insufficient upward momentum and that there will be certain pullback pressure in the short term. In terms of intraday operations, the master suggests focusing on going long during pullbacks.
Based on the above, the master provides the following suggestions for reference:
Go long on Bitcoin at the 70700-71000 level, targeting 71550-72100, with a stop loss at 70450. (The above points are based on the time of writing)
Time of writing: (2024-06-07, 15:00)


