11 charts interpreting the mixed performance of the August cryptocurrency market
Summary:
For the cryptocurrency industry, the past August was a month of mixed results. This article will interpret the state of the cryptocurrency market over the past month with 11 charts.

2024-09-02 23:43:58
Collection
 For the cryptocurrency industry, the past August was a month of mixed results. This article will interpret the state of the cryptocurrency market over the past month with 11 charts.
Author: Lars, Head of Research at The Block
Compiled by: Jordan, PANews
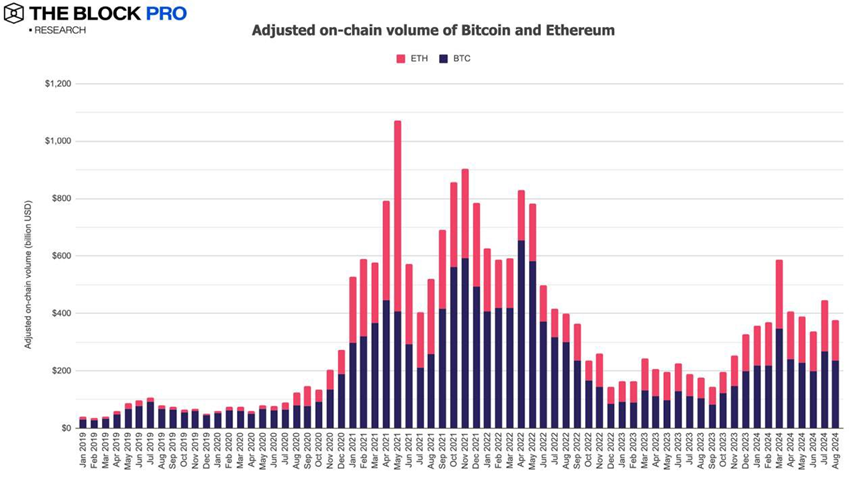
- In August, the total on-chain transaction volume for Bitcoin and Ethereum decreased by 15.3% after adjustments, falling to $377 billion, with Bitcoin's adjusted on-chain transaction volume dropping by 12.1% and Ethereum's by 20.2%.
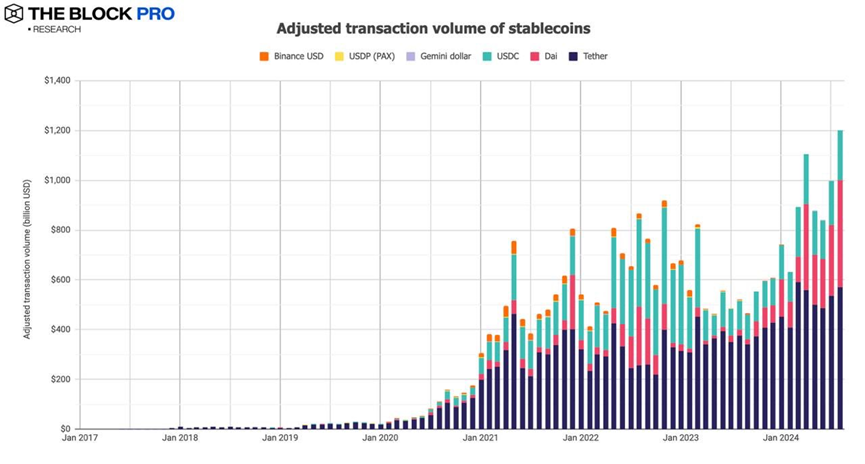
- The adjusted on-chain transaction volume for stablecoins in August grew by 20.5%, reaching $1.2 trillion, while the supply of stablecoins increased by 2.9% to $148.4 billion, with USDT and USDC holding market shares of 78.7% and 17.4%, respectively.
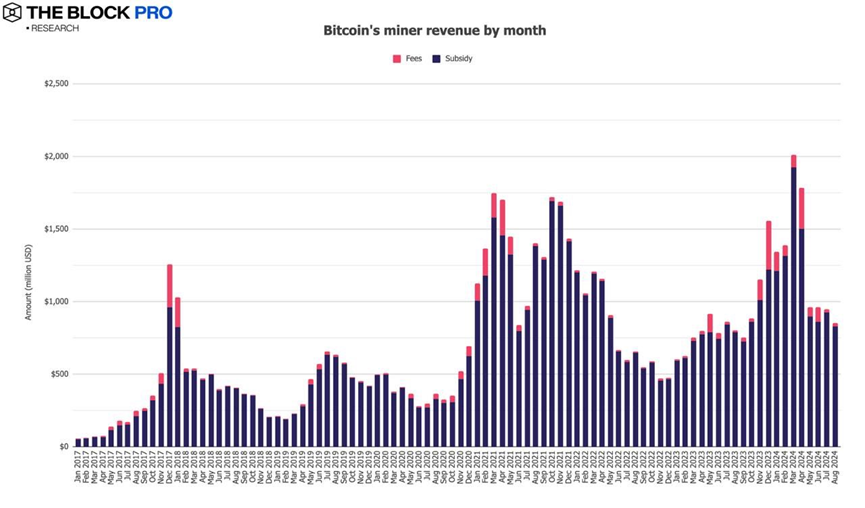
- Bitcoin miner revenue reached $851.4 million in August, a decline of 10.4%. Additionally, Ethereum staking revenue also fell by 19.3%, dropping to $218.2 million.
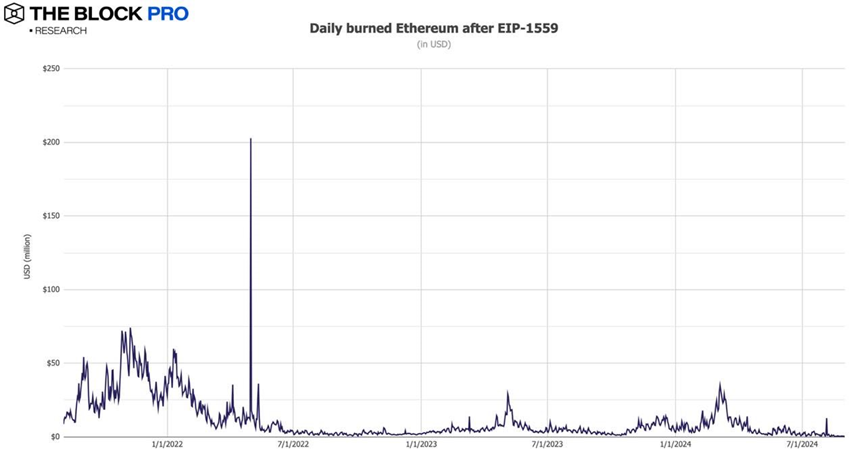
- In August, the Ethereum network burned a total of 13,467 ETH, worth approximately $34.9 million. Data shows that since the implementation of EIP-1559 in early August 2021, Ethereum has burned a total of about 4.37 million ETH, valued at around $12.3 billion.
- The on-chain NFT market for Ethereum continued its downward trend in August, with a decline of 12.8%, further dropping to approximately $123.2 million.
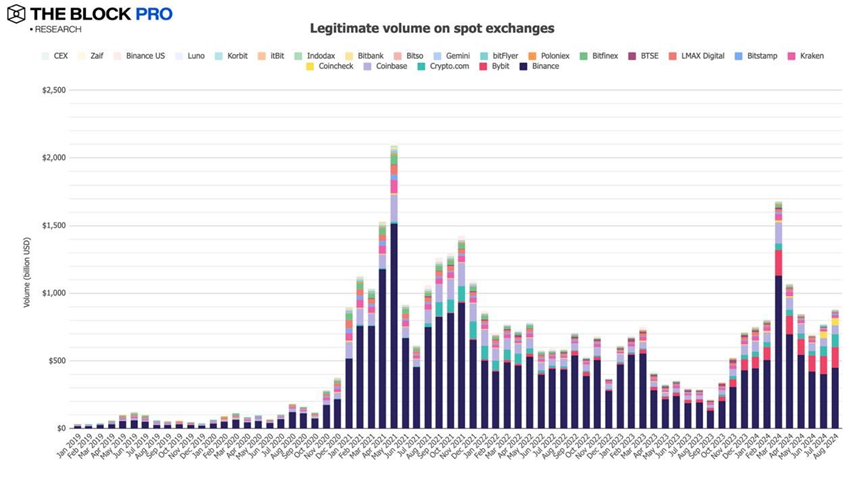
- The spot trading volume of compliant centralized exchanges (CEX) increased in August, rising by 13.7% to $877.5 billion.
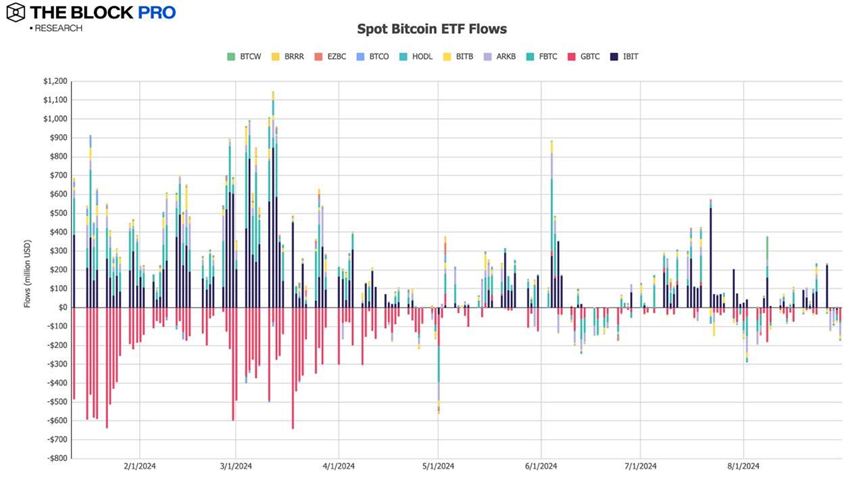
- In August, the net inflow of spot Bitcoin ETFs experienced negative growth, with an outflow amount of approximately $422.1 million.
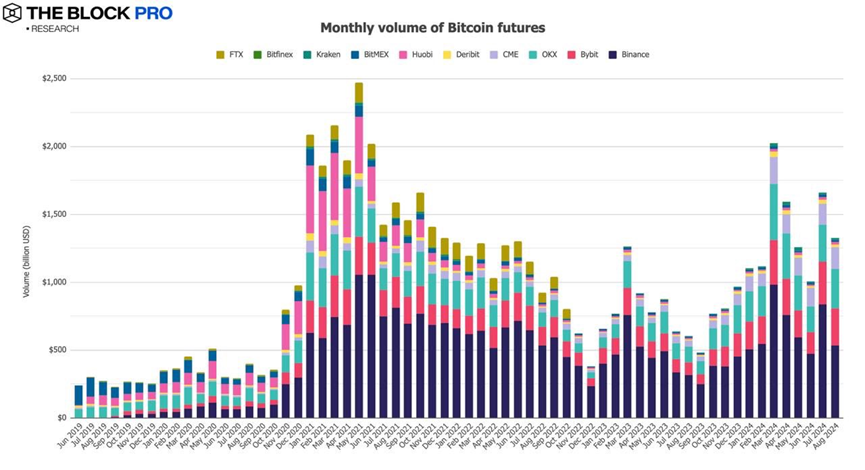
- In terms of cryptocurrency futures, the open interest for Bitcoin futures fell by 17.9% in August; Ethereum futures open interest decreased by 28.6%. Regarding trading volume, Bitcoin futures trading volume in August dropped by 20.2% to $1.33 trillion, while Ethereum futures trading volume declined by 22.2%.
- In August, the open interest for Bitcoin futures on the Chicago Mercantile Exchange decreased by 15.3%, falling to $9 billion, with the daily average volume declining by 0.2% to approximately $5.04 billion.
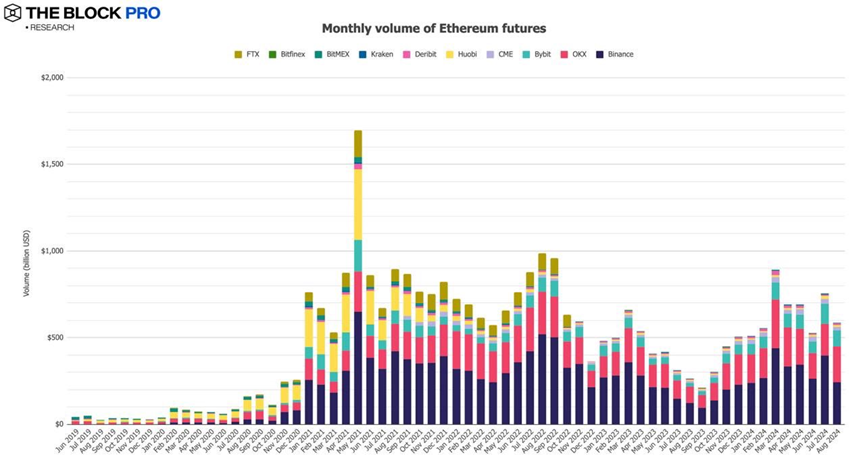
- The average monthly trading volume for Ethereum futures in August decreased by $58.75 billion, a decline of 22.2%.
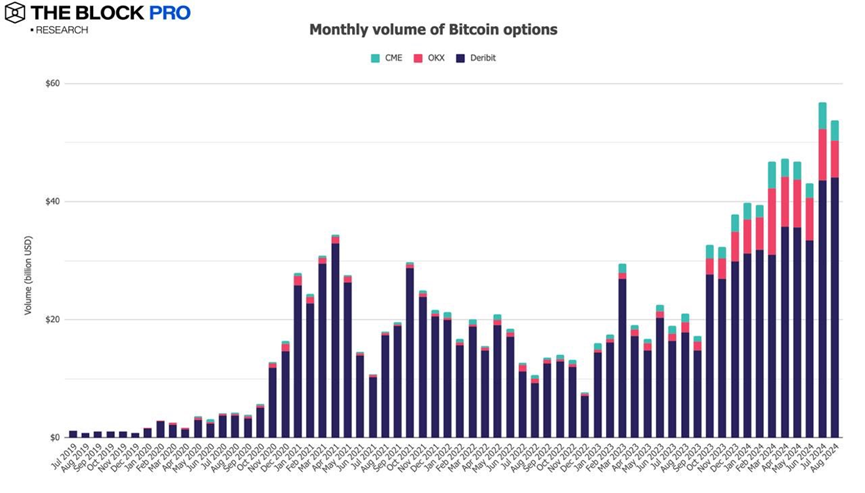
- In the cryptocurrency options market, the open interest for Bitcoin options fell by 3.8%, while Ethereum options open interest also declined by 13.9%. Additionally, in terms of trading volume, Bitcoin monthly options trading volume reached $53.8 billion, down by 5.4%; Ethereum options trading volume was $15.5 billion, remaining roughly stable compared to the previous month.


 Risk warning
Related tags
Risk warning
Related reading

Cloud aggregation in the air has shifted: from disdain for stablecoins a year ago to high-profile capital entering the market today
2026-06-26

ETH has entered a non-consensus phase, and the turning point is approaching!
2026-06-26

Who is footing the bill for the $64 billion accounting frenzy?
2026-06-26


Popular articles
A letter from Alliance to entrepreneurs: Written on the occasion of Cursor selling for 60 billion dollars
06-20

The two giants are racing in "credit": loan balances of 9.9 billion vs 14.6 billion USD, Brazil has become the main battlefield
06-22

Concerns Behind the Binance Customer Service Controversy
06-16