
The Great God said: 4.2 Bitcoin is challenging $85,000 again! The US stock market is watching the Trump tariff war!

 Trump is set to announce a new round of tariff policies at midnight on the 2nd Eastern Time.
Affected by Trump's tariff policy and the stubborn inflation in the U.S., the performance of cryptocurrencies and U.S. stocks in the first quarter of this year has been disappointing. On April 1, QCP released a report summarizing on its official Telegram channel, indicating that Bitcoin, Ethereum, and the S&P 500 index all recorded their worst quarterly performance in nearly three years in the first quarter. The second quarter also started under pressure, with the total market capitalization of the cryptocurrency market evaporating by over $160 billion since last Friday, highlighting the severe situation faced at the beginning of the second quarter.
** Last night, after the U.S. stock market opened, many investors were focused on Trump's upcoming announcement of a new round of tariff policies at 2 a.m. Eastern Time on the 2nd, leading to a relatively quiet market. The four major indices closed slightly higher, with only the Dow Jones Industrial Average declining, closing down 0.03%.**
** In terms of cryptocurrencies, around 10:00 PM last night, there was a rapid drop to $82,500, but it quickly rebounded with the U.S. stock market, reaching a high of around $85,555 in the morning. It has since retreated, currently quoted at $84,579, with a 24-hour increase of 0.61%.**
** Key events to watch this week: The market correction over the weekend was mainly due to large-scale options expiration at the end of the quarter, leading to market sell-offs as traders actively sold, causing the perpetual contract funding rate to shift from neutral to negative. Meanwhile, the deleveraging in the cryptocurrency market coincided with macro data bringing renewed pressure. Core inflation data exceeded expectations, confirming that inflation in February was more stubborn.**
** Although April is usually a relatively good month for cryptocurrency returns, caution is still needed. In addition to Trump's tariff policy announcement at 3 a.m. Beijing time on April 3, other key events to watch this week include Tuesday's ISM Manufacturing PMI; Thursday's ISM Services PMI; and Friday's non-farm payroll data, unemployment rate, and Federal Reserve Chairman Powell's speech.**
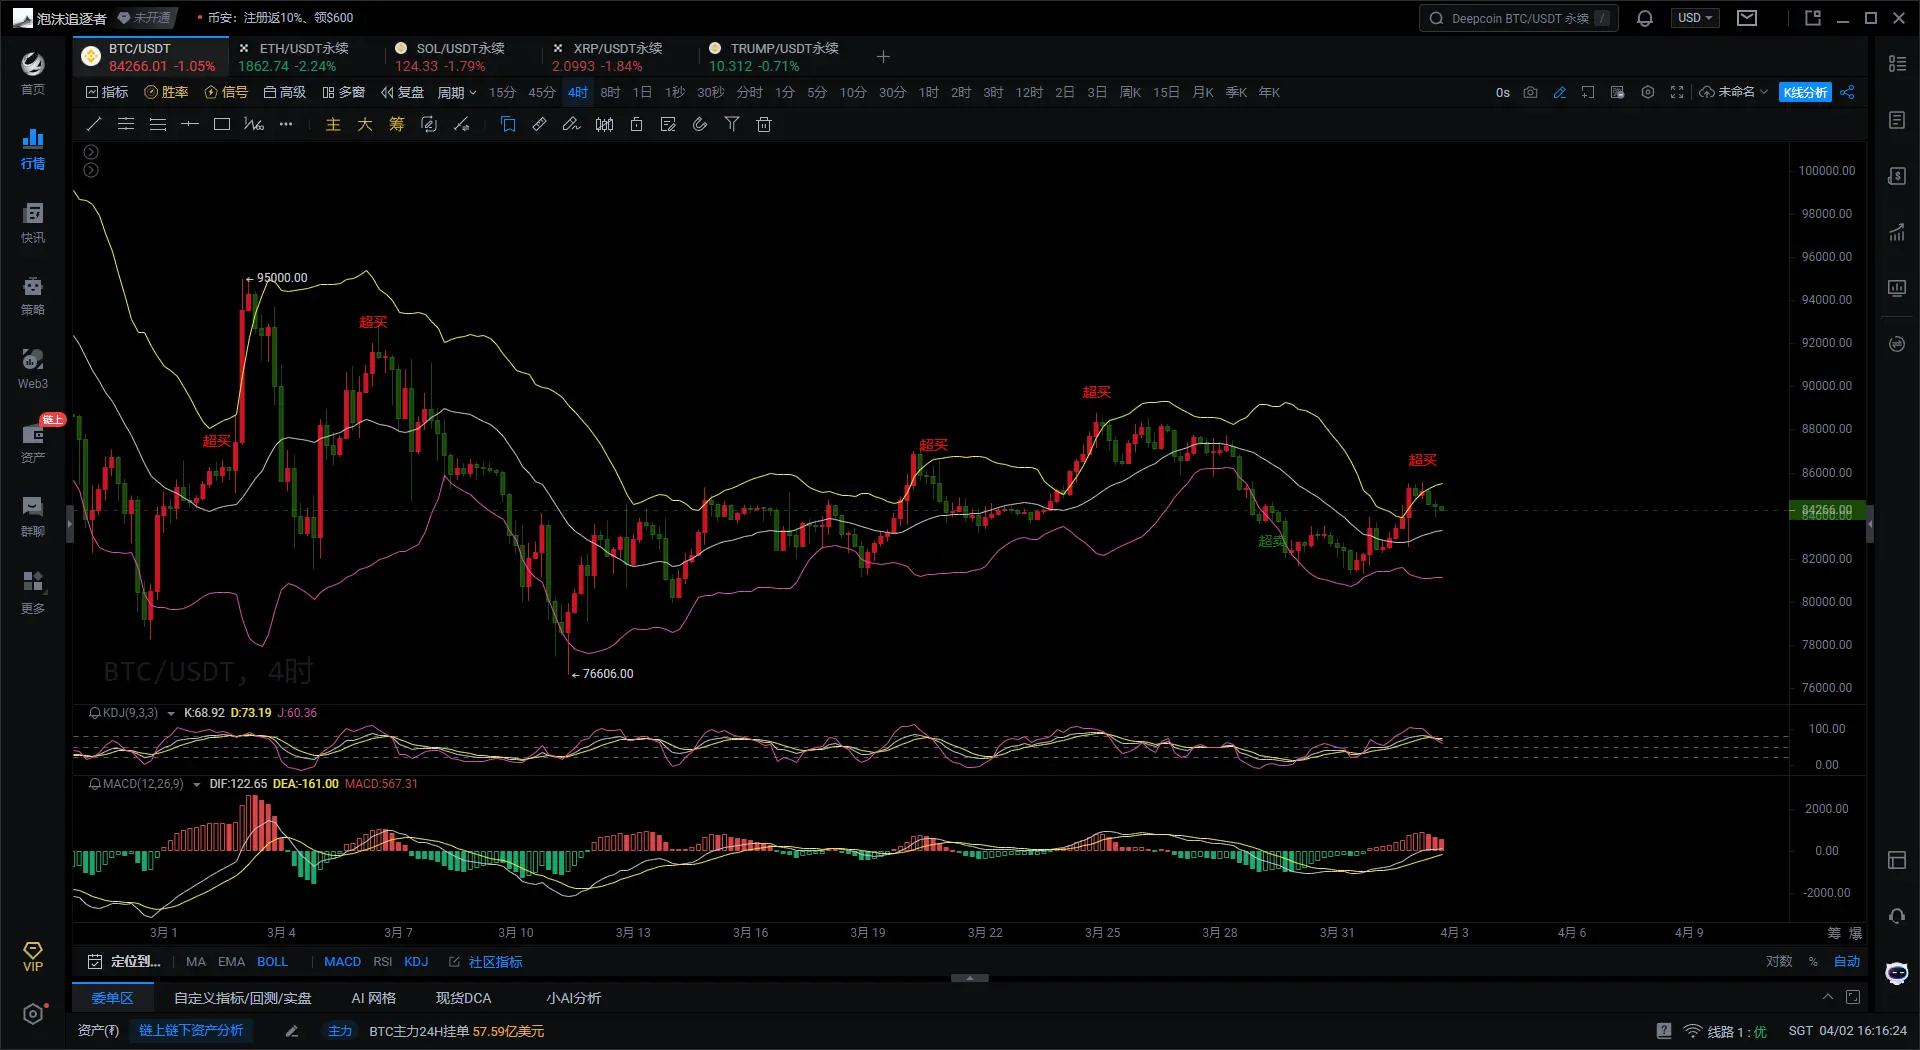
** Bitcoin 4-Hour Chart**
**  **
**
** First, according to the Bollinger Bands indicator on the Bitcoin 4H chart, the current price is operating near the middle band and has slightly broken upwards, indicating a short-term upward trend. If the price continues to move along the upper band, it may rise further, but caution is needed regarding the risks brought by the news at 3 a.m.**
** Second, according to the MACD indicator on the Bitcoin 4H chart, the DIF line and DEA line are operating near the 0 axis and are turning downwards, showing a tendency to form a death cross, which is usually a bearish signal. The MACD red histogram is also gradually shortening, indicating that bullish momentum is weakening and bearish pressure is approaching.**
** Finally, according to the KDJ indicator on the Bitcoin 4H chart, the K and D values have entered the overbought zone and are crossing downwards in the overbought area to form a death cross pattern, which is typically seen as a signal that bearish pressure is imminent. The price may subsequently retreat downwards.**
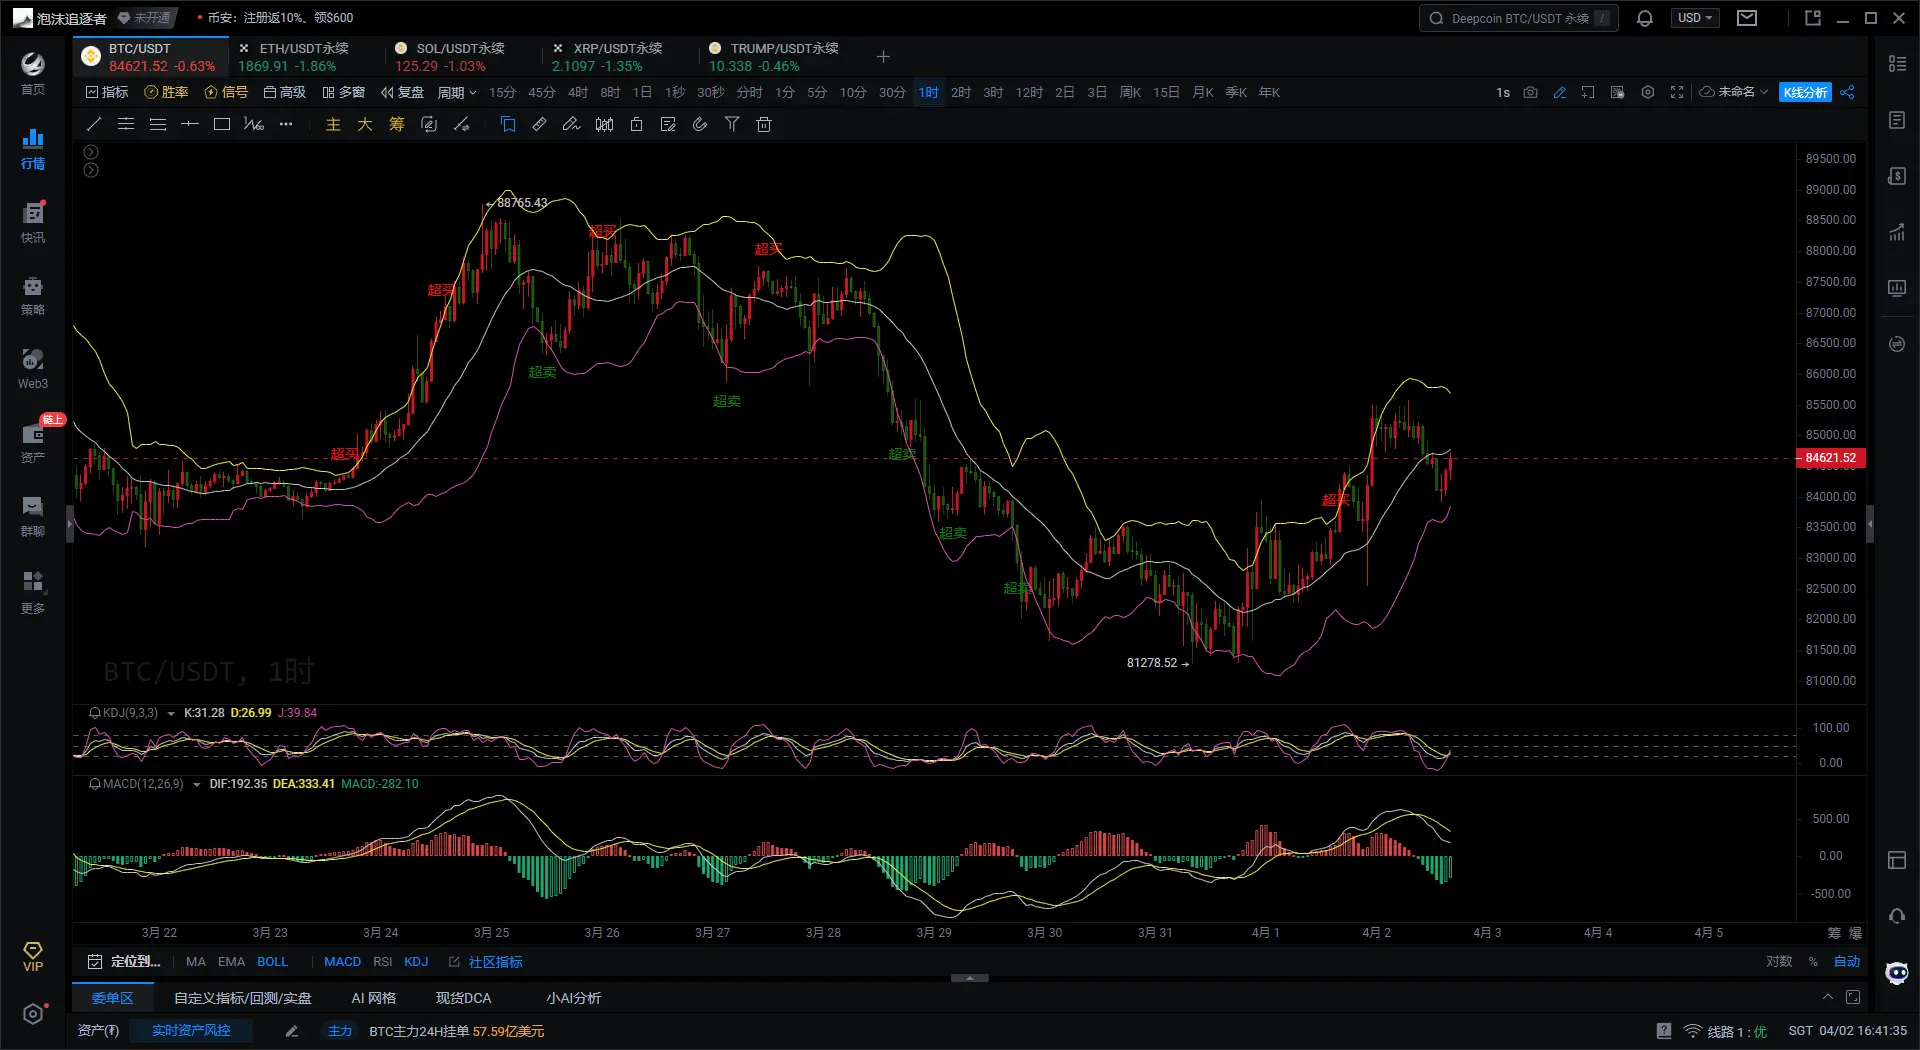
** Bitcoin 1-Hour Chart**
**  **
**
** First, according to the Bollinger Bands indicator on the Bitcoin 1H chart, the price once broke through the upper band and then retreated, currently operating between the middle and lower bands, indicating a short-term adjustment phase. If the price can effectively stabilize above the middle band, it may challenge the upper band again; if it fails to stabilize above the upper band, it may retest the lower band.**
** Second, according to the MACD indicator on the Bitcoin 1H chart, the DIF line and DEA line are operating above the 0 axis and have formed a death cross pattern, accompanied by the MACD histogram turning from red to green, indicating that bearish momentum is increasing and a pullback is possible in the short term.**
** Finally, according to the KDJ indicator on the Bitcoin 1H chart, the K and D values are at relatively low positions but have not entered the oversold area. If the KDJ three-line values form a golden cross pattern, a short-term rebound may occur; if it continues to move downwards, the speed of the decline will accelerate.**
** In summary, Bitcoin's price is expected to oscillate between 83,900 and 84,600 in the short term. The MACD indicator on the 4H chart shows that the DIF line and DEA line have formed a death cross pattern, accompanied by a shortening of the red histogram, indicating a need to be cautious of pullback risks. Although the KDJ indicator on the 1H chart has not entered the oversold area, the MACD indicator has also formed a death cross pattern, showing that bearish momentum is increasing.**
** Based on the above analysis, the following suggestions are provided for reference:**
** Suggestion 1: Short Bitcoin at 84,800-85,000, with a stop loss at 85,500 and a target of 83,800-83,300.**
** Suggestion 2: Long Bitcoin at 83,000-83,300, with a stop loss at 82,600 and a target of 85,000-85,500.**
** A 100% accurate suggestion is not as valuable as providing you with the right mindset and trend. After all, teaching a person to fish is better than giving them a fish. Suggestions may earn you a moment, but learning the mindset will earn you a lifetime! Focus on the mindset, grasping the trend, and planning your positions. What I can do is use my practical experience to help you, guiding your investment decisions and management in the right direction.**
** Written on: (2025-04-02, 16:10)**
** (Article by: Daxian Says Coin)**


