【Macroeconomic Weekly┃4 Alpha】Is capital fleeing the United States? What signals does the bond sell-off give?

 The U.S. market faces a triple whammy in stocks, bonds, and currencies, with U.S. Treasury yields soaring to 4.47%, the dollar index falling below 100, and gold surpassing $3,200. Stagflation risks are emerging, liquidity crises and the spiral of U.S. Treasury sell-offs are intensifying, coupled with nearly $9 trillion in maturing debt pressure by 2025. The market is shifting towards defensive logic, leading to a divergence in safe-haven assets.
Market Overview
- Market Anomalies
Stock-bond-currency triple whammy: U.S. stocks experienced severe volatility (S&P +5%), U.S. Treasury yields surged (10-year to 4.47%), and the dollar index fell below 100.
Divergence in safe-haven assets: Gold skyrocketed (breaking through $3200/ounce), the yen and Swiss franc strengthened, undermining the traditional safe-haven status of the dollar.
- Contradictory Economic Data
Early signs of stagflation: CPI declined (due to falling gasoline prices) but core inflation (housing + food) remained stubborn; PPI month-on-month -0.4% (demand shrinkage + cost rigidity).
Tariff impact not yet visible: Current data does not reflect the impact of new tariffs, with market pessimism leading the way.
3. Signs of a Liquidity Crisis
U.S. Treasury sell-off spiral: Long-term bonds plummeted → collateral value shrank → hedge funds forced to sell → yields rose further.
Pressure in the repo market: The BGCR and SOFR spread widened, reflecting a sharp rise in collateral financing costs, exacerbating liquidity stratification.
4. Policy and External Risks
Trump’s tariff game: Tariffs on China rose to 145%, while China retaliated with tariffs at 125%; the trade war has partially eased, but long-term risks remain.
U.S. Treasury refinancing cliff: Nearly $9 trillion in debt maturing by 2025, with foreign holders potentially exacerbating liquidity pressure if they sell off.
Outlook for Next Week
1. Market Shifts to Defensive Logic
Doubts about dollar credit: Funds are shifting to non-dollar safe-haven assets (gold, yen, Swiss franc).
Stagflation trades dominate: Long-term U.S. Treasuries and highly leveraged equity assets face selling risks.
2. Key Monitoring Indicators
U.S. Treasury liquidity (whether the 10-year yield breaks above 5%), changes in Chinese bond holdings, Japanese central bank currency interventions, high-yield bond spreads.
Is capital fleeing the U.S.? What signals does the bond sell-off send?
I. Macro Review This Week
1. Market Overview
As the storm swept through the financial markets following the implementation of reciprocal tariffs, the Trump administration was forced to make some concessions. All countries except China received a 90-day grace period, but the trade confrontation with the U.S. has not ceased. As we warned in last week’s report, a series of trade news shocks have once again driven the market into severe volatility. Currently, all tariff rates have been reduced to 10% except for China, where the U.S. has raised the previous tariff rate to 145%. In response, China has raised tariffs on U.S. imports to 125%.
U.S. Stocks: The S&P 500 index rose 5% this week, but experienced significant volatility; the Dow Jones and Nasdaq also recorded gains of over 5%.
Safe-Haven Assets: The 10-year Treasury bond saw a rare continued decline, with yields rising to a high of 4.47%, and long-term bond selling continues; meanwhile, the dollar index has unusually fallen below 100, resulting in a triple whammy in stocks, bonds, and currencies. In contrast, spot gold continued to break new highs, exceeding $3200/ounce, with a weekly increase of over 5%.
Commodities: The escalation of the tariff war has triggered expectations of trade shrinkage, suppressing oil demand. Brent crude oil continued to weaken, dropping 5.5% to $62/barrel; copper prices also fell sharply by 13%, reaching a recent low.
Cryptocurrency: After a brief divergence from U.S. stocks last week, Bitcoin resumed its correlation with U.S. stocks this week, with Bitcoin prices remaining suppressed below $85,000.
Chart: Historical Volatility and Returns of U.S. Stocks

Source: Bloomberg
2. Economic Data Analysis
This week continued to focus on Trump’s tariff situation and CPI data.
2.1 Trump’s Tariff Analysis
Compared to the reciprocal tariffs announced last week, the Trump administration made some concessions this week.
The basic tariff rate has been adjusted to 10%.
Specific tariffs on China increased to 145%, while China correspondingly raised tariffs on U.S. goods to 125%.
From this week’s observations, the announcement of tariffs has triggered global reactions, with some countries opting for countermeasures, such as China and Europe, while others chose negotiation, such as Japan, South Korea, and Vietnam. However, as the largest trade deficit country with the U.S., the escalation of the trade war between the two continues to shake global financial markets. As stock, bond, and currency markets have all sharply declined, nearing bear market territory, the U.S. government has made concessions, aligning with our prediction from last week that the tariff war surrounding trade will further trend towards easing, and the peak of uncertainty in trade policy has passed.
Chart: Impact of Tariffs on the U.S. Economy (Predictions from Different Institutions)
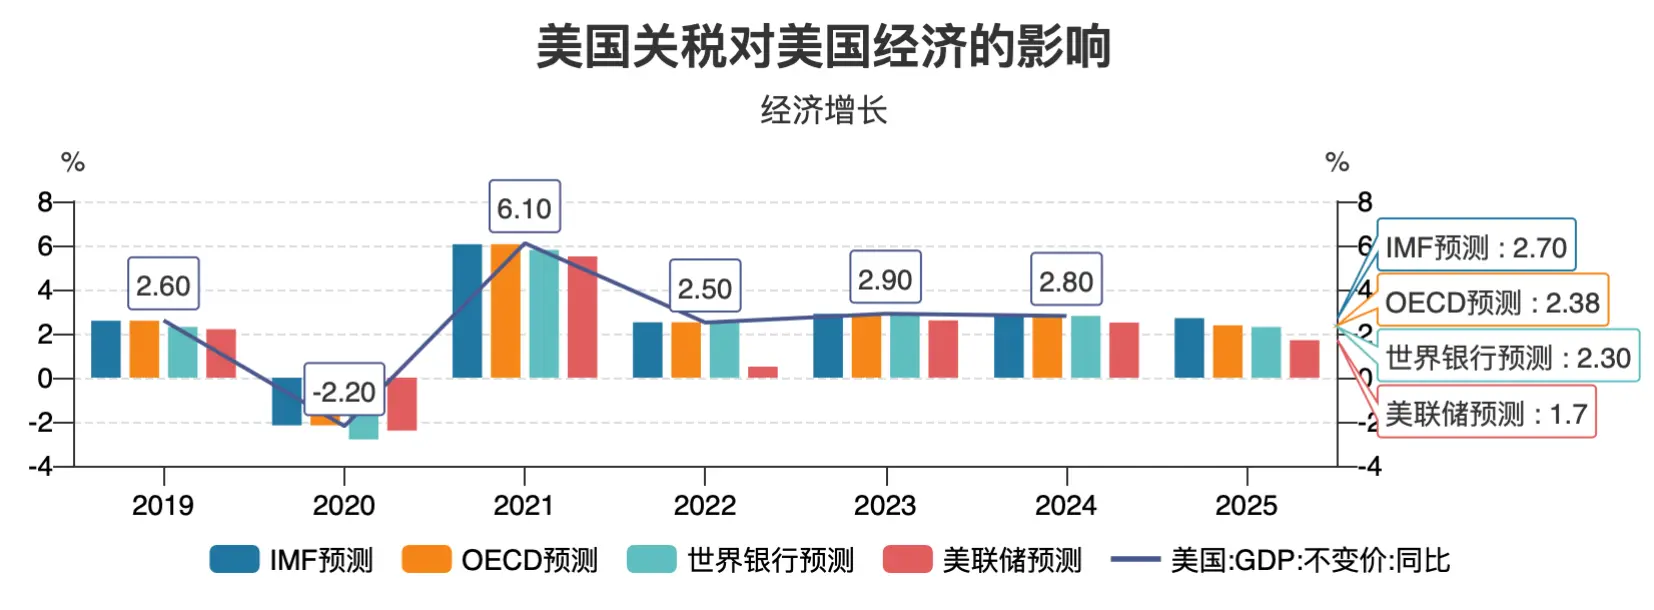
Source: Wind
2.2 CPI and PPI
This week’s CPI data unexpectedly declined, but considering that the data released this week does not include the impact of tariffs, the market reacted even more pessimistically.
Chart: U.S. March CPI Month-on-Month Performance

Source: MishTalk
This data represents the weakest figures since May 2020. From the breakdown of the data, the decline in gasoline prices improved the overall CPI situation; however, housing and food, as the largest rigid burdens for households, saw costs rise by 0.3% and 0.4%, respectively. Looking at core CPI, the price index of all items excluding food and energy rose by 0.1%, compared to a 0.2% increase in February; airfare, auto insurance, used cars and trucks, and entertainment were the main categories that declined in March.
On Friday, the U.S. Department of Labor released PPI data, which, after seasonal adjustment, showed a month-on-month decline of 0.4% in March, marking the lowest monthly growth since the COVID-19 pandemic. The main reason for this was also the decline in commodity prices; energy and food prices saw slight decreases, but core goods excluding energy continued to rise, indicating that the cost pressures from tariffs have not eased; in the services sector, demand-sensitive areas such as transportation, warehousing, and wholesale have clearly contracted, while rigid services remained relatively stable.
Chart: U.S. March PPI Performance

Source: MishTalk
In summary, the price signals from PPI conclude that: supply-side cost pressures still exist, but the weakening demand-side trend is strengthening, initially showing early signs of stagflation.
From the CPI and PPI data released this week, it can be clearly established that under the impact of tariffs and market pessimism, the shrinkage on the demand side and the rigidity of supply-side cost pressures will, on one hand, compress corporate profits and affect economic performance; on the other hand, hinder the smooth decline of inflation, with stagflation risks gradually beginning to emerge in the data.
3. Liquidity and Interest Rates
From the perspective of the Federal Reserve's balance sheet, this week, the Fed's broad liquidity continued to marginally recover to $6.2 trillion, returning to positive year-on-year growth.
However, this week, the dollar index and the U.S. Treasury market sent another ominous signal.
Chart: Changes in U.S. Overnight Financing Rates and Treasury Yields

Source: Wind
As shown in the chart above:
1) The U.S. 10-year Treasury yield surged this week, indicating that the sell-off storm is still ongoing, with the overall yield rising to around 4.45%.
2) The SOFR term rate rebounded during the week, indicating that the market is pricing in the possibility that the Fed may continue to tighten monetary policy rather than quickly cut rates.
At the same time, further analysis of the dollar index reveals that the surge in Treasury yields coincided with a significant drop in the dollar index.
Chart: Changes in the Dollar Index

Source: ZeroHedge
This week’s anomaly is that the original oil price crash and declining inflation data would further suppress the rise in Treasury yields, yet a triple whammy in stocks, bonds, and currencies occurred instead. The dollar index fell below the 100 mark, reaching a new low for July 2023, while traditional safe-haven currencies like the Swiss franc and yen strengthened simultaneously. Analyzing this anomaly further, we can draw the following conclusions.
1) As we analyzed above, under the influence of increased tariffs and the initial emergence of stagflation risks, the interest rate volatility index (Move Index) surged significantly, with the market pricing in the Fed's "higher for longer" stance. Long-term Treasury yields (such as 10/30 years) rose rapidly, while swap rates were suppressed by recession expectations, leading to a narrowing or even inversion of the basis, compounded by foreign central bank sell-offs. The rapid decline in long bond prices triggered a decrease in the value of collateralized Treasury bonds, forcing hedge funds to sell Treasuries to cover positions, creating a "decline → sell-off → further decline" spiral.
Furthermore, we can clearly see from the financing-side rates of hedge fund leverage (BGCR) (in the chart below) that from mid to late March to early April, the difference between BGCR and SOFR significantly widened, especially after March 22, when BGCR (blue line) clearly fell, while SOFR (green line) remained relatively stable. This indicates that the market may have experienced some drastic liquidity changes or fluctuations in market sentiment at this time, leading to increased basis trading pressure and further triggering a series of forced liquidation actions.
Chart: Repo Market Rates and SOFR Rates Performance

Source: Wind
2) The typical decline in the dollar index stems from the easing of dollar liquidity; U.S. Treasury yields reflect expectations for economic growth. However, this time, the simultaneous decline in the dollar index and Treasury prices (with yields rising) is not due to significant easing of dollar liquidity and a clear improvement in economic growth, but rather due to funds fleeing the U.S. to seek refuge in Japan and Europe (with the yen, euro, and Swiss franc appreciating). In other words, the traditional logic of dollar safe-haven has failed.
3) The U.S. faces significant refinancing pressure on its Treasuries, with nearly $9 trillion in debt maturing in the coming years, especially with about $6 trillion maturing in June. How to refinance these debts will be a major challenge for U.S. finances. Trump’s tariff policy may attempt to force other countries to buy U.S. Treasuries, but under the current economic circumstances, this may be difficult to achieve. This could lead foreign holders to sell Treasuries out of risk aversion.
In fact, from the above three points, it is clear that the current situation reflects the market's lack of trust in dollar credit itself. The migration of funds seeking safety and the repricing of debt risks have led to a certain liquidity crisis in the entire U.S. Treasury market.
II. Macro Outlook for Next Week
The current market is shifting from "inflation worries" to a dual impact of "dollar credit crisis + stagflation," with the traditional negative correlation between stocks and bonds gradually breaking down. Attention should be paid to the following risks:
1) Under tariff pressure, early signs of stagflation are emerging: Current economic data, including CPI and PPI, indicate that the U.S. economy is facing stagflation risks. The coexistence of demand-side shrinkage and supply-side cost rigidity compresses corporate profit margins while making it difficult for inflation to decline rapidly. Stagflation typically implies a dilemma of slowing economic growth and persistent inflation, creating significant uncertainty for the market's long-term performance.
2) Pressure in the bond market and tightening dollar liquidity: The 10-year U.S. Treasury yield has surged to around 4.45%, indicating that bond market sell-offs are ongoing, and long-term bond prices are further declining, triggering pressure on basis trading, especially for institutions like hedge funds. This situation may lead to more debt sell-offs and a chain reaction, creating a "decline → sell-off → further decline" spiral effect, further increasing market instability.
3) U.S. Treasury refinancing pressure: The U.S. faces enormous refinancing pressure on its Treasuries, with about $9 trillion in debt maturing in the coming years, particularly with approximately $6 trillion maturing in June. How to refinance these debts will be a significant challenge for U.S. finances. Trump’s tariff policy may attempt to force other countries to buy U.S. Treasuries, but in the current economic environment, this may be difficult to achieve, potentially leading foreign holders to sell Treasuries out of risk aversion, further exacerbating market risks.
Based on the above analysis, our overall view is:
The current trading benchmark scenario remains primarily defensive.
Further attention should be paid to the evolution of stagflation patterns to assess whether economic growth will accelerate into recession or inflation will decline less than expected.
Continued focus on the liquidity crisis in U.S. Treasuries, especially regarding whether the high-yield credit bond market will also be affected.
The weakness of the dollar may continue to impact global markets, particularly in the context of global capital flows, with the strengthening of safe-haven currencies like the yen and Swiss franc warranting attention. Investors should consider how to adjust their allocations to dollar assets and monitor dynamics in the foreign exchange market.
Cryptocurrencies are primarily influenced by the dollar and currently lack sufficient upward momentum; the current safe-haven logic is not particularly strong, so a neutral stance is still recommended in the short term.
Attention should be paid to the evolution of tariffs; if they further ease, it may boost risk appetite; if U.S. Treasury yields rise above 5%, further sell-offs by foreign holders and potential Fed intervention could trigger a deeper credit crisis.
Key macro data for next week is as follows:

Disclaimer
This document is for internal reference only by 4 Alpha Group, based on 4 Alpha Group's independent research, analysis, and interpretation of existing data. The information contained in this document is not investment advice and does not constitute an offer or invitation for residents of the Hong Kong Special Administrative Region, the United States, Singapore, or other countries or regions where such offers are prohibited to purchase, sell, or subscribe to any financial instruments, securities, or investment products. Readers should conduct their own due diligence and seek professional advice before contacting us or making any investment decisions.
This content is protected by copyright and may not be copied, distributed, or transmitted in any form or by any means without the prior written consent of 4 Alpha Group. Although we strive to ensure the accuracy and reliability of the information provided, we do not guarantee its completeness or timeliness and accept no liability for any loss or damage arising from reliance on this document.
By accessing this document, you acknowledge and agree to the terms of this disclaimer.
 Risk warning Risk warning