【Macroeconomic Weekly Report┃4 Alpha】The implementation of reciprocal tariffs, what is the impact?

 This week, the Trump administration launched an unexpectedly aggressive tariff policy, triggering severe fluctuations in global markets. U.S. stocks faced the worst sell-off since 2020, with the S&P 500 plummeting 10% over two days, and commodities collapsing simultaneously, with oil and copper prices dropping more than 10% in a week, showing significant differentiation in safe-haven assets. The increase in tariffs far exceeded expectations, primarily targeting Asian economies, with clear political intentions that may provoke countermeasures from China and Europe, extending the duration of the game of chess.
++4 Alpha Core Insights:++
1. Market Performance Review
- US Stocks Plummet: The S&P fell 10% over two days, VIX surged past 40, and US stocks entered a technical bear market, with extreme panic in the market.
- Divergence in Safe-Haven Assets: US Treasury yields plummeted, gold rose sharply before retreating, and the dollar index weakened.
- Commodity Market Crash: Crude oil, copper, and other commodities saw significant declines, reflecting a pessimistic outlook for global demand.
- Bitcoin Exhibits "Dual Attributes": Initially boosted by the dollar credit crisis, it later fell due to global risk asset panic, showcasing the complexity of being "safe-haven + liquidity-sensitive."
2. Analysis of Trump's Tariffs
- Stronger than Expected: Traditional allies set a "minimum threshold" of around 10%, while Asian countries faced tariffs as high as 25-54%, and the EU was also hit with a 20% tariff.
- Political Logic Over Economic Logic: Building legitimacy, increasing fiscal revenue to pave the way for tax cuts; enhancing negotiation leverage, increasing pressure for manufacturing to return.
- The tariff strategy is blunt but leaves room for negotiation, as countries like South Korea and Japan actively negotiate for lower tariffs.
- The biggest risk variable is the countermeasures from China and the EU, especially as China has already implemented countermeasures, potentially dragging the situation into a long-term game.
3. Analysis of Non-Farm Employment Data
- Surface stability, structural weakness: The official unemployment rate is 2%, but U6 is as high as 7.9%, and has risen for two consecutive months.
- Employment growth has been revised down, and part-time positions have decreased. Average hourly wage growth has slowed, and labor participation remains persistently low.
- There are artificial distortions in data statistics, indicating a decline in job quality.
4. Analysis of Liquidity and Interest Rates
- SOFR forward rates have clearly declined, indicating market expectations for the Fed to cut rates sooner.
- The 2Y and 10Y US Treasury yields both plummeted, indicating a market-wide shift to a "pricing recession" mode.
- Powell's remarks were cautious, acknowledging stagflation risks but still not signaling easing, leaving policy in a wait-and-see phase.
5. Outlook and Recommendations for Next Week
Risk Factors:
- High uncertainty over tariff retaliation, especially whether China and the EU will retaliate further;
- Economic data "lagging response + data void" exacerbating policy and market games;
- Market lacks a "priceable policy path", with extremely high structural vulnerabilities.
Market Pricing Logic Has Changed:
- From "inflation pressure" to "high inflation + high tariffs → suppressed demand → early recession";
- US Treasury yields and risk asset volatility jointly confirm "pessimistic expectations + seeking policy bottom."
Recommendations:
- Maintain a neutral stance, cautiously responding to market volatility;
- Bitcoin has long-term potential as a "dollar liquidity proxy", and will benefit again if the Fed initiates easing;
- Control leverage in the short term, waiting for policy easing and confirmation of market bottom signals.
What is the impact of the reciprocal tariffs?
1. Macroeconomic Review of This Week
1. Market Overview
This week, Trump's reciprocal tariffs were implemented, far exceeding market expectations, leading to a global risk asset crash.
US Stocks: The S&P 500 index fell 10% over two days, marking the largest drop since March 2020; the Dow Jones dropped 7.6% for the week, and the Nasdaq entered a bear market (down 22% from December highs). The semiconductor ETF (SOXX) plummeted 16% in a week, its worst performance since 2001. The VIX index soared above 40, reflecting peak short-term market panic.
Safe-Haven Assets: The 10-year Treasury yield fell 32 basis points to 3.93%, a new low since September 2022; spot gold rose to $3,023/ounce before retreating, down 1.7% for the week; the dollar index fell 1.1% for the week.
Commodities: Brent crude oil plummeted 10.4% to $61.8/barrel, resonating with OPEC+ production increases and demand concerns. Copper prices fell 13.9%, marking the largest weekly drop since July 2022; iron ore fell 3.1%.
Cryptocurrency: Bitcoin briefly diverged from US stocks this week; following the reciprocal tariffs, US stocks crashed while Bitcoin rose, but it fell again after China announced countermeasures, though its overall decline was less severe than that of the US. This reflects the dual nature of Bitcoin as both a safe haven and a risk asset.
Under the impact of tariffs, Bitcoin vividly demonstrated its intertwined safe-haven and risk attributes. When the reciprocal tariffs were implemented, Trump's tariffs raised concerns about the credibility of the global fiat currency system, activating Bitcoin's role as "digital gold." However, after China's 34% counter-tariff was announced, panic over global supply chain disruptions ensued, with the VIX index breaking 45, leading to indiscriminate selling of all risk assets. Bitcoin's performance in this crisis reveals its essence as a contradictory composite in the digital age: constrained by the liquidity shackles of traditional risk assets while carrying a revolutionary vision to disrupt the fiat currency system.
2. Economic Data Analysis
This week's data analysis focused mainly on Trump's tariffs and non-farm data.
2.1 Analysis of Trump's Tariffs
Although the market had anticipated Trump's reciprocal tariffs, the extent and scope of the tariffs announced on April 2 far exceeded expectations.
In terms of content, Trump's reciprocal tariffs are mainly divided into two parts:
*
##### The US sets a minimum benchmark tariff of around 10% for its traditional trade partners, such as the Five Eyes Alliance (UK, Australia, New Zealand). Notably, the tariff rates for these countries are also around 10%. This portion of tariffs generally aligns with market expectations.
*
##### Higher tariffs are imposed on specific countries and regions, primarily in Asia. China faces an additional 34% (combined with the already imposed 20%, totaling 54%), Indonesia 32%, Vietnam 46%, Thailand 36%, South Korea 25%, and Japan 24%. Additionally, the EU has increased tariffs by 20%.
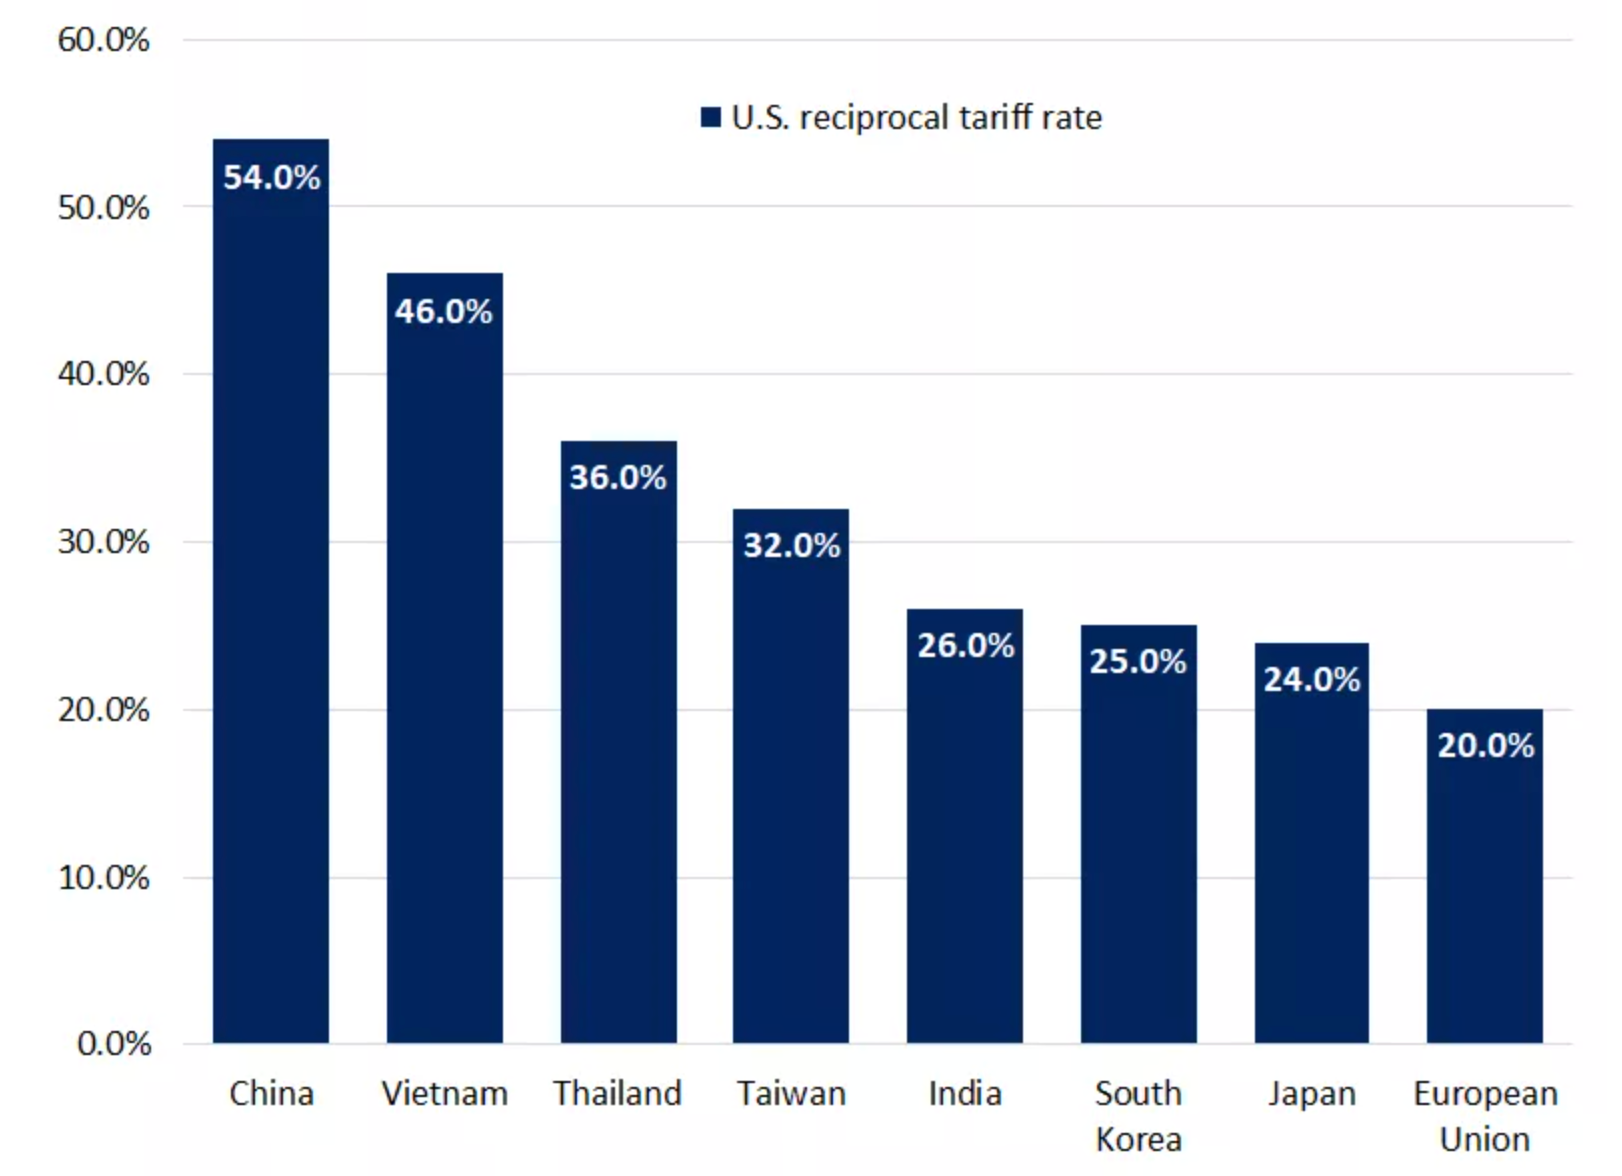
Chart: US Reciprocal Tariff Situation Source: The White House
In fact, "reciprocal tariffs" is not a precise economic concept; in Trump's political narrative, it is a core means to balance trade deficits and an important negotiation tool. Further analysis of its political objectives reveals two main effects of Trump's tariffs:
Building Legitimacy and Gaining Congressional Support: On one hand, Trump cloaks high tariffs in the guise of "fairness," winning public support in Midwestern manufacturing states; on the other hand, the revenue from tariffs will indeed increase US fiscal revenue, which will be very beneficial for his subsequent tax cuts and deregulation measures, especially in gaining Congressional support.
Negotiation Leverage and Accelerating Manufacturing Return: Creating uncertainty in advance, lowering optimistic expectations for 2025 exports from China and European exporting countries; extreme pressure to force global manufacturing leaders to accelerate localization in North America.
At a deeper level, the essence is that Trump is reconstructing the distribution of interests domestically and internationally by creating a "controllable crisis," transforming short-term economic costs into long-term political capital.
From the specific actions taken by Trump regarding tariffs, another characteristic of these tariffs is that they are simple and blunt while leaving room for negotiation. The tariff rates imposed on specific countries/regions are primarily calculated based on trade deficits; additionally, in terms of implementation timing, other countries have been given some time, as South Korea, Japan, Vietnam, and others have actively accelerated negotiations with the US to lower tariffs in pursuit of equal tariff reductions.
The only aspect that requires special attention is the countermeasures from China and the EU. Given that China took reciprocal measures last Friday and maintained a firm stance, it is expected that the game between China and the US will significantly prolong.
After the tariffs were announced, risk assets fell sharply, and the risk market began to price in future recession risks, with the current number of expected rate cuts for the year reaching four.
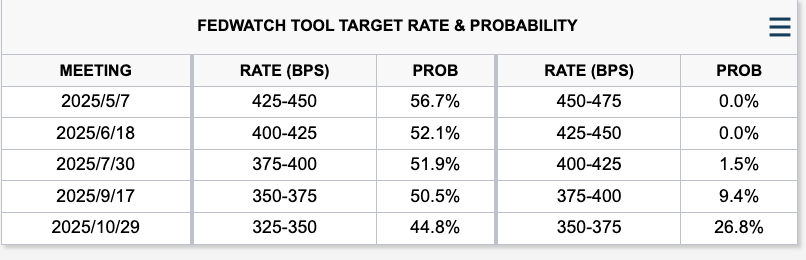
Chart: Interest Rate Market's Expectations for Rate Cuts This Year Source: The White House
2.2 Non-Farm Data
As we previously assessed, although the total data shows that non-farm employment appears relatively stable, further analysis reveals that this is not the case. Most macro research currently falls into an illusion: believing that the job market remains strong, thus inflation decline will naturally continue. However, we note that the quality of employment is diverging from the superficial strength of the data.

Chart: US March Non-Farm Employment Data Source: MishTalk
Key structural data is as follows:
1) The official unemployment rate is 4.2%; the U6 rate is higher at 7.9%.
2) The change in non-farm employment total for January was revised down by 14,000; the change for February was revised down by 34,000; after these revisions, the total employment numbers for January and February are 48,000 lower than previously reported.
3) The unemployment rate has risen for the second consecutive month. With the increase in government layoffs, the unemployment rate is expected to rise further.
4) The average hourly wage increase for all non-farm workers is 8%. The average hourly wage increase for production and non-management workers is 3.9%, with overall growth continuing to slow.
5) The labor participation rate remains low at 5%; part-time employment decreased by 44,000, while full-time employment rebounded by 459,000 (partially correcting last month's 1.22 million drop).
It is important to note that in the US Department of Labor's statistics, as long as you work for one hour, you are considered employed. If you are not working and not looking for work, you are not counted as unemployed but rather as having exited the labor market; searching for job vacancies in recruitment ads does not count as "looking for work"; you need to participate in actual interviews or send resumes to be included in the employment population. In reality, these distortions artificially lower the unemployment rate, artificially increase full-time employment, and artificially inflate the monthly wage employment report.
Although the data cannot deny the basic robustness of the US labor market, the structural outlook is not optimistic. The market's expectation of a "comprehensive cooling" has not yet arrived, but signs of deterioration are accumulating.
3. Liquidity and Interest Rates
From the perspective of the Fed's balance sheet, this week the Fed's broad liquidity continued to hover around $6.1 trillion. From the perspective of interest rates and the Treasury market, we find that market expectations have undergone drastic adjustments since March.

Chart: Changes in US Overnight Financing Rates and Treasury Yields Source: Wind
As shown in the chart above:
1) The 12-month SOFR rate (light orange line): This reflects the market's expectations for the Fed's interest rate level over the next year. The data has clearly declined, diverging more from the current SOFR rate, dropping from about 4.3% to below 4.0%, indicating that the market is re-pricing: the Fed is more likely to cut rates sooner or maintain easing for longer.
2) The 2-year Treasury yield (green) and the 10-year Treasury yield (blue) both fell rapidly, currently both below 4.0%, with the 10-year nearing 3.8%. This indicates that the market has reached a consensus on a shift to easing in the short-term policy path (reflected in the 2Y) and has significantly downgraded expectations for long-term economic growth and inflation (reflected in the 10Y). The market has overall entered a "pricing recession" phase, believing that interest rates are no longer the core risk, but rather that the economy itself is in trouble.
Overall, Trump's "reciprocal tariffs" speech has intensified the market's pricing of stagflation risks, and the main logic of the market has shifted to: high inflation + increased tariffs → suppressed demand → early recession → the Fed may be forced to cut rates sooner.
Additionally, Powell's remarks this week attracted significant market attention; however, from his statements, the Fed is deeply mired in a policy dilemma under stagflation. Powell's stance was generally cautious, acknowledging the "stagflation dilemma of rising unemployment and inflation risks," emphasizing the need to wait for clearer data and not adjusting the policy stance for now. Although the market is pricing in a 115 basis point rate cut by the Fed in 2024, with a 35.1% probability of a cut in May; Powell hinted that "wait-and-see" remains the main tone.
2. Macroeconomic Outlook for Next Week
For global assets, the current situation is a typical period of rising structural uncertainty: it is not that the market lacks liquidity, but rather that it lacks a "priceable policy path." The main risk points facing the market revolve around the following three aspects:
1) Tariff Retaliation: With China's countermeasures, it is unclear how the US will respond; additionally, it remains uncertain whether the EU and Asian economies will have retaliatory measures.
2) Economic Data: Current market concerns about recession are increasing; if tariff retaliation escalates, soft economic data may further suppress market risk appetite, but at the same time, the lagging nature of hard economic data complicates the Fed's decision-making, potentially prolonging market volatility.
Based on the conclusions from the interest rate market, risk market, and economic data, we believe the market remains in an extremely fragile state. In the vacuum period where data cannot falsify, the market lacks strong upward momentum. However, it is also important to note that according to members of Trump's cabinet, the current tariffs are already at the highest limit, and subsequent negotiations may gradually establish a policy bottom for the market.
Based on the aforementioned analysis, our overall view is:
*
##### The current trading benchmark is: high inflation combined with tariff shocks leading to a re-pricing of global recession expectations.
*
##### The synchronous decline in US Treasury yields (especially the sharp drop in SOFR forward rates) clearly reflects "opening of policy space + enhanced macro pessimistic expectations"; the significant volatility in risk assets (US stocks, raw materials) reveals a severe lack of confidence in "priceable futures"; alternative assets like gold and Bitcoin, while possessing safe-haven logic, remain constrained by liquidity and cannot independently strengthen, reflecting that structural risks have not been cleared.
*
##### For cryptocurrencies, Bitcoin's dual characteristics of "safe-haven vs liquidity sensitivity" were fully exposed during this tariff crisis; if the Fed is forced to ease quickly, BTC may again be viewed by funds as a "dollar liquidity proxy asset"; we recommend maintaining a neutral stance, controlling leverage, and being cautious of short-term market volatility.
Key Macroeconomic Data for Next Week:
|-----------|-----------------|-----| | Time | Data | Importance | | Monday (April 7) | US Treasury Auction | Watch | | Tuesday (April 8) | US March NFIB Small Business Confidence Index | Important | | Wednesday (April 9) | US February Wholesale Sales MoM | Important | | Thursday (April 10) | US March CPI | Important | | Friday (April 11) | US March PPI | General |
Disclaimer
This document is for internal reference only by 4Alpha Group, based on 4Alpha Group's independent research, analysis, and interpretation of existing data. The information contained in this document is not investment advice and does not constitute an offer or invitation for residents of the Hong Kong Special Administrative Region, the United States, Singapore, or other countries or regions where such offers are prohibited to purchase, sell, or subscribe to any financial instruments, securities, or investment products. Readers should conduct their own due diligence and seek professional advice before contacting us or making any investment decisions.
This content is protected by copyright and may not be reproduced, distributed, or transmitted in any form or by any means without the prior written consent of 4Alpha Group. While we strive to ensure the accuracy and reliability of the information provided, we do not guarantee its completeness or timeliness and accept no liability for any loss or damage arising from reliance on this document.
By accessing this document, you acknowledge and agree to the terms of this disclaimer.
All information provided on this website is for reference only. This website does not guarantee the accuracy, validity, timeliness, and completeness of the information. Any actions taken based on the information provided on this website are at the user's own risk.
 Risk warning Risk warning