Is the prediction market a cash cow? A deep dive into its profit model

 Can this outrageous trading volume translate into real income?
Author: Changan, Amelia I Biteye Content Team
In past discussions about prediction markets, people were more concerned about their accuracy, trading volume, and whether they could become new information markets. However, when prediction markets are viewed as a business, the core question becomes: what does the profit model look like?
In the business world, high trading volume does not equate to profitability for the platform. A market can have a huge volume and users can trade frequently, but if most transactions cannot be monetized or if activity is purely maintained through subsidies and points, then trading volume is merely attractive data rather than healthy revenue.
For prediction markets, the true test of business acumen is not "how many markets have been opened," nor is it "how hot a particular event is," but whether the platform can seamlessly connect three things:
Generate genuine trading impulses;
Maintain sufficient depth of order book liquidity;
Convert the trading demand from Takers into Fees.
This is also why the business model of prediction markets is far from simply "opening markets and collecting taxes." On the surface, it appears to be a simple YES / NO betting game, but what truly supports the platform's revenue base is the underlying trading structure, liquidity mechanisms, fee structures, and user behavior.
Especially after the leading platform Polymarket systematically introduced Taker Fees, the narrative of prediction markets has shifted from "information tools" to the "revenue validation" stage.
This article will deeply analyze the underlying cards of prediction markets from a business perspective:
How do prediction market platforms make money?
Why does the Maker / Taker game structure determine the platform's survival?
What are the essential differences in fee designs among mainstream platforms like Polymarket, Kalshi, Opinion, and Predict.fun?
Why is the highest trading volume not necessarily the most profitable track?
💡 Core Conclusion: Prediction markets do not sell answers, but rather divergences.
The closer the price is to 50 / 50, the greater the market divergence, the stronger the trading impulse, and the easier it is for the platform to convert active transactions into fee income; the closer the price is to 0 or 100, the more certain the outcome becomes, and although the informational value remains, the corresponding fee weight will significantly decrease.
Therefore, the real business barrier for prediction markets is not turning "events" into markets, but transforming "divergences" into trades, and then reliably converting those trades into revenue.
I. How Prediction Markets Make Money: Not by Opening Markets, but by Turning Divergences into Fees
To break down the cash flow of prediction markets, we must first clarify its four core revenue drivers. These intertwine to form a closed loop from traffic to monetization for the platform.
1️⃣ Trading Fees - Direct Source of Revenue
Most prediction markets charge the party that actively trades, known as the Taker. This is because Takers consume liquidity while Makers provide it.
This means that not all trades in prediction markets generate revenue. The transactions that truly contribute fees to the platform are often those where users are willing to trade actively and pay for speed and certainty.
2️⃣ Liquidity - Foundation for Continuous Trading
The hardest part of prediction markets is not opening markets, but ensuring those markets have depth.
If a market has no orders, users cannot buy or sell, making it difficult to form effective prices even if the market is trending.
Thus, many platforms lower Maker costs or even incentivize Makers.
This is not a direct "source of revenue," but it determines whether trading fees can exist long-term.
Without liquidity, there can be no continuous trading, and naturally, fee income cannot stabilize.
3️⃣ Informational Value - Mental Occupation
What sets prediction markets apart from ordinary trading platforms is that they are not just trading tools; they also produce information.
When a market has sufficient trading volume and liquidity, its price becomes a probability signal. Media will cite it, KOLs will interpret it, traders will observe it, and ordinary users will use it to gauge market sentiment.
This part may not directly translate into fees, but it brings attention, user mindset, and external dissemination to the platform. In the long run, this informational value will enhance trading demand.
4️⃣ User Operations and Discount Systems - Converting Activity into Revenue
In addition to basic trading fees, different platforms also enhance trading frequency through discounts, invitations, events, points, and rebates. These measures may not directly generate revenue but will affect the platform's long-term monetization capability. For example, Opinion offers user discounts, trading discounts, and referral discounts; Predict.fun adopts a simpler base fee and discount mechanism; Polymarket focuses on differentiated rates and Maker rebates across different tracks. The essence of discounts and incentives is not merely subsidies but exchanging part of the profit for user retention, gradually converting activity into revenue.
II. Horizontal Comparison of Fee Structures Among Mainstream Prediction Market Platforms
Looking at the fee designs of several mainstream prediction markets, the strategic direction of the industry is highly convergent: encouraging order placement to provide liquidity and converting active trades into revenue. However, in tactical execution, different platforms exhibit significant strategic differentiation due to their varying positions.
1️⃣ Polymarket: Refined Pricing by Track
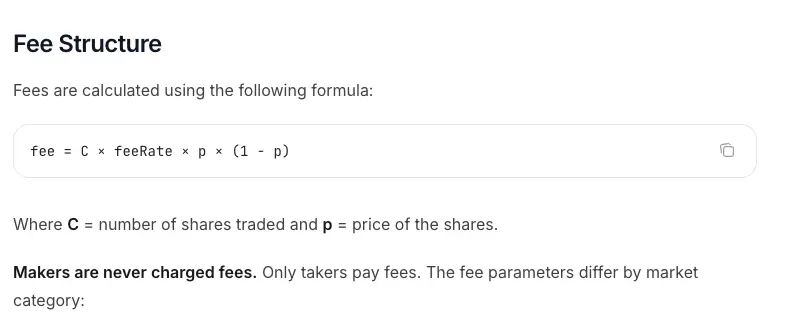
Polymarket's Taker fee logic combines "track differentiation" and "divergence pricing" to the extreme. Its official core formula is:
fee = C × feeRate × p × (1 - p)
where C is the number of shares traded, p is the trading price, and feeRate is determined by the market track.
This mechanism includes two core variables:
Track Refinement: According to the currently verified fee rate, the feeRate for the Crypto track is 0.07, Sports is 0.03, Politics / Finance / Tech is 0.04, and Culture / Weather is 0.05, with some Geopolitics markets being 0. This means that Polymarket does not charge a uniform fee across all markets but adopts differentiated rates based on trading frequency, sensitivity, and user willingness to pay in different tracks.
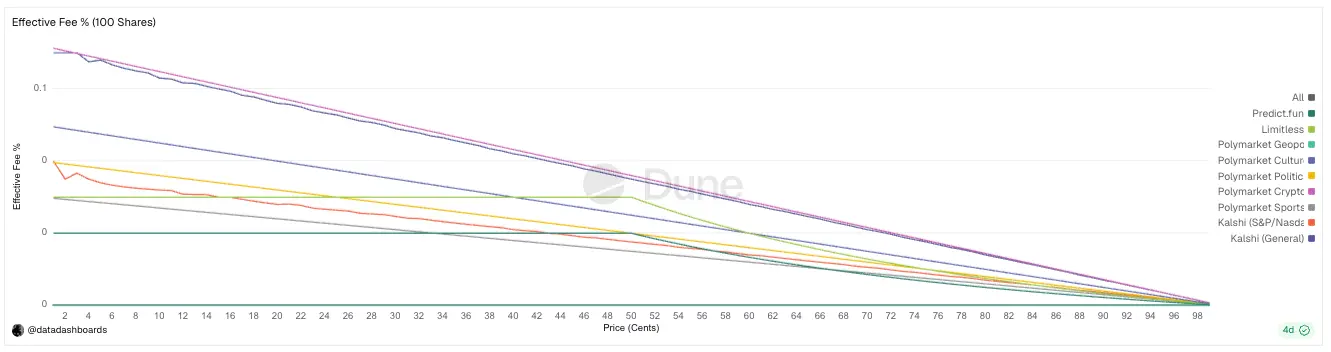
Divergence Pricing: Perfectly aligns with the mathematical curve of p × (1 - p). The closer the price is to 50/50 (the greatest market divergence), the higher the fee; the more certain the outcome (close to 0 or 100), the lower the fee.
2️⃣ Kalshi: Closer to a Compliant Exchange Model
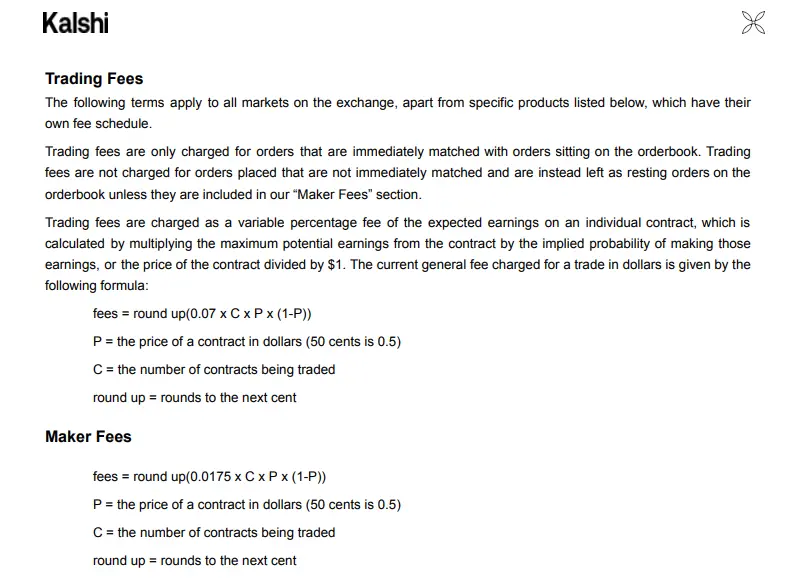
Kalshi's fee design is more aligned with traditional financial derivatives exchanges within a compliant framework, and its regular Taker fee rate formula is also linked to price divergence:
fee = round up(0.07 × C × P × (1 - P))
where C is the number of contracts, P is the contract price, and the fee is rounded up to the nearest cent. This structure is quite similar to Polymarket's C × feeRate × p × (1-p).
Kalshi's fee structure shares similarities with Polymarket: its trading fees are also related to contract prices, with higher fees closer to 50¢ and lower fees closer to 1¢ / 99¢. Kalshi's fee schedule shows that the Taker fee for 100 contracts varies roughly between $0.07 and $1.75.
However, an important distinction between Kalshi and Polymarket is that some markets on Kalshi also have Maker fees, which are only charged when those orders are eventually executed, and there are no fees for canceled orders. This indicates that Kalshi's fee structure is closer to that of a compliant exchange: it is not simply that Makers are permanently free, but rather that more complex bilateral fee rules are set based on different markets.
3️⃣ Opinion: Greater Emphasis on Discounts and User Segmentation
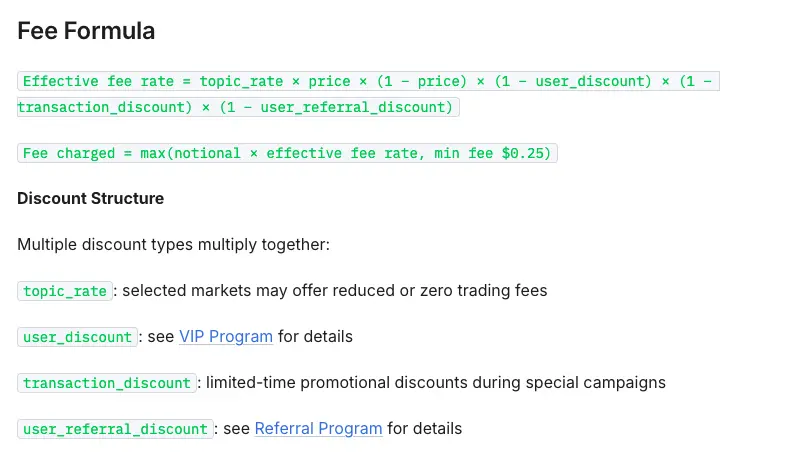
Opinion has introduced a highly complex "multi-dimensional discount system," with its effective fee rate formula being:
Effective fee rate = topicrate × price × (1 − price) × (1 − userdiscount) × (1 − transactiondiscount) × (1 − userreferral_discount)
This means that Opinion's fees depend not only on market prices and topic rates but are also influenced by user discounts, trading discounts, referral discounts, and other factors.
Opinion has also set a minimum order of $5 and a minimum fee of $0.25 to avoid excessively low fees from small transactions.
This indicates that Opinion's fee design leans more towards user operations:
topic_rate is used to differentiate different markets
user_discount is used for user segmentation
Thus, compared to Polymarket's "track differentiation pricing," Opinion is more like turning fees into an operational tool: guiding user trading, retention, and acquisition through the discount system while simultaneously lowering the threshold for order placement through Maker free trades to maintain market liquidity.
4️⃣ Predict.fun: Minimalist Unified Fee Rate
Predict.fun's fee structure is relatively simpler, suitable for reducing user understanding costs.
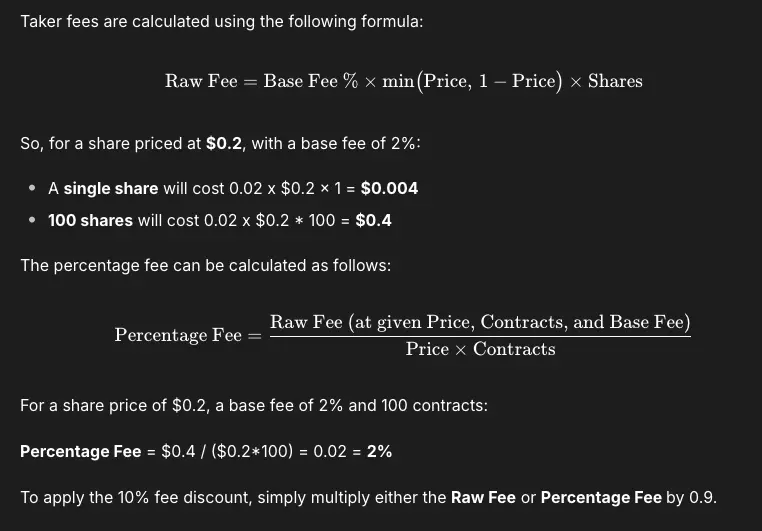
According to its current public standards, its fee calculation formula is:
Raw Fee = Base Fee % × min(Price, 1 − Price) × Shares|
The Base Fee is currently 2%. The actual rate changes with the transaction price: below 50%, the rate is basically fixed at 2%; above 50%, the closer the price is to 1, the lower the actual rate.
Additionally, Predict.fun supports fee discounts, which further reduce fees after discounts. This design is characterized by being more intuitive: users do not need to determine which side of the market they belong to; they only need to focus on the transaction price itself to understand fee changes.
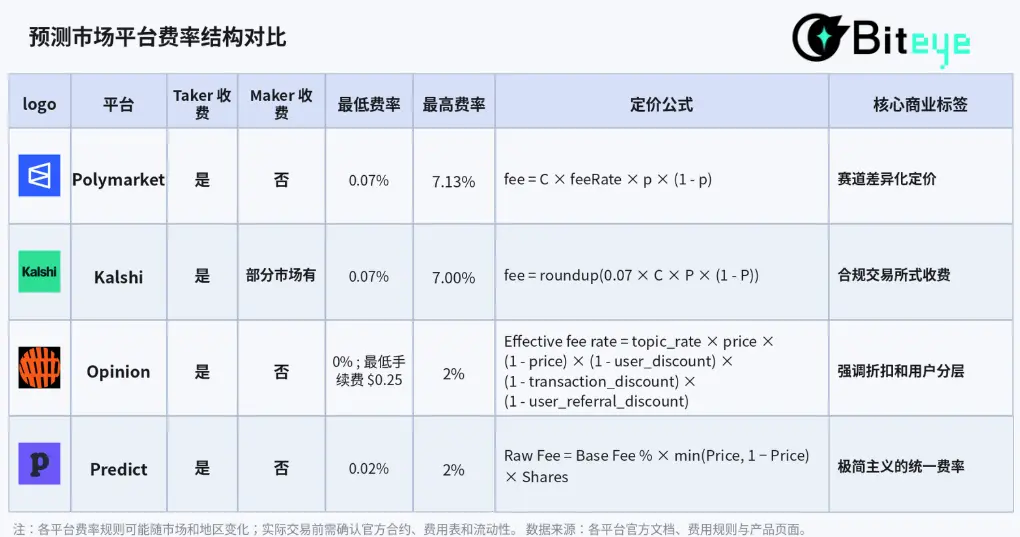
If we only look at the high and low fee rates of different platforms, we can get the following comparison:
Polymarket: highest rate is 7.13%, lowest is 0.07%
Kalshi: highest rate is 7%, lowest is 0.07%
Opinion: fee range is 0% to 2%, with an additional minimum fee of $0.25
Predict.fun: highest rate is 2%, lowest is 0.02%
However, these numbers only indicate the differences in "fee design" and cannot be directly equated to how much the platform can ultimately earn.
Because actual Fees will also be influenced by several factors: which trades are Taker transactions, where the transactions are concentrated in price ranges, whether the platform has discounts, rebates, or minimum fees, and the trading frequency of different tracks themselves.
Therefore, when comparing the commercialization capabilities of prediction markets, we cannot just look at the fee rate tables; we must also consider the trading structure.
Next, we will use Polymarket as an example to further analyze: why, despite having the same trading volume, some tracks are easier to convert into Fees while others may not be the most profitable.
III. In-Depth Analysis of Polymarket: Trading Volume Does Not Equal Real Revenue
Although various platforms have diverse approaches, to validate the real monetization efficiency of prediction markets, Polymarket remains the most suitable platform sample for observation.
There are two main reasons:
Its fee path is the clearest: from testing in Crypto to expanding into Sports, and then to almost comprehensive charging across more categories.
Its data is also more complete: official fee rates and 7D / 30D Fees can be used to further break down revenue structures.
So next, we will take Polymarket as an example to answer a more specific question: is the track with the highest trading volume really the most profitable?
3.1 From Free to Charged: Polymarket's Commercialization Timeline
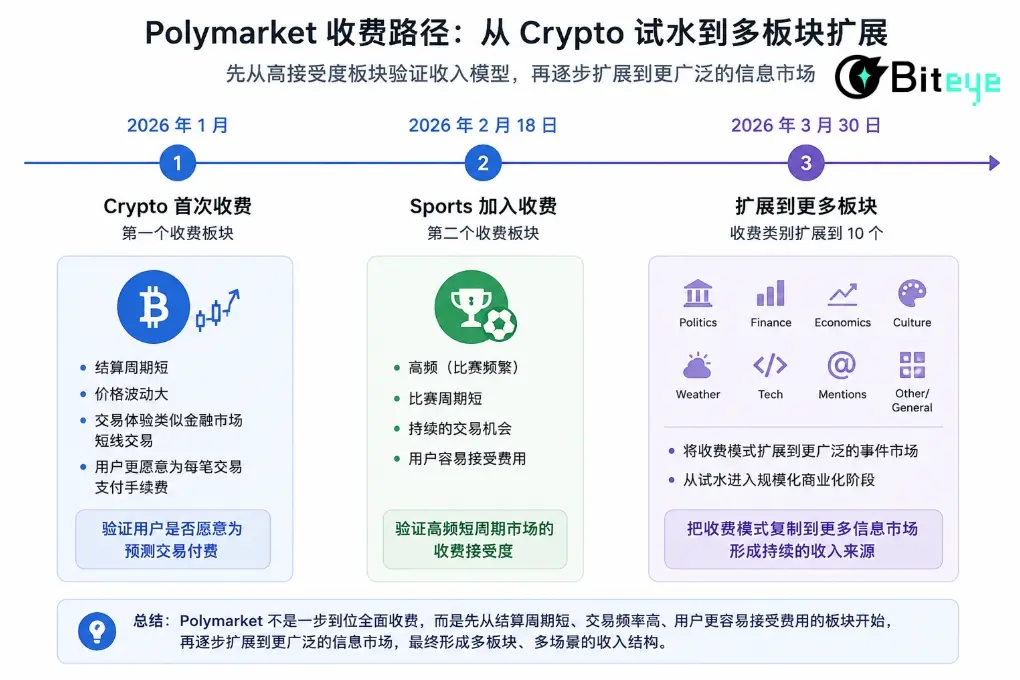
January 2026: Crypto Becomes the First Charged Segment
Polymarket returned to U.S. users, first introducing Taker Fees in the Crypto segment. The settlement cycle for crypto markets is short, price volatility is high, and trading behavior is similar to secondary short-term trading, where users' pursuit of monetization speed far exceeds their sensitivity to friction costs, making it an excellent testing ground for fees.
February 18, 2026: Sports Becomes the Second Charged Segment
Shortly after, on February 18, 2026, the Sports segment became the second charged segment. Sports markets inherently possess high frequency and short cycle characteristics, providing continuous trading scenarios. Therefore, charging for Sports is a natural continuation.
Thus, Polymarket first charged for Crypto and Sports, essentially validating the revenue model in two segments with higher user acceptance.
March 30, 2026: Charging Expands to More Segments
On March 30, 2026, Polymarket expanded Taker fees to Politics, Finance, Economics, Culture, Weather, Tech, Mentions, Other/General, and more categories, increasing the number of charged categories to 10.
After comprehensive charging, Polymarket did not simply charge the same fee across all segments but adopted a more refined fee structure. This step can be seen as a key node in Polymarket's commercialization, as it began to expand its charging model to a broader market.
The effectiveness of comprehensive charging is remarkable. According to the latest data, Polymarket has demonstrated significant revenue-generating capability: 7D Fees reached $9.27M, and 30D Fees reached $36.3M. Its 7-day revenue has entered the top six among all crypto projects, officially entering the revenue-generating project tier.
3.2 Breakdown of Core Track Types and Price Distribution
To calculate the real revenue of each segment on Polymarket as accurately as possible, we estimated the fees for five major tracks based on Polymarket trading data from 2021 to February 2026.
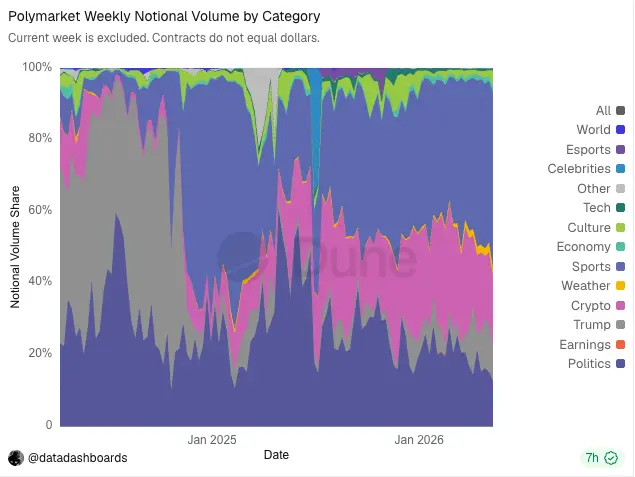
From the perspective of market order proportions, there are significant differences among the five tracks:
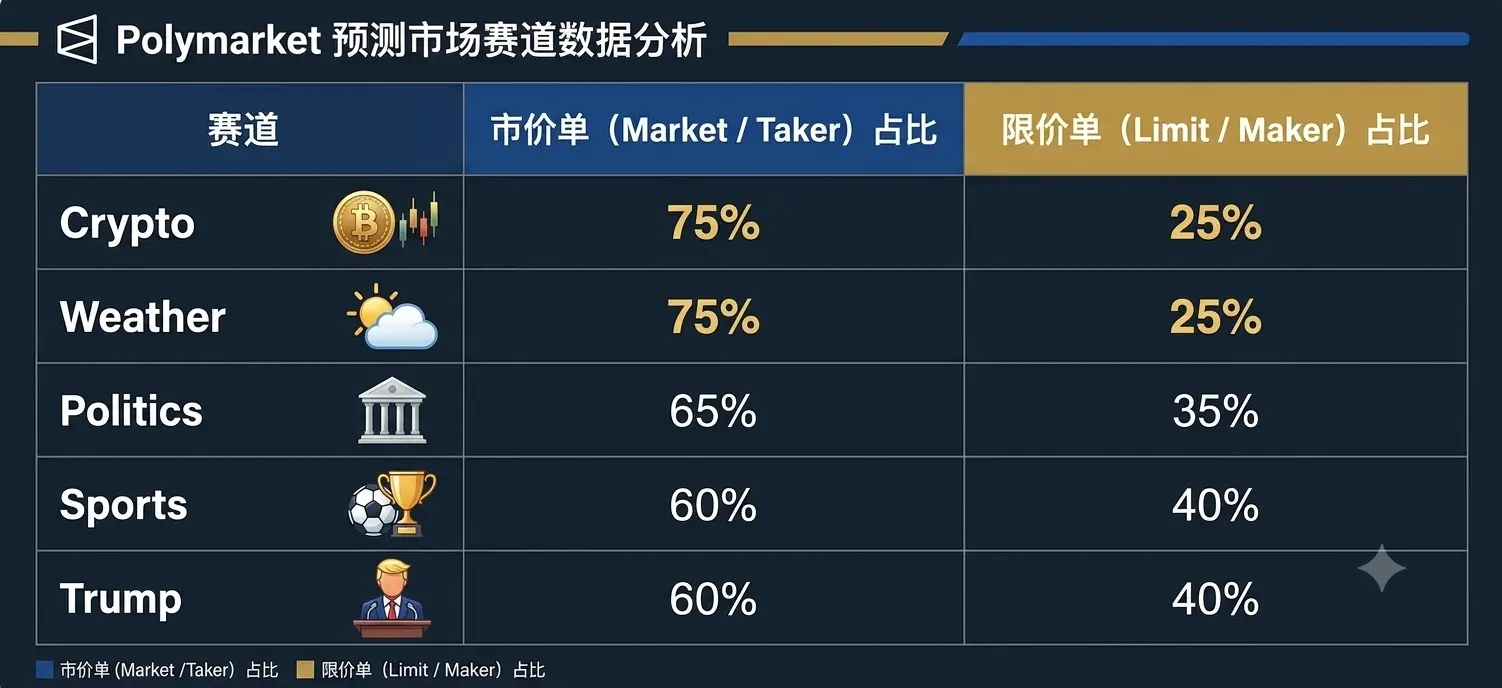
Crypto has the highest market order proportion at 75%, which aligns perfectly with the "rapidly changing" characteristics of crypto assets, as users prefer to lock in profits and losses directly with market orders; the Weather track is similarly driven by real-time sudden weather data, where users also highly value response speed.
Moreover, the amount of fees heavily depends on the price range of the market orders.
The reason is that trades entering the fee structure do not generate the same fees. Polymarket's fees are related to p × (1 - p), where the closer the price is to 50/50, the greater the market divergence, and the higher the fee weight; the closer the price is to 0% or 100%, the more certain the outcome, and the lower the fee weight.
From the data of the five major tracks, most transactions are concentrated in the 30-50 range, especially in the 40-50 range:
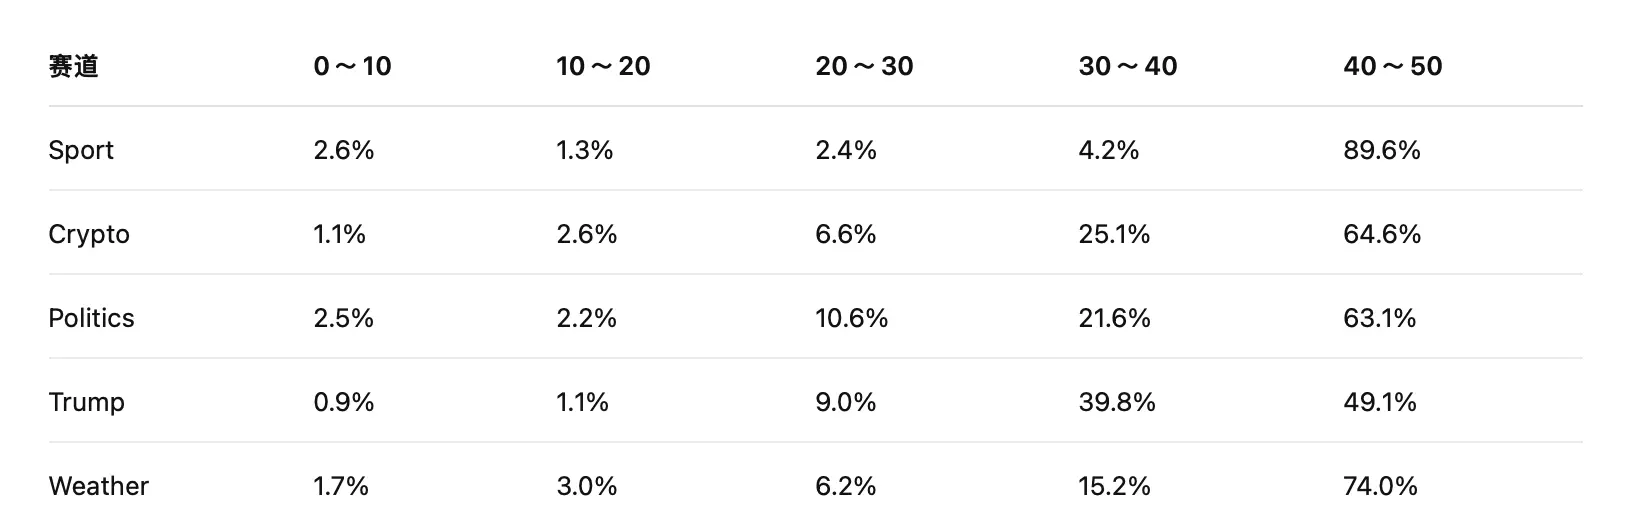
This data indicates that the main transactions on Polymarket do not occur in ranges where the outcomes are already close to certainty, but rather in positions where there is still significant market divergence.
3.3 Revenue Estimation: Who is the Profit Cow?
We used the market transaction volume of each track, combined with the corresponding fee rates, and then estimated the fee revenue for Polymarket in the five tracks according to the weight of p × (1-p) in different price ranges. At the same time, considering that after the introduction of fees, some users sensitive to rates may shift from Taker to Limit orders. Particularly, users engaged in end-of-day trading, low-odds arbitrage, or frequent short-term trading will be more cautious in calculating their return rates.
Therefore, we can make a more conservative assumption based on the original estimates: assuming that after charging, the market order transaction volume in each track decreases by 20%.
The adjusted formula becomes: adjusted estimated fees ≈ Market transaction volume × 80% × feeRate × (1 - p)
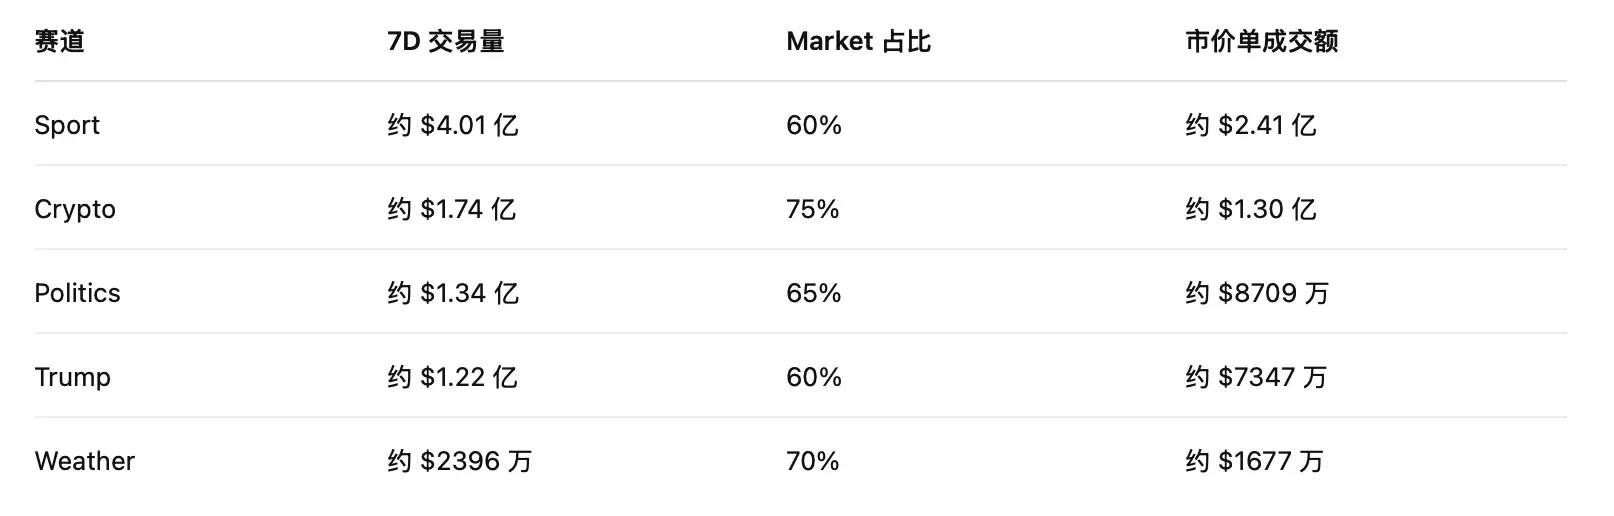
Based on the 7D total trading volume and the trading volume proportions of each track, we estimated the 7D market order trading volume for the five major tracks.
We have already calculated the market order transaction volume for each track; next, we will combine the fee rates and price range weights of each track to estimate the fees. To make the calculation more robust, we use the median of the range as the approximate price:
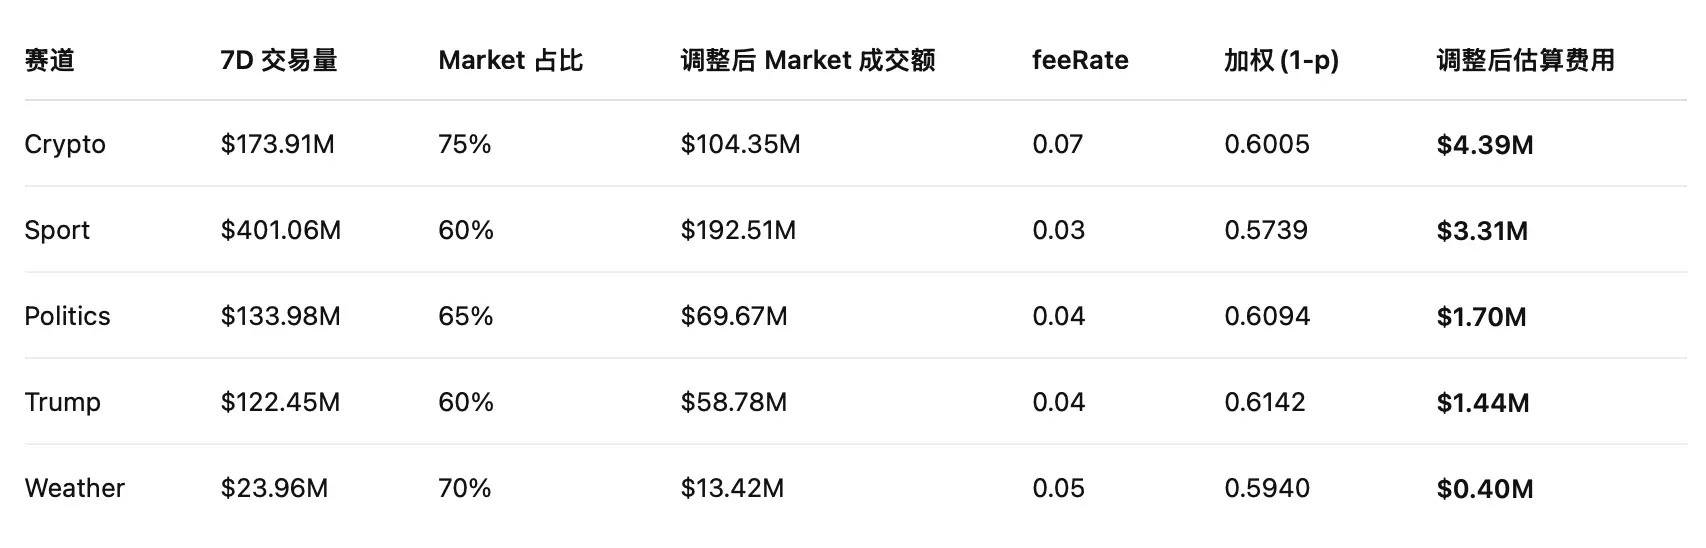
(Note: Due to statistical criteria, historical order type proportion lag, and dynamic changes in tracks, this estimation model aims to restore the contribution ratio of each track, and the total may have reasonable discrepancies with the actual total fees settled by the system.)
What Does the Data Indicate?
1️⃣ Crypto is currently the highest profit-contributing track, with an estimated 7D fee of about $4.39 million, making it the "profit cow."
This is somewhat counterintuitive because, in terms of trading volume proportion, Sports is the largest track, with a 7D trading volume of about $401 million, higher than Crypto's $174 million. However, in terms of fee results, Crypto ranks first, mainly for two reasons:
Higher market order proportion: Market orders account for about 75%, significantly higher than Sports' 60%. Polymarket primarily charges for market orders, so Crypto has more transactions entering the fee structure.
Highest fee rate: The fee rate is 0.07, while Sports is only 0.03. Even if both have the same market order transaction volume, the fees generated per unit transaction in Crypto will be significantly higher.
2️⃣ Sports is the second-largest source of fees, with an estimated 7D fee of about $3.31 million, serving as the "volume foundation."
Sports' advantage lies in its sufficient trading volume. Its 7D trading volume is about $401 million, ranking first among the five tracks. However, its shortcoming is also evident: it has the lowest fee rate, only 0.03.
3️⃣ If Politics and Trump are combined into political markets, the estimated 7D fee would be about $3.14 million, very close to the Sports segment, acting as a pulse-driven traffic funnel.
Political markets are characterized by strong event-driven dynamics. They do not have the stable daily events of Sports nor the continuous price fluctuations of Crypto, but once elections, polls, policy changes, or candidate statements occur, concentrated trading is likely to happen. Therefore, although the trading rhythm of political markets may not be stable, their fee contributions during hot cycles can be quite substantial.
4️⃣ Weather's estimated 7D fee is about $400,000, the lowest among the five tracks.
Thus, Polymarket's revenue structure can be simply summarized as: Crypto drives platform revenue, Sports drives trading volume, and Politics / Trump drives hot event bursts for user acquisition.
IV. Four Final Judgments on Prediction Market Tracks from Polymarket's Perspective
Polymarket's successful closed loop has brought reconstruction insights to the entire prediction market track:
1️⃣ Comprehensive Overhaul of Evaluation Metrics
In the past, prediction markets focused on trading volume and trending topics. As we enter the commercialization era, the metrics for measuring success will completely shift to: real Fees, Taker proportions, order book depth, and bid-ask spreads. Purely relying on trading volumes generated by left-hand to right-hand transactions will be difficult to sustain under a fee mechanism.
2️⃣ Different Event Types Correspond to Different Revenue Roles
Future prediction market platforms will not rely on a single type of market to dominate but will move towards refined division of labor.
Markets like Crypto are closer to financial trading, with fast price changes and short feedback cycles, making users more sensitive to transaction speed, thus easier to achieve high revenue efficiency.
Sports resemble stable cash flows, with frequent matches, clear outcomes, and continuous trading scenarios, making them suitable for contributing daily trading volume.
Markets like Politics / Trump are more event-driven; they may not be stable during normal times, but once key nodes like elections, polls, or policy changes occur, they can easily see concentrated volume.
Markets like Weather indicate that as long as events are sufficiently standardized and outcomes are clear, even if the scale is temporarily small, there is an opportunity to form their own trading scenarios.
3️⃣ Fee Mechanisms Will Reverse Pressure Market Quality
During the free phase, platforms can open many markets; after charging, users and market makers will begin to calculate costs carefully, and the fee mechanism will filter market quality.
A good prediction market needs not only interesting topics but also to meet several conditions simultaneously:
Clear outcomes for easy settlement
Frequent information updates to bring price changes
Sufficient market divergence to motivate user trading
Good liquidity to encourage users to trade actively
Outcomes that are not easily manipulated
4️⃣ The Barrier for Prediction Markets Lies in "Sustained Pricing Power"
Opening a YES / NO market is not difficult; the challenge lies in keeping that market continuously active with orders, trades, price updates, and risk-takers. Only when a market has sufficient depth and trading frequency does its price hold reference significance, and the platform can potentially earn revenue from it.
Thus, the true barrier for prediction markets is not "who can discover hot topics faster," but rather: turning hot topics into tradable markets 👉 ensuring the market has long-term liquidity 👉 making prices signals that the external world is willing to reference.
V. Final Thoughts
There are countless projects capable of grand narratives, but very few can translate those narratives into real monetary income.
Polymarket was once the most glamorous representative of traffic in the entire track, and as it completes the transition from "traffic narrative" to "systematic revenue generation," it aims to prove one thing to the entire industry:
The ultimate value of prediction markets is not limited to "how accurately they predict the future," but in their success in transforming the uncertainties of the real world into a super market that can be standardized, traded frequently, and continuously profitable.
In the past, prediction markets proved they could win massive traffic; now, they are proving themselves to be an unmatched good business.
Disclaimer: All content, data, and opinions contained in this article are for industry communication and research reference only and do not constitute any form of investment advice, legal advice, or basis for business decisions.
1 Estimation Method: Break down the proportion of market orders and limit orders for each track, then estimate the impact of p × (1 - p) on fees according to different transaction price ranges, and finally calculate the approximate contribution of fees from each track based on the corresponding fee rates.
 Risk warning