Unexpected turn to negative! U.S. retail sales in July fell by 0.6% month-on-month, marking the largest decline in over a year
 Core Viewpoint

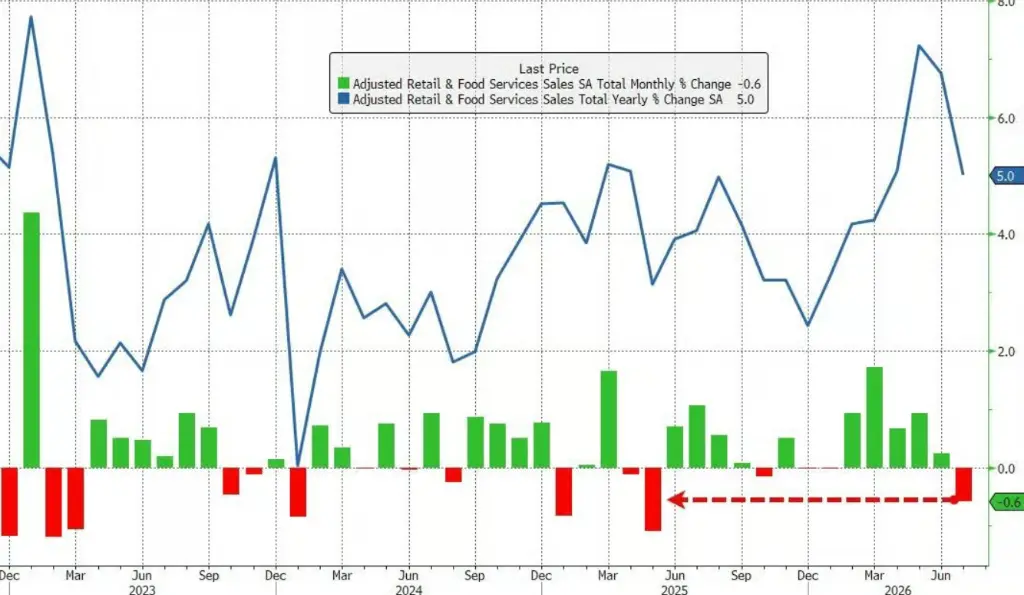
 Retail sales in July fell by 0.6% month-on-month, marking the largest single-month decline since May 2025, and significantly lower than the market expectation of a 0.1% increase. The main factors dragging down the figures were a decrease in automobile purchases and a decline in online retail.
Author: Bu Shuqing, Wall Street Journal
U.S. consumer demand showed a significant cooling in July, with retail sales data falling far below expectations, leading the market to adopt a more cautious view on consumer resilience in the second half of the year.
The U.S. Census Bureau released data on Friday showing that retail sales in July fell by 0.6% month-on-month, marking the largest single-month decline since May 2025, and far below the market expectation of a 0.1% increase. The reduction in automobile purchases and the decline in online retail were the main contributors to this drop.
Excluding automobiles and gasoline, retail sales in July decreased by 0.2% month-on-month, while the expectation was for a 0.3% increase.
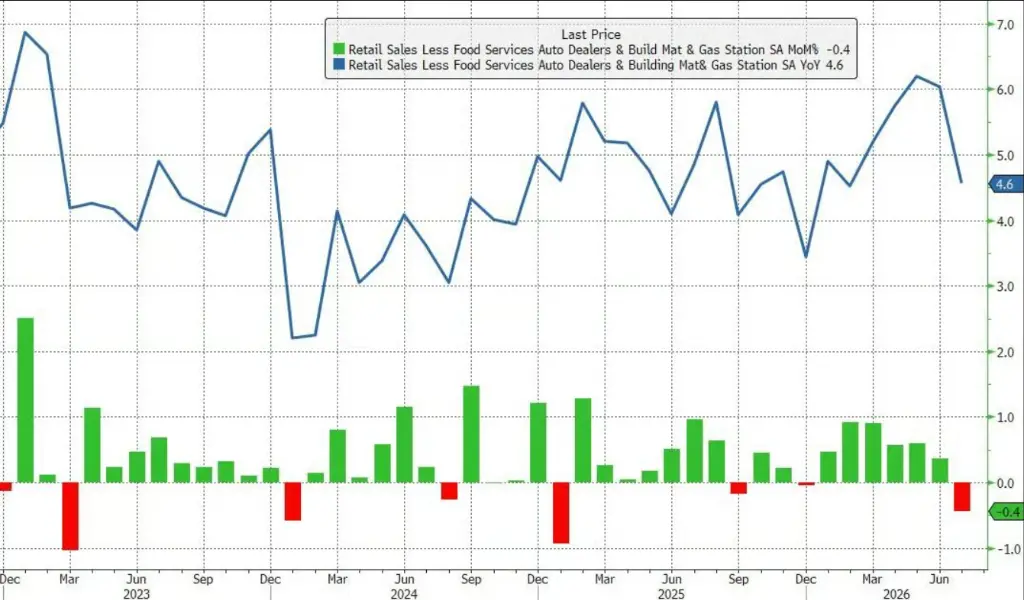
Core retail sales, which are directly related to GDP calculations and viewed as a "barometer" of consumer spending (the "control group" measure), fell by 0.4% month-on-month, also significantly below the expected 0.3% increase.
Following the release of this data, market concerns about the outlook for U.S. consumer spending have intensified. Economists generally point out that the one-time boost effect from excess tax refunds in the first half of 2026 has gradually faded, and the personal savings rate in June has slipped to a four-year low, creating uncertainty about the sustainability of consumer momentum.
Multiple Short-Term Factors Suppress July Consumption
Analysts believe that the unusually weak data for July is partly due to the concentrated release of short-term disruptive factors.
According to Bank of America analysts' previous predictions, this year's Prime Day and related promotional activities were moved from July to June, resulting in a significant pull-forward of online retail (non-brick-and-mortar) consumption, leading to a noticeable decline in online sales in July.
From the sub-item data, sales of clothing, gasoline (affected by falling oil prices), and furniture all recorded month-on-month negative growth. Additionally, the heatwave around the July 4th Independence Day and the waning consumer enthusiasm after the World Cup are also believed to have had some drag on retail activities that month.
From an annual perspective, retail sales in July still grew by 5.0% year-on-year, maintaining a robust absolute level, but the year-on-year growth rate has slowed compared to previous periods.
"Control Group" Data Drags Down GDP Expectations
Among all sub-indicators, the performance of the "control group" sales data is of the most concern to the market. This indicator excludes automobiles, gasoline, building materials, and food services, and is directly used to calculate personal consumption expenditures, which are then included in GDP calculations, making it a key indicator for measuring the substantive momentum of consumption.
In July, control group sales fell by 0.4% month-on-month, deviating by 0.7 percentage points from the market expectation of a 0.3% increase, representing a significant deviation that may exert downward pressure on GDP growth forecasts for the third quarter.
Bank of America data shows that core retail sales, excluding automobiles and gasoline, fell by 0.2% month-on-month, also below the expected decline of 0.2%—overall, all core indicators displayed a significantly weaker-than-expected trend.
K-Shaped Consumption Divergence Pattern Narrows
It is noteworthy that this round of consumption cooling is not evenly distributed among income groups, reflecting subtle changes in consumption structure.
The latest credit card spending data from Bank of America shows that in the four weeks ending August 1, the year-on-year consumption growth rate of low-income households continued to exceed that of high-income households, marking a clear reversal from the previously sustained K-shaped divergence—where high-income groups had strong consumption while low-income groups faced relative pressure.
Even within discretionary spending categories, this trend holds true and is not solely driven by changes in oil prices. Low-income groups showed robust performance in discretionary spending, while high-income groups experienced a mild cooling. Based on this, Bank of America believes that the K-shaped economic pattern is gradually converging towards a "C-shaped" pattern, where consumption trends across income levels are becoming more aligned.
For the market, this means that some retail sectors that previously relied on consumption driven by high-income groups may face certain growth pressures.
 Risk warning