Tonight, the Federal Reserve's decision is coming, and the probability of an interest rate hike has soared to 94%! What should we understand on FOMC night? How should the four types of strategic ETFs position themselves for the FOMC?

 Based on the official dot plot benchmark released by the Federal Reserve on June 17, there are three key things to understand tonight.
Tonight at 2 AM, the global capital markets will face the most important macro judgment of the month—the Federal Reserve's interest rate meeting. So far, the probability of a 25 basis point rate hike has risen to over 94%, with the federal funds rate range approaching 3.75% to 4.00%. However, whenever such a focal moment of global capital games arrives, investors in the Asian time zone are always at a disadvantage. The resolution at 2 AM and the thrilling game of options strategies during individual stock trading present a high barrier for ordinary traders. How can regular investors use strategic ETFs to leverage the power of professional funds to cope with the uncertainties of this meeting? This article will help you understand the role and historical performance of these strategic targets and clarify the potential market changes that may occur after the resolution.
1. FOMC Meeting: What Three Things Should Ordinary Investors Understand?
Whenever there is a Federal Reserve meeting with an economic projections summary, the market is not really focused on whether there will be a rate hike that night, but rather on the dot plot released alongside the statement. Its official name is the FOMC participants' assessment of appropriate monetary policy. Each dot on the chart represents a participant's judgment of the midpoint of the federal funds rate target range at the end of future years, precise to one-eighth of a percentage point. These dots are released anonymously, so everyone can only see the overall distribution and not who cast which vote.
The reason the dot plot is more important than the decision itself is simple. A single 25 basis point rate hike only changes the cost of funds at one point in time, while the dot plot changes the market's expectations for the entire discount rate curve. In the U.S. stock market, long-duration, high-valuation growth assets are far more sensitive to where rates will settle in the coming years than to whether there will be a hike this month. Therefore, during such meetings, the real market movement often does not occur at the second the statement is released, but rather in the hours or even days after the market reads the dot plot and recalculates the rate path.
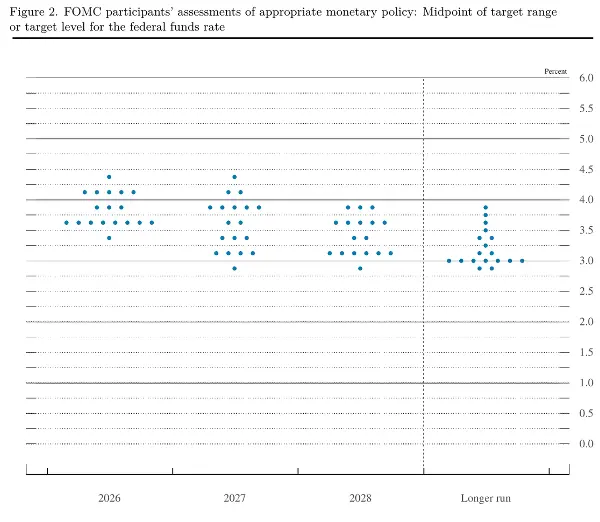
Figure: FOMC participants' assessment of appropriate monetary policy, released on June 17, 2026. Source: Federal Reserve Board Summary of Economic Projections, June 2026, Figure 2.
Referring to the official dot plot benchmark released by the Federal Reserve on June 17, the three things that need to be understood tonight are:
The first thing is to see where the median for the end of 2026 moves on the dot plot. In June, the median forecast from 18 participants was 3.8%, with the densest cluster at around 3.6%, representing a pause after one more hike this year. There are 3 participants near 3.9%, 5 near 4.1%, the highest at 4.4%, and the lowest at 3.4%. If the dot plot remains around 3.8% after this 25 basis point hike, it means most officials prefer to pause and observe after completing the hike, which is a relatively dovish stance, allowing for a pullback in long-term yields. If it moves up to around 4.1%, it indicates a high probability of another 25 basis point hike within the year, which aligns closely with the baseline scenario the market is currently digesting. If it moves further towards the 4.4% level, the most hawkish end from June, the market will need to start seriously trading a more sustained rate hike path. The futures market is currently pricing in two rate hikes before the end of the year, while the June forecast only indicated one; whether the dot plot aligns with the market or remains stationary is itself a clear signal.
The second thing is to observe whether the entire curve for 2027 moves up as well. The median forecast for the end of 2027 in the June dot plot is 3.6%, and for 2028, it is 3.4%, with a long-term center at 3.1%. This layer is actually more critical than a few more hikes this year. If the 2026 forecast is raised but 2027 remains basically unchanged, it indicates that the Federal Reserve is only making a short-term tightening move, pulling the rate hike schedule forward. However, if the entire path for 2027 and even 2028 clearly shifts upward, the market will need to re-trade the new normal of high rates lasting longer. For U.S. stock valuations, the latter has far more destructive power than a single 25 basis point hike, as it changes the long-term center of the discount rate, not just this year's cash cost.
The third thing is to pay attention to whether Warsh will cap this rate hike at the press conference. The dot plot is static, while the press conference is dynamic; the market often interprets the tone of the press conference to set the tone for the dot plot. During this half hour, focus on three things: inflation, oil prices, and the next rate hike. If Warsh emphasizes that future decisions will rely entirely on data and actively lowers market expectations for consecutive rate hikes, this could be interpreted as a dovish hike, meaning the hike occurs but is equivalent to announcing a pause. Conversely, if he continues to emphasize inflation risks, energy prices, and that current policies are still insufficient to curb demand, the market's focus will quickly shift to when the next hike will occur. Against the backdrop of Brent crude oil at $107, any wording he uses regarding energy will be magnified. He has already stated at the August Jackson Hole meeting that recent inflation readings have not yet fully shown a return to the 2% target, combined with three officials voting for a rate hike at the July meeting, the market's psychological expectation of him being hawkish is not low.
2. Market Review: S&P 500 and Nasdaq Overall in a Sideways Trend
The U.S. stock market has been in a sideways state for the past three weeks. The S&P 500 has been oscillating repeatedly within a narrow range of 7,580 to 7,700, which is less than 1.6%, until it broke down last week, dropping to 7,580 on Thursday, then recovering to 7,620 on Friday, closing back near the previous high at 7,656.98. On September 14, it fell again by 0.48% to close at 7,619.95, essentially returning to the starting point. The Nasdaq also did not break out in direction during the same period, falling 0.56% on September 14 to close at 26,186.41. Traditional defensive sectors collectively declined last week, with healthcare down 3.55%, materials down 2.84%, utilities down 1.60%, and consumer staples down 1.42%. The only sector that recorded an increase was energy, up 1.69%. When the reason for the decline is interest rates rather than economic growth, switching to defensive stocks does not work.
There was significant differentiation within the technology sector. On September 14, the semiconductor ETF plunged over 4% in a single day, while software and cybersecurity stocks strengthened against the trend, with CrowdStrike and Palo Alto Networks both recording gains. On the same day, in the same interest rate environment, AI hardware and software moved in completely opposite directions, indicating that even if one sees the big picture correctly, they may still choose the wrong targets.
Volatility is also catching up. The VIX was once at 14.4 at the beginning of the month, the second lowest since December 2025, when the one-month 25-delta downside protection for the S&P 500 fell to its cheapest since December 2024, with skewness at the flattest 1st percentile in the past year, indicating almost no one was buying insurance against declines. Last week, the VIX rose to 15.84, and by September 15, it had returned to 17.96, with a single-day increase of over 5%, indicating that event premiums have only recently been repurchased in the past few trading days.
Putting these factors together creates an unfriendly combination for ordinary investors. The lack of direction in the index makes it easy to get hit whether going long or short, and the defensive sectors no longer resist declines, rendering traditional portfolio adjustments ineffective. The differentiation within sectors lowers the margin for error in stock selection, while the certain event occurs at 2 AM. The options market is pricing in an expected volatility of about ±1.1% for the FOMC night, translating to a range of 2.2%, wider than the entire 1.6% sideways range of the past three weeks. The reason for the existence of strategic ETFs is precisely here; they do not solve the directional judgment problem but improve the distribution of returns for investors when direction is uncertain.
3. When Market Direction is Unclear, How to Understand Four Types of Defensive Strategy ETFs
The most challenging aspect around the FOMC is not simply judging rises and falls, but facing multiple potential evolution paths. The market may maintain high volatility and oscillation, rebound after negative news lands, or experience a significant adjustment, or even drop sharply before surging. In such an environment, the key is to clearly understand which outcome you are most worried about and what cost you are willing to pay for stability.
Scenario 1: Long-term Optimistic about Tech Stocks but Worried about Short-term Volatility ------ QYLG
If you are long-term optimistic about the profit growth of artificial intelligence and large tech companies but believe that short-term valuations are not low and the FOMC may amplify volatility, investors do not need to completely exit the Nasdaq.
At this time, you can choose to continue holding tech stocks while converting some of the short-term upside potential into options income. QYLG is a typical representative of this type of Covered Call ETF. Its underlying is still the Nasdaq 100 index, but it sells call options on about 50% of the stock portfolio. Investors retain a high exposure to the Nasdaq while converting some future upside potential into option premiums in advance.
QYLG is positioned between QQQ and QYLD; QQQ fully participates in the ups and downs of the Nasdaq 100, while QYLD emphasizes options income with a high coverage ratio. QYLG chooses about half coverage to balance growth and income. It is suitable for expressing a long-term optimistic view on technology but believing that a significant one-sided rise is difficult in the short term.
Historical performance shows its boundaries. In 2022, when tech stock valuations compressed, QQQ's maximum drawdown reached 35.12% in November of that year, while QYLG's maximum drawdown was 29.98%, occurring in October. For the entire year, QQQ was -32.58%, while QYLG was -26.27%. The premiums buffered some losses but did not change the essence of its high Nasdaq exposure. Based on the S&P 500, QYLG participated in 91.13% of the declines but only 89.80% of the gains. It can slightly smooth out declines but is not a true downside protection strategy; it will still experience significant drawdowns in a deep bear market and may underperform QQQ in a strong bull market due to call limitations.
Scenario 2: Direction is Hard to Judge, Just Want to Temporarily Reduce Stock Portfolio Volatility ------ DIVO
If you have no strong preference for market direction, do not believe a bear market is imminent, and are uncertain whether tech stocks can surge, but just want to reduce the volatility of your existing high beta or tech positions while remaining in the stock market, DIVO is a representative strategy.
DIVO is an actively managed ETF that employs a strategy of high-quality dividend growth stocks combined with tactical Covered Calls. It does not mechanically replicate an index nor sell calls on the entire portfolio at a fixed ratio. The fund manager first selects about 20 to 25 stocks from large U.S. companies that focus on profitability, cash flow, capital returns, and dividend growth, then tactically sells calls based on valuation, volatility, and short-term stock trends. Its sources of income include capital appreciation, corporate dividends, and options income. This active approach does not require sacrificing the entire portfolio's upside for options income. Stocks with limited upside can sell calls, while those with high potential can be retained.
During the market adjustment in 2022, SPY's maximum drawdown reached 24.50% in October of that year, while DIVO's maximum drawdown was 13.72%, occurring in September. For the entire year, SPY was -18.18%, while DIVO was only -1.46%. During the 2018 adjustment, DIVO's maximum drawdown was 9.64%, with an annualized volatility of about 9.41%, significantly lower than the market. However, the largest drawdown since DIVO's inception occurred in March 2020 during the pandemic shock, reaching 30.04%, while SPY was 33.72% during the same period. This indicates that defensive stock selection combined with tactical calls can reduce the slope of declines but cannot be completely immune in a systemic crash. It is suitable for investors looking to convert high volatility exposure into a stable portfolio while retaining upside opportunities, but the cost is that active stock selection may fail, and the choice of over 20 high-dividend holdings may lag in a very strong bull market.
Scenario 3: Truly Worried About Significant Market Pullbacks ------ BSEP
If you are concerned about a 10% or even larger deep adjustment in the coming months, relying solely on Covered Calls is not enough, as the premiums cannot strip the initial downside risk from the return structure.
At this point, you can explore Buffer ETFs, such as BSEP. BSEP belongs to the Defined Outcome strategy, which references the S&P 500 ETF and sets a specific return structure for a predetermined period through FLEX Options. Taking the first phase starting in September 2026 as an example, the result period is from September 1, 2026, to August 31, 2027, with an initial buffer of 9% and an initial cap of 19.75% (data before fees).
Investors forgo high bull market returns exceeding the cap in exchange for a buffer against the initial downturn. If the S&P 500 ultimately declines by 5% during the complete cycle, the loss falls within the buffer range. If it ultimately declines by 20%, it can be simplified to understand that approximately 9% is buffered, while losses exceeding this range still need to be borne by the investor.
Real bear market data shows that Innovator's 15% buffered product PJUL (referencing SPY), announced in July 2022, fell by 0.80% during the period ending June 2022, while SPY fell by 11.87% during the same period; NJUL, referencing QQQ, fell by 6.76%, while QQQ fell by 20.93%. As a September series, BSEP has a buffer of 9%. Evaluating BSEP should not focus on whether it outperforms the S&P 500 in the long term, but rather on whether the buffer is effective when a downturn occurs. If the market continues to rise significantly, BSEP is likely to lag behind SPY, which is the cost of buying protection. Additionally, the buffer and cap are related to the starting point, and buying in midway requires reference to the remaining values at that time. For example, by September 15, 2026, BSEP has a remaining buffer of 8.53% and a remaining cap of 20.68%.
Scenario Four: Concerned About Downturns but Uncertain When Risks Will Occur ------HELO
If the risk does not occur within the preset one-year period, and investors wish to remain in the stock market long-term while maintaining downside protection, HELO provides a corresponding solution.
HELO is an actively managed Hedged Equity ETF that uses a combination of large-cap U.S. stocks layered with continuously rolling ladder options for hedging. It does not have a fixed one-year buffer but operates multiple sets of hedges with approximately three-month terms, staggered by about one month. After expiration, new protection is established, thereby diversifying the timing risk of establishing protection without needing to precisely predict which month an adjustment will occur.
HELO was established on September 28, 2023, with historical data shorter than DIVO and has not experienced major bear markets in 2008 or 2022. However, during the adjustment period after its listing, it has already shown characteristics of reducing drawdowns, with a maximum drawdown of 3.60% in 2023, 4.16% in 2024, 10.89% in 2025, and 5.76% so far in 2026, with the maximum drawdown since inception being 10.89% in April 2025. Its annualized volatility is approximately 6.89%, with a beta relative to the S&P 500 of about 0.49, and a downside capture rate of approximately 59.11%, meaning it falls about 0.59% for every 1% decline in the market.
This validates its design goal of reducing drawdowns during general adjustment periods, but performance under severe bear markets still requires large sample testing. HELO is suitable for investors who wish to hold stocks long-term while keeping their portfolio continuously hedged, with the cost being the option protection costs and reduced returns during strong bull markets.
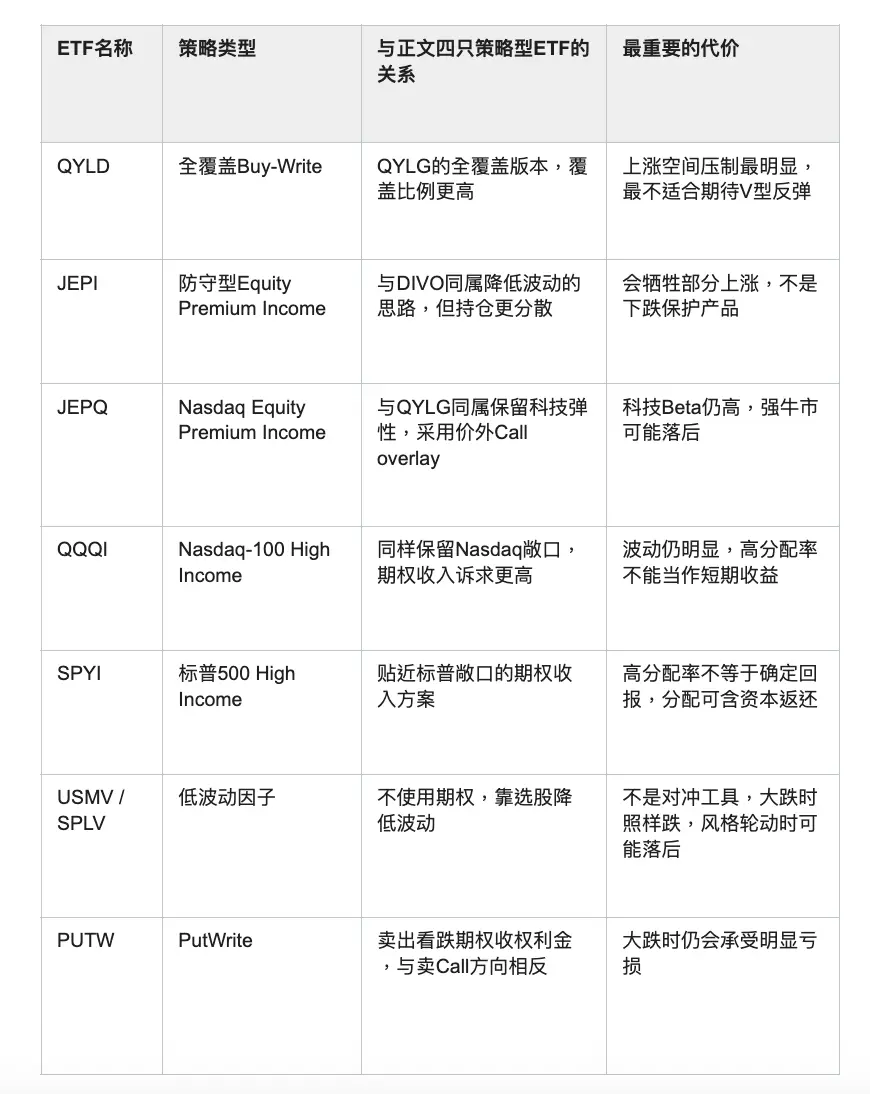
Other related strategy ETF list:
Risk Warning: The market data, Federal Reserve decision expectations, and historical performance of various strategy ETFs mentioned in this article are compiled from public sources for reference only and do not constitute investment advice. Past performance does not guarantee future results, and options and structured products carry risks of expiration, liquidity, and principal loss. Investors should independently assess their risk tolerance and consult professional investment advisors if necessary.
 Risk warning



Popular articles