RootData major upgrade: comprehensive integration of TradFi and Crypto, achieving efficient tracking of tokenized asset data
 Core Viewpoint

 TradFi and Crypto's core metrics are seamlessly integrated on one page, allowing users to view the entire market landscape at a glance and complete comprehensive investment research from the macro perspective to micro assets.
Author: RootData
In 2026, TradFi and Crypto have entered a deep integration phase. Traditional financial assets and crypto assets are frequently linked, tokenized stocks and crypto-native assets are traded on the same exchanges, and traditional capital is flooding in through ETFs and stablecoins. In the face of this complex game across markets, assets, and chains, a single-dimensional data dashboard can no longer meet decision-making needs.
RootData New Homepage officially launched today. This is not just a UI renovation but a structural reconstruction from "fragmented retrieval to panoramic coverage." We seamlessly integrate the core indicators of TradFi and Crypto on one page, allowing users to view the entire market landscape at a glance and complete comprehensive investment research from macro perspectives to micro assets.
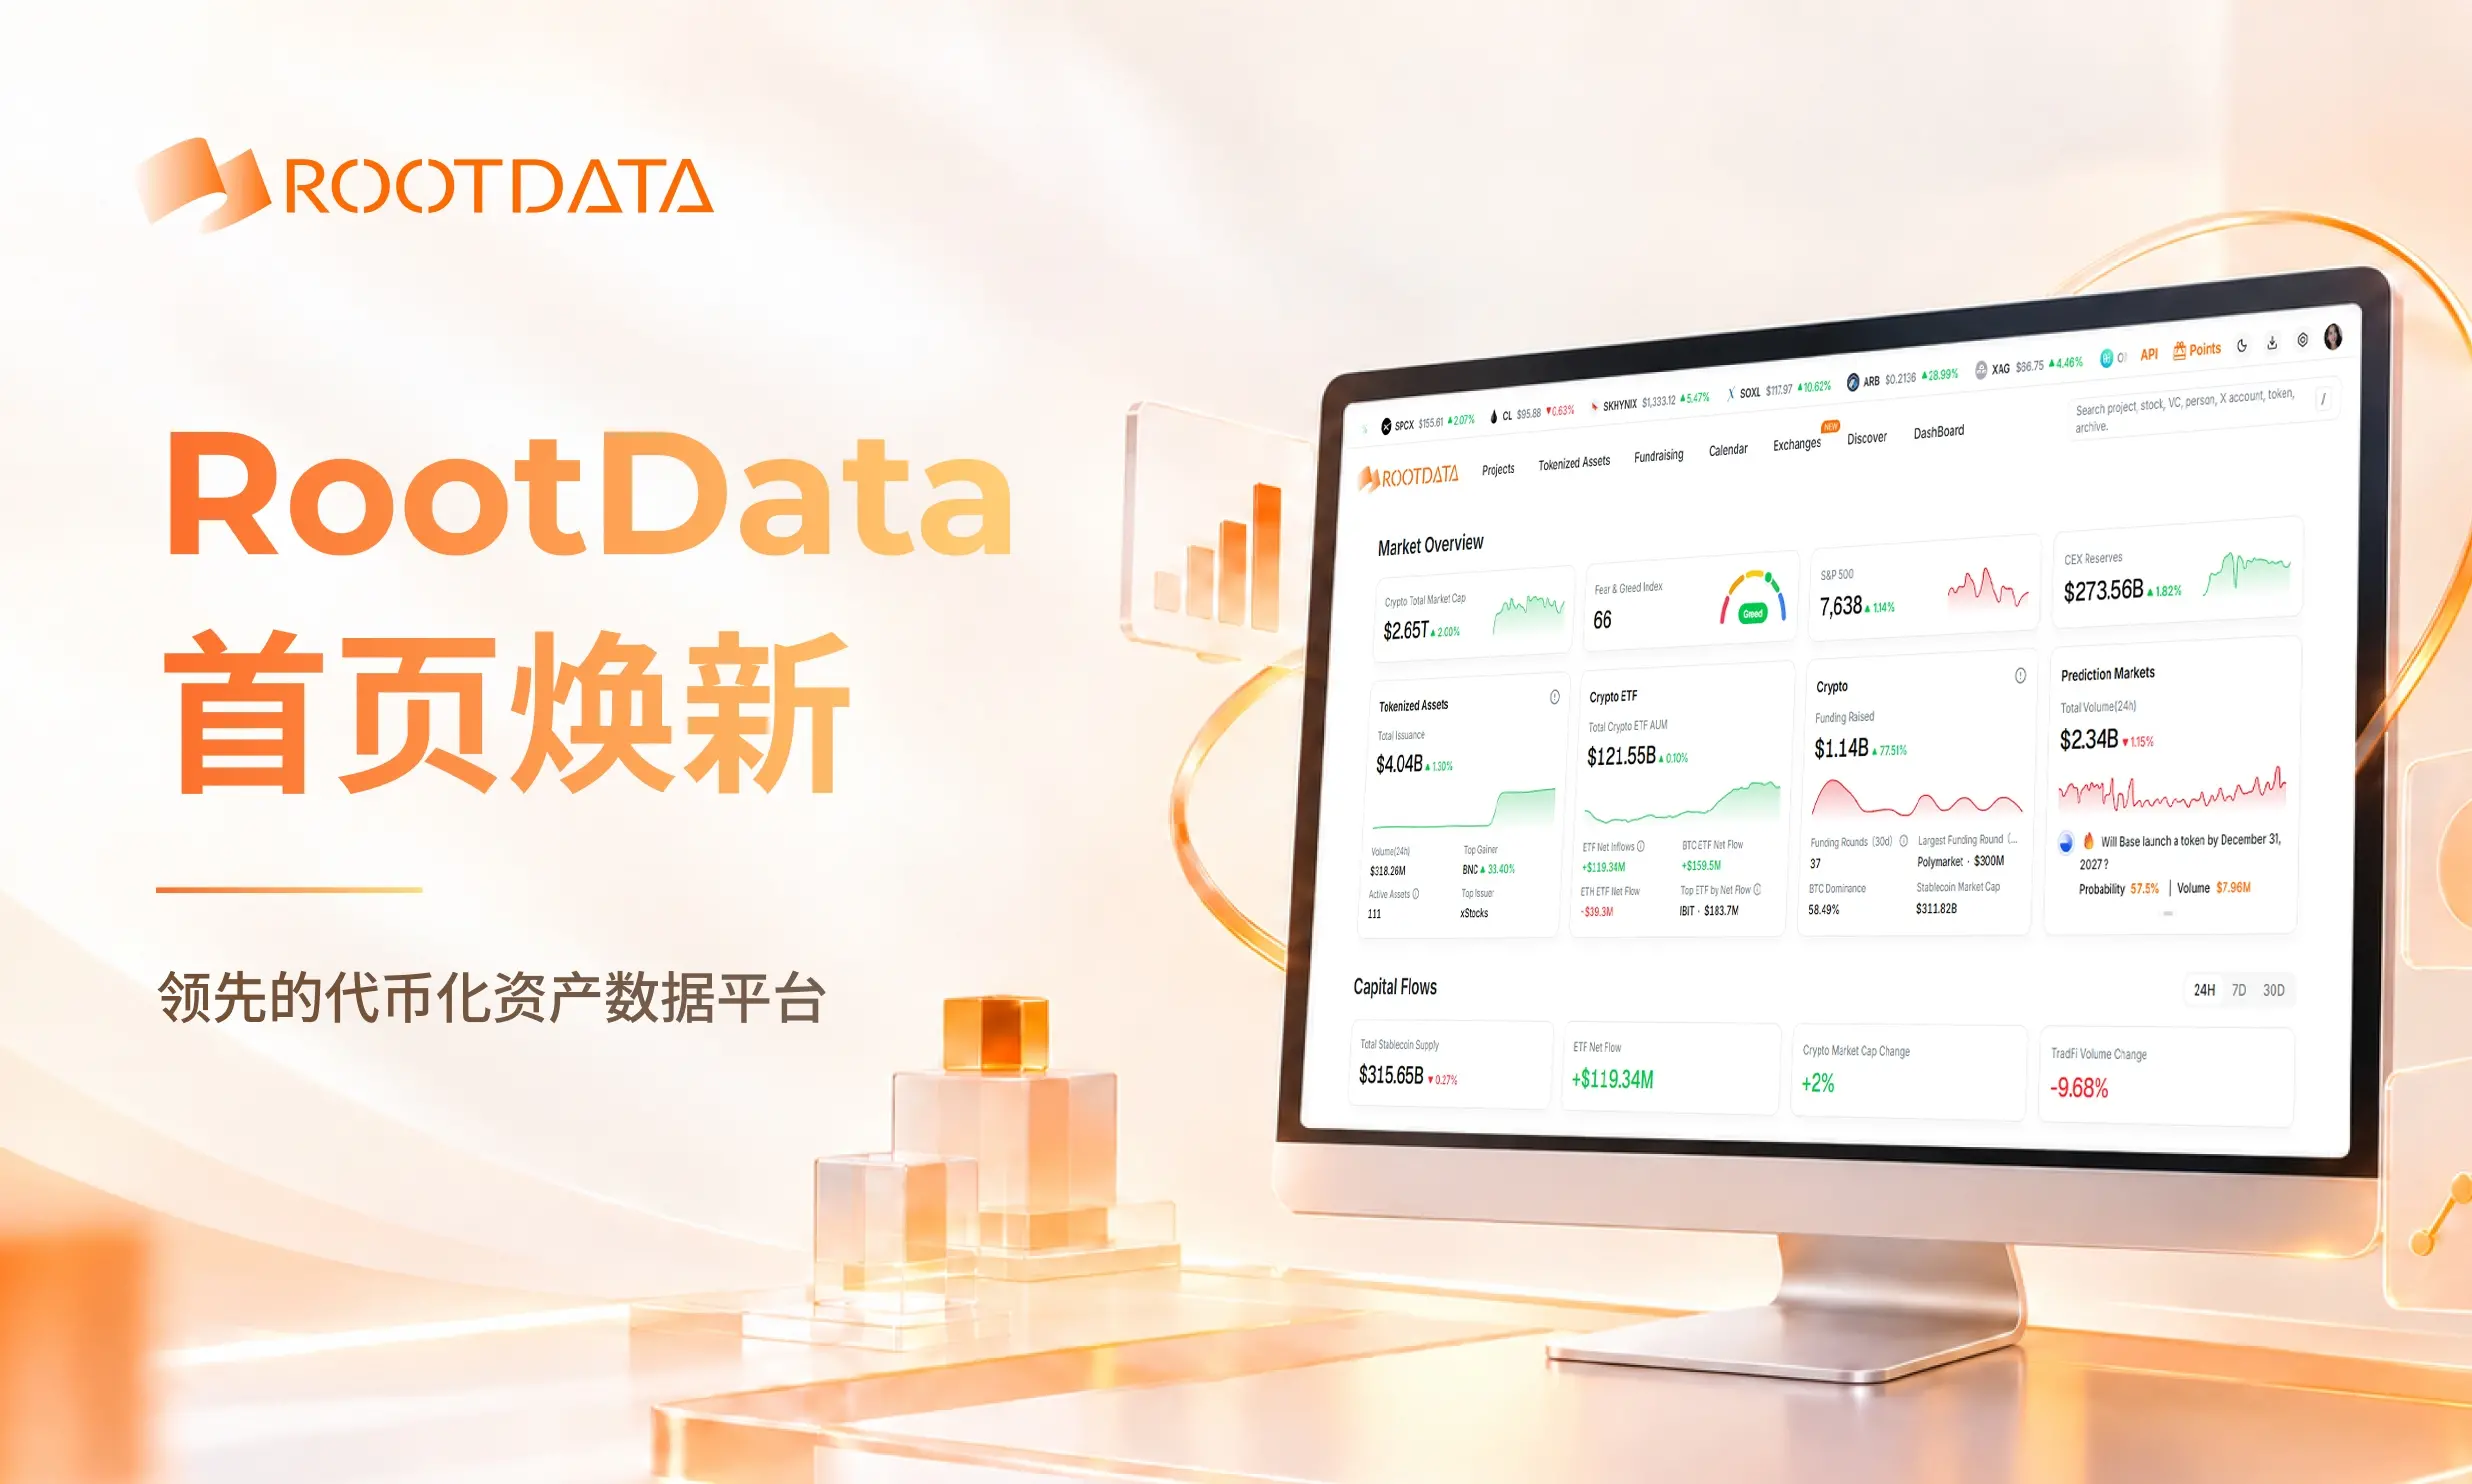
1. Breaking Down the Data Barriers Between TradFi and Crypto, Reconstructing the Panoramic Investment Research Hub
After this upgrade, the RootData homepage breaks the data barriers between traditional finance and the crypto world, seamlessly integrating nine core functional sections that were previously scattered across different platforms into one page: Market Overview, Capital Flow, Stablecoin Liquidity, Platform Market Share, Hot Asset Discovery, Public Chain Market Overview, Protocol Revenue, and TradFi Trading Dynamics along with RootData Research Reports.
These nine sections cover comprehensive data from macro markets, capital flows, cross-market asset discovery, to exchange liquidity distribution, public chain ecosystems, and project fundamentals.
Overall, it helps users thoroughly address the pain points of "information fragmentation, difficulty in cross-market comparison, and opaque capital trends" in the era of TradFi and Crypto integration, enabling efficient tracking of multi-asset data.
2. Detailed Breakdown of Core Upgrade Sections
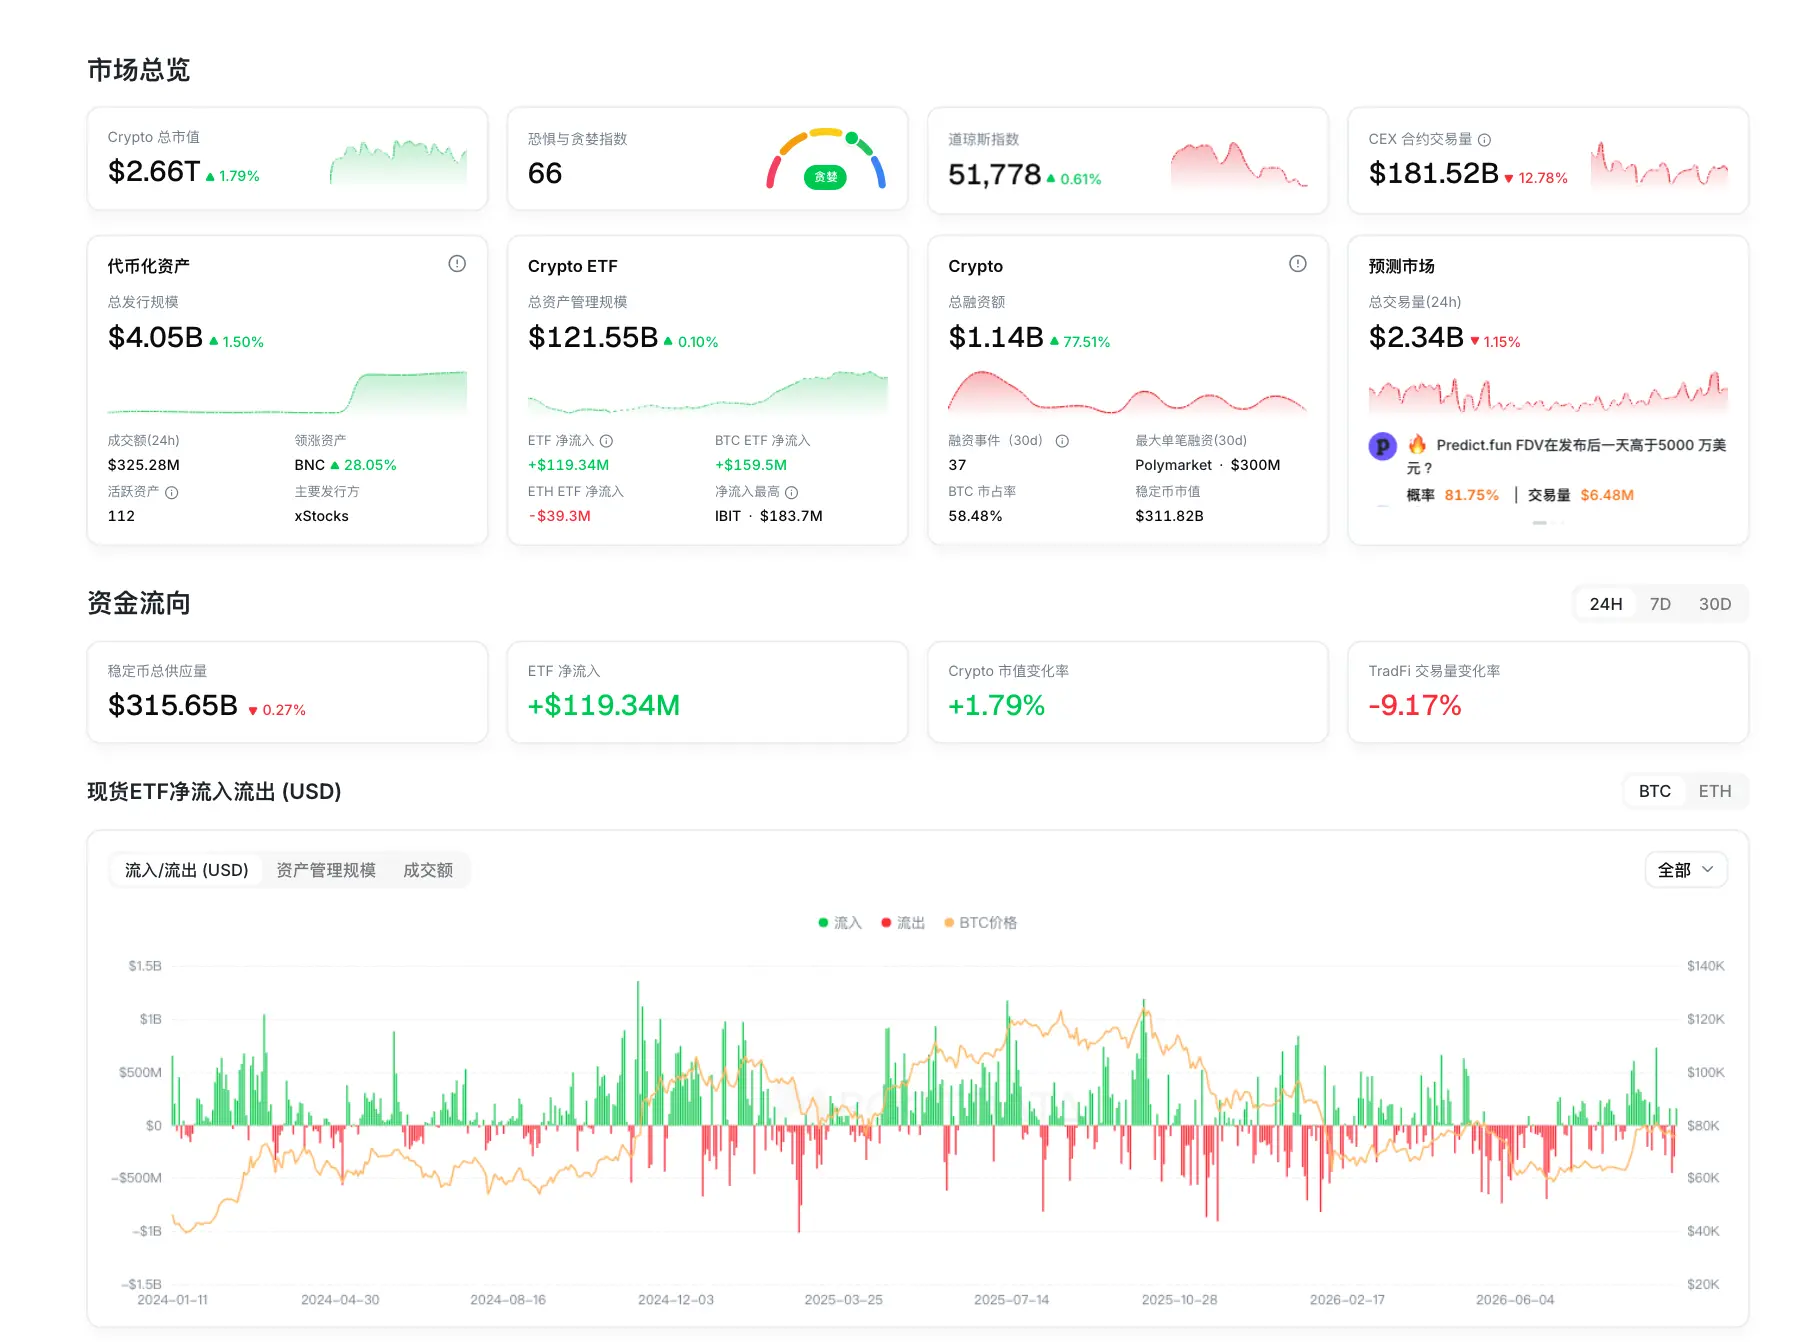
1. Market Overview and Capital Flow: Understanding Market Cycles Through the Lens of "Smart Money"
The new homepage presents the total market cap of Crypto, the Fear and Greed Index, the Dow Jones Index, CEX contract trading volume, inflows and outflows of crypto ETFs, as well as the scale of tokenized assets and crypto financing.
For ordinary users, this is not just a set of data but a dashboard for assessing market cycles and sentiment. By combining the "Capital Flow" module's net inflow of ETFs and the ranking of capital changes, users can intuitively see whether traditional capital is entering the market or where crypto capital is migrating. This helps users escape the dilemma of "blindly following price trends" and truly learn to follow the footsteps of "smart money," understanding "where the money comes from and where it flows," thus making more confident investment decisions at major cycle turning points.
2. Stablecoins and Platform Competition Landscape: Seeing Through Real Purchasing Power and Platform Strength
Delving into the ecological foundation, the granularity of data is further refined. This section directly addresses users' challenges in selecting products and platforms during daily trading.
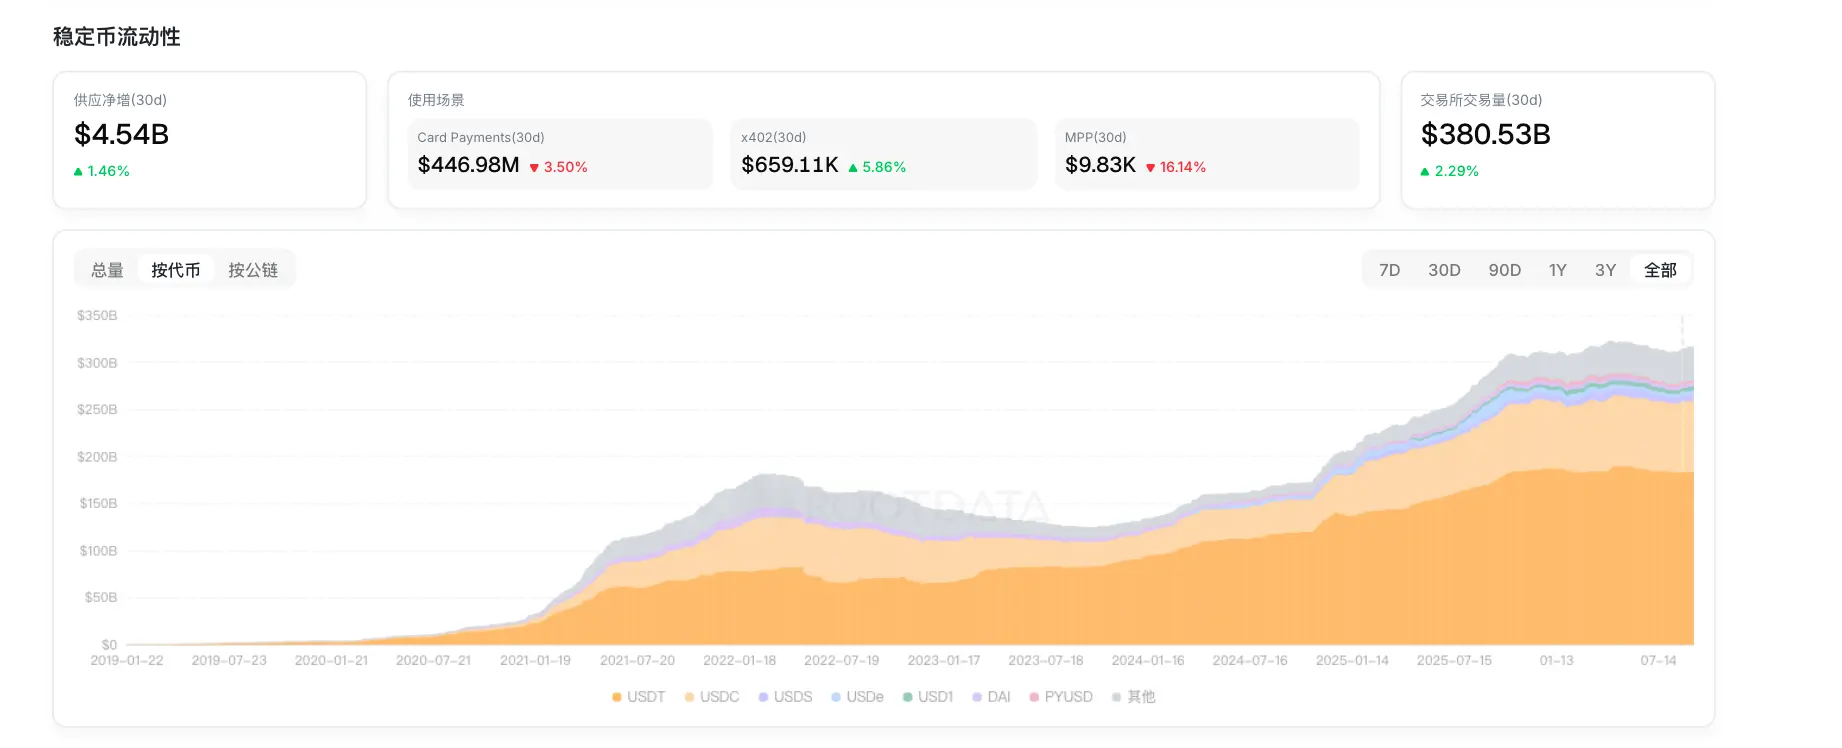
Multi-dimensional Analysis of Stablecoins: Seeing Through the Market's Real Purchasing Power.
Stablecoins are the "ammunition depot" of the market, and changes in their supply directly indicate the potential explosiveness of the market. The new homepage's "Stablecoin Liquidity" module supports three views: total supply, by token, and by public chain, and deeply integrates 30-day net supply increases, payment application data, and CEX trading volume.
For users, this is a key to insight into the market's real liquidity. By observing the net increase of stablecoins and payment application data across different public chains, users can keenly capture which ecosystems are attracting capital. Combined with CEX trading volume, it further verifies whether this capital has translated into real trading activity, helping users time their entry into ecosystem explosions.
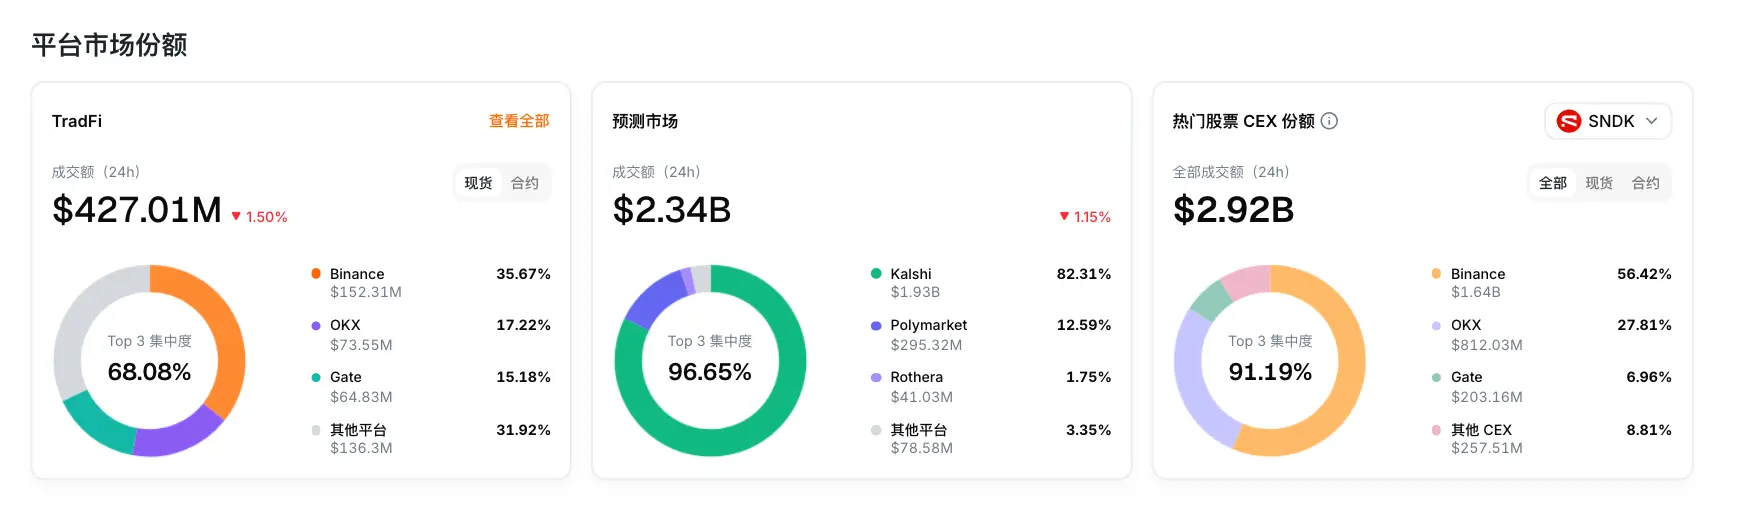
Market Share of Trading Platforms: Understanding the Real Strength of Each Exchange in TradFi and Prediction Markets
The "Platform Market Share" module clearly displays the market share and concentration of TradFi spot, contract, and prediction markets, as well as popular stocks through intuitive pie charts. TradFi platforms also support viewing complete rankings. For ordinary traders, this serves as a "pitfall avoidance guide" and "treasure map" for choosing trading venues.
Through this market share chart, users can easily see which exchanges dominate in TradFi assets and prediction markets, allowing them to choose platforms with better liquidity, deeper depth, and that better represent mainstream market trends, thus avoiding unnecessary slippage losses due to insufficient platform liquidity.
3. Hot Asset Discovery: Capturing Alpha Across the Entire Market
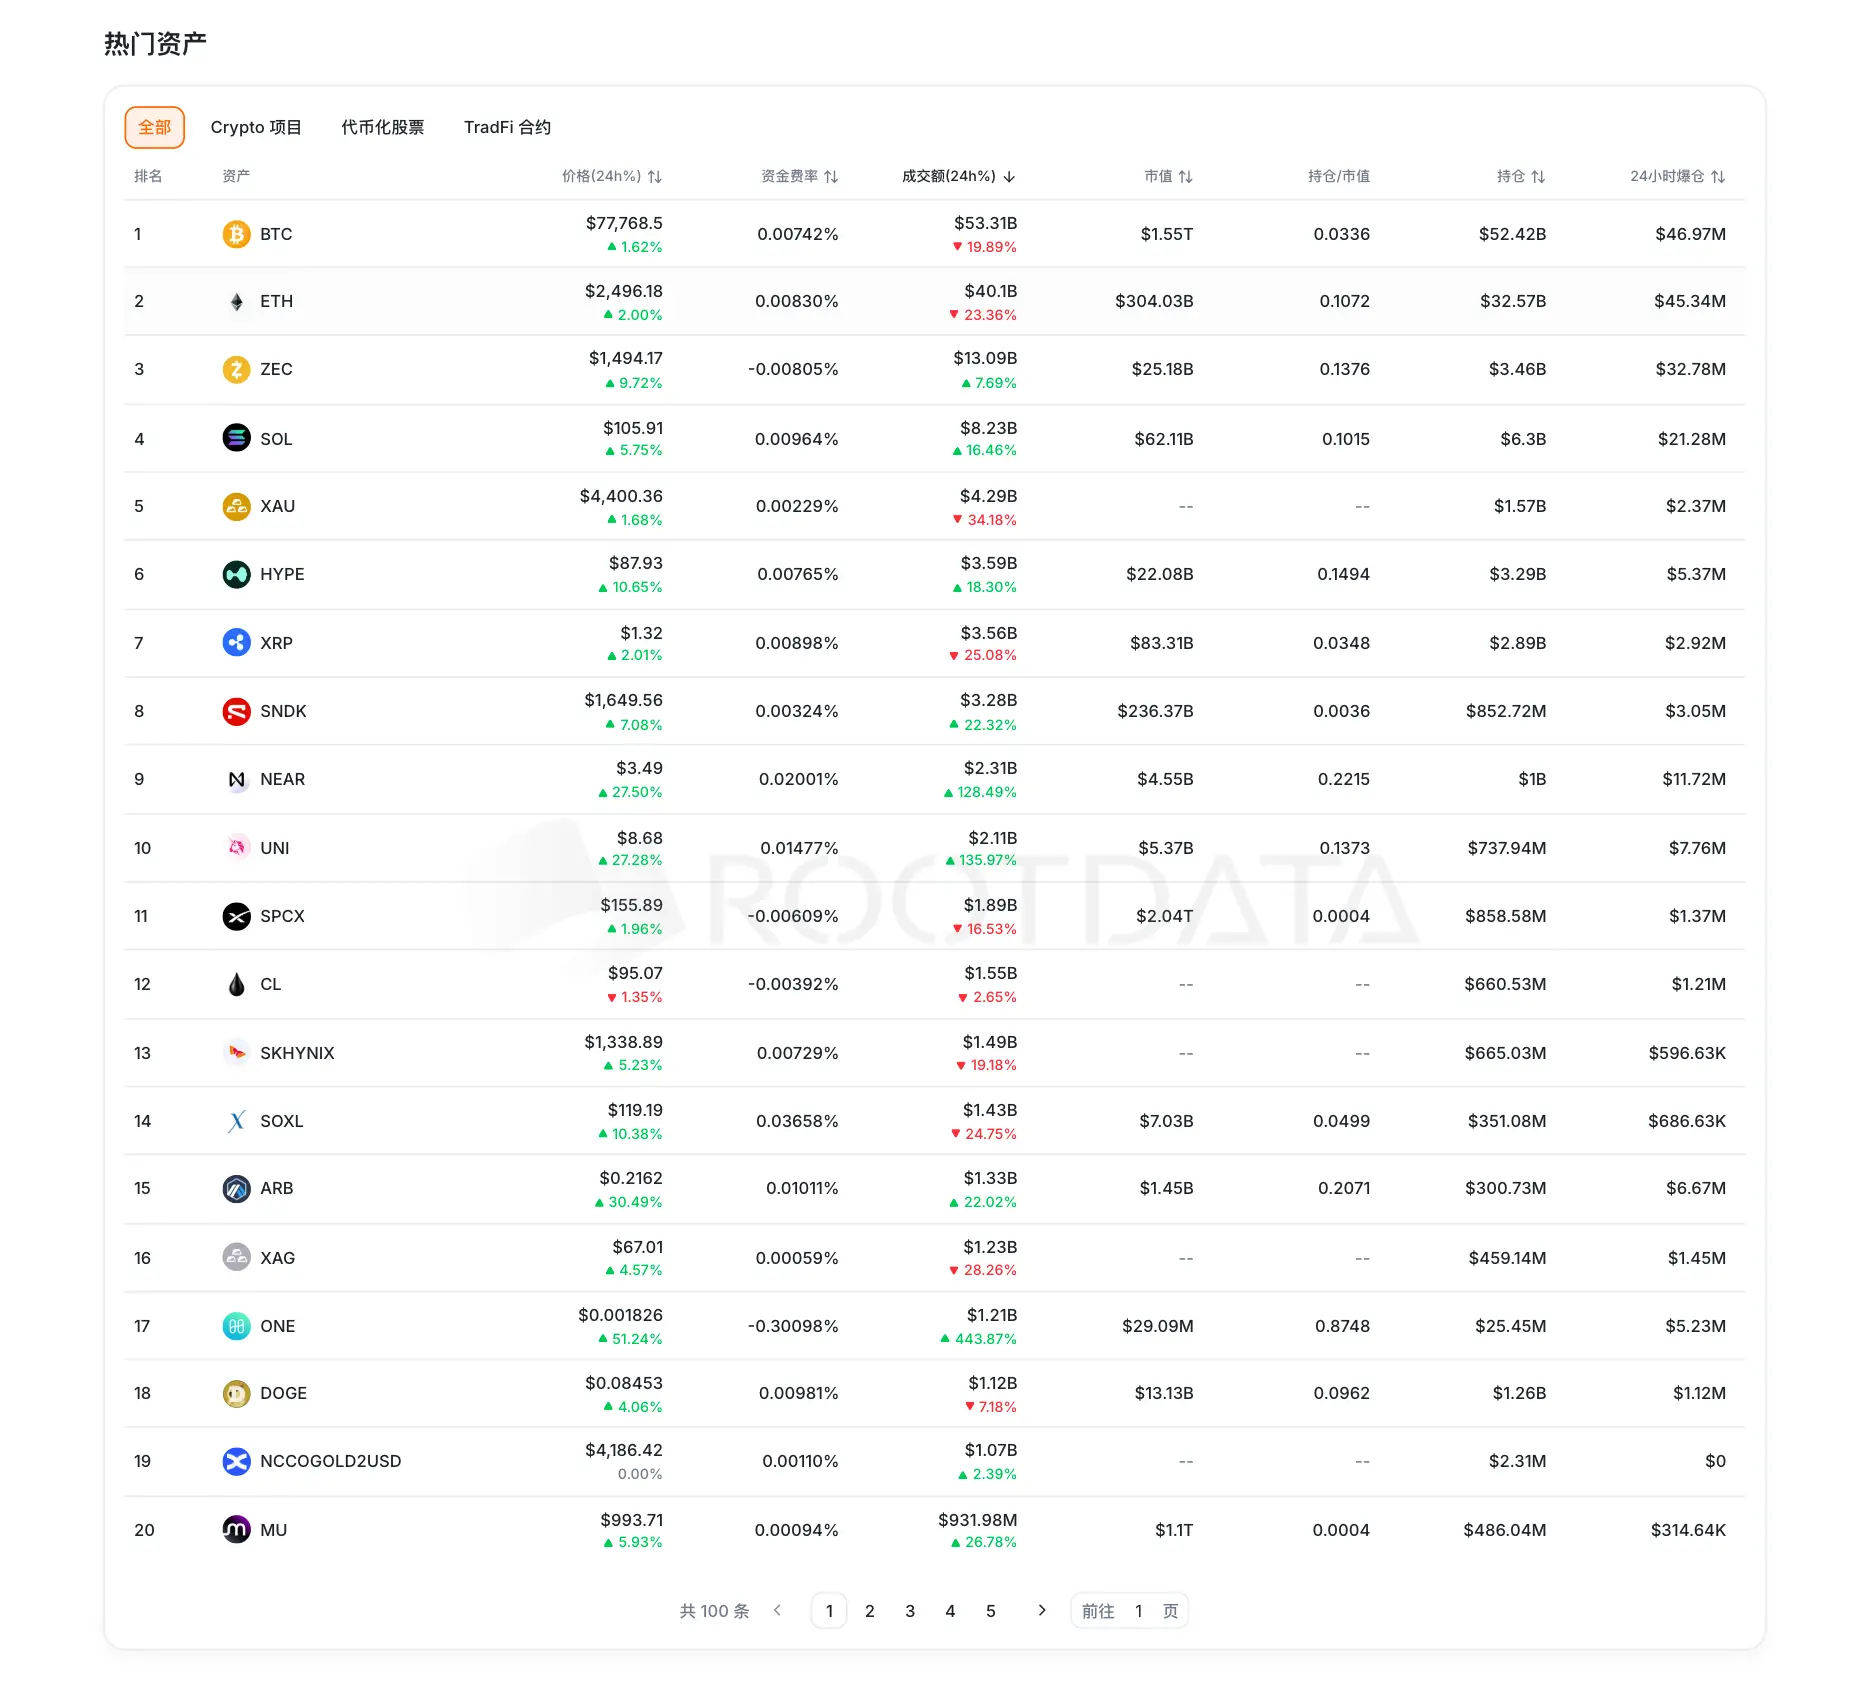
In terms of asset discovery, a new "Hot Assets" integrated list has been launched. This is no longer just a simple list of tokens but an integrated list that combines crypto-native assets with TradFi assets. It supports one-click switching by category and multi-dimensional sorting.
For users, this not only means one-stop discovery of hot assets but, more importantly, breaks the isolation between native crypto and traditional financial assets, making cross-market searches for Alpha possible. Users can quickly compare the market performance of the two asset types, providing direct evidence for personal selection and decision-making.
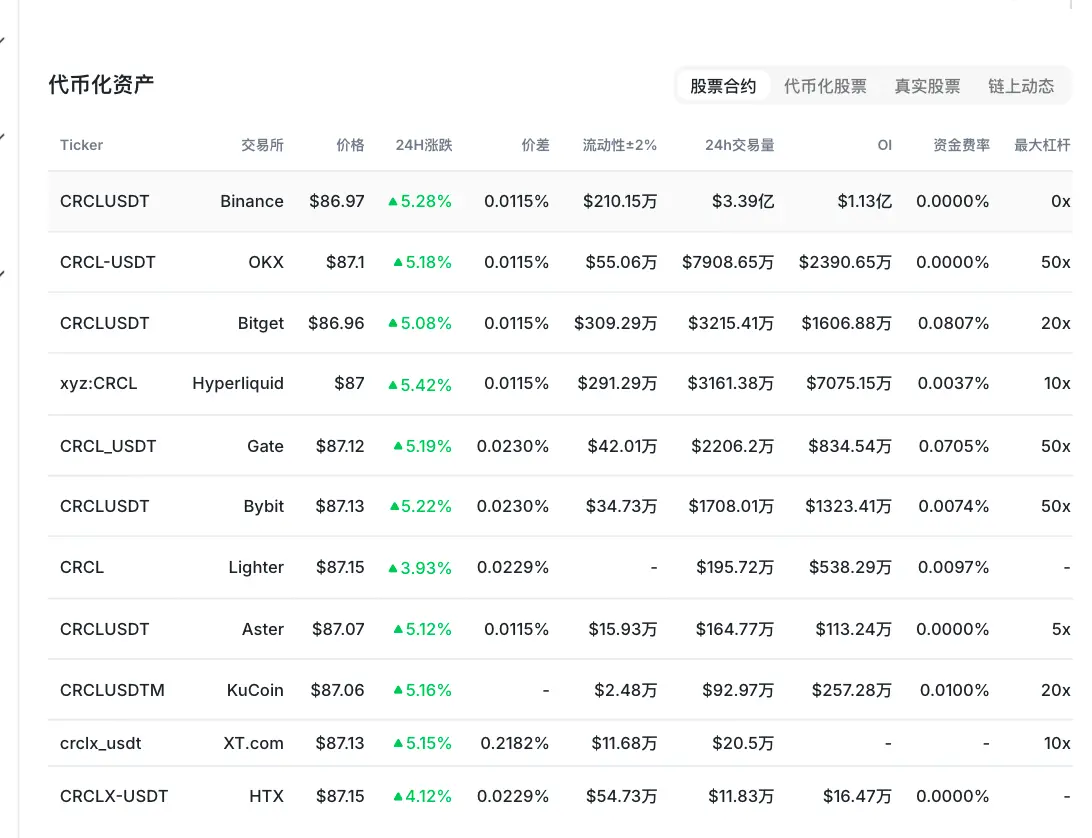
Additionally, for each hot tokenized stock in the list, users can view the performance of each exchange in "spot, contract," and other assets. This feature directly addresses users' pain points in finding the "best liquidity venues." By assessing spot share, users can determine which platform has the most active natural buying; by assessing contract share, they can find the strongest positions for derivative trading depth. This provides direct evidence for users' trading strategy formulation and finding low-slippage trading pairs, allowing them to capture opportunities like professional traders in the most active arenas.
4. Public Chain Ecosystem and Protocol Revenue: Exploring the Real Revenue-Generating Ability Behind Assets
After tracking capital flows, filtering exchanges, and discovering hot assets, users will naturally be curious about how the underlying networks supporting these assets and trades are developing.
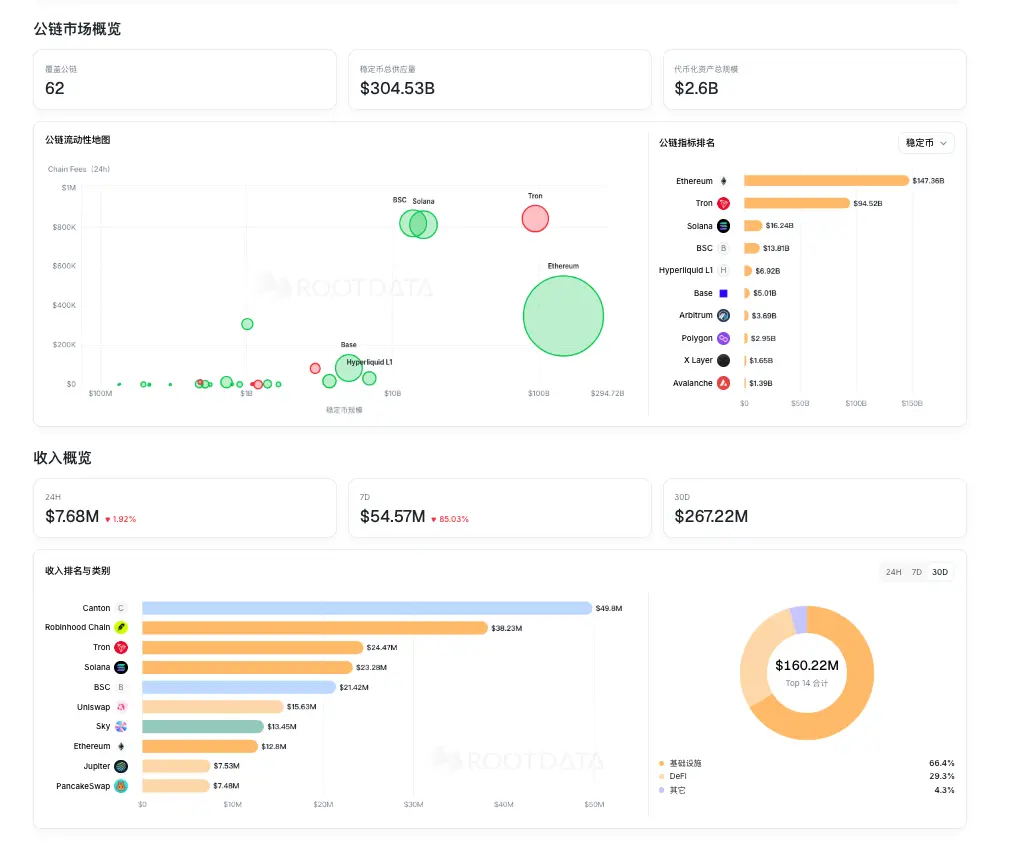
The public chain ecosystem no longer just looks at superficial TVL; the newly added "Protocol Revenue" leaderboard supplements the fundamental perspective, showcasing income changes over different periods, linking protocol types and covering public chains, allowing users to penetrate market sentiment and study the real business performance and revenue-generating ability of projects, providing a more solid data basis for finding quality assets.
5. Market Dynamics and Research Loop: From "Watching the Excitement" to "Understanding the Intricacies"
The homepage closely follows the forefront of cross-market competition. "TradFi Trading Dynamics" provides real-time updates on prices, transactions, and other market changes, helping users capture the movements of smart capital at the first opportunity.
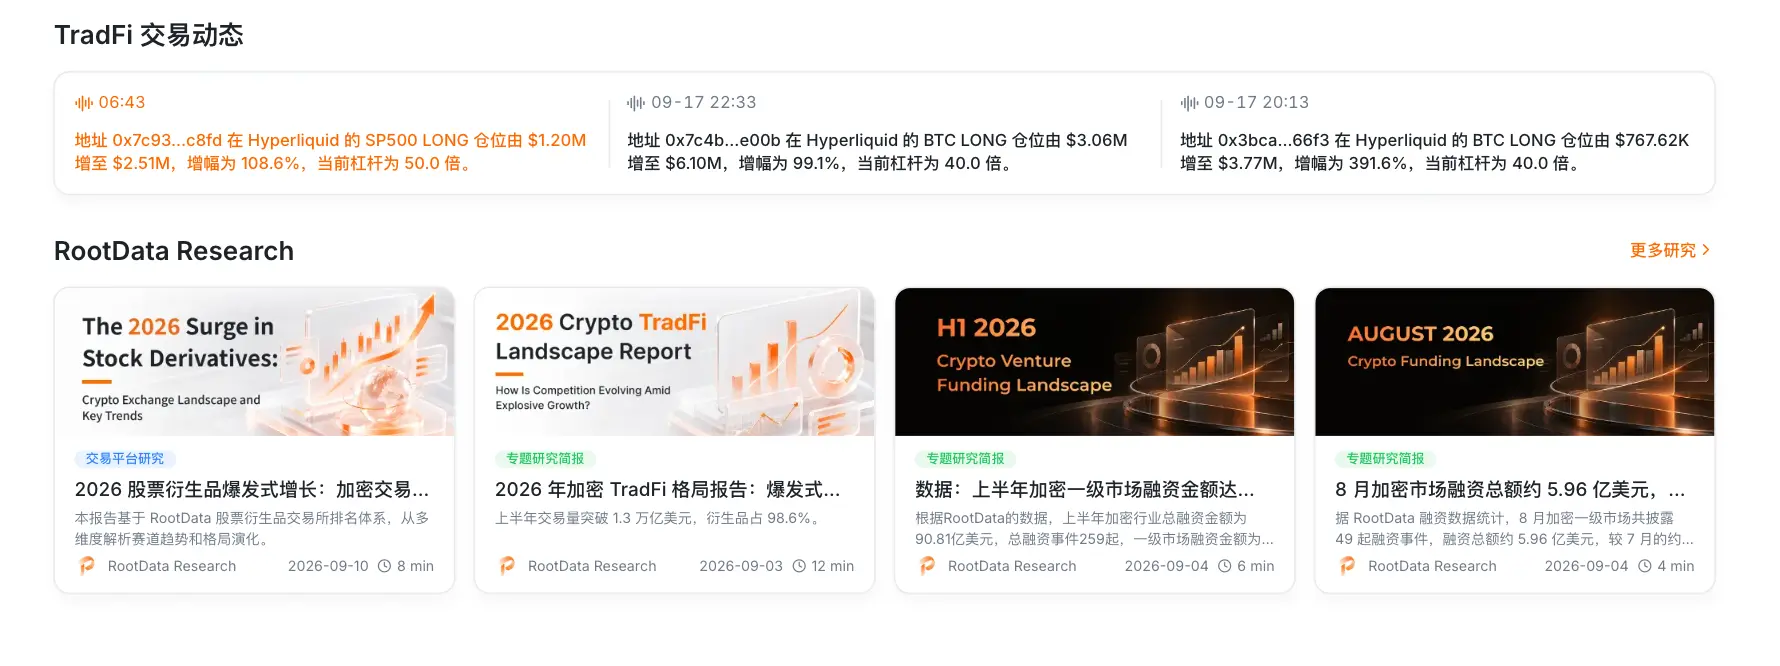
RootData Research regularly updates in-depth reports, such as interpretations of the stock derivatives market and financing market, with its professional content having been repeatedly shared and recognized by industry leaders like He Yi, co-founder of Binance, making it highly authoritative in the industry.
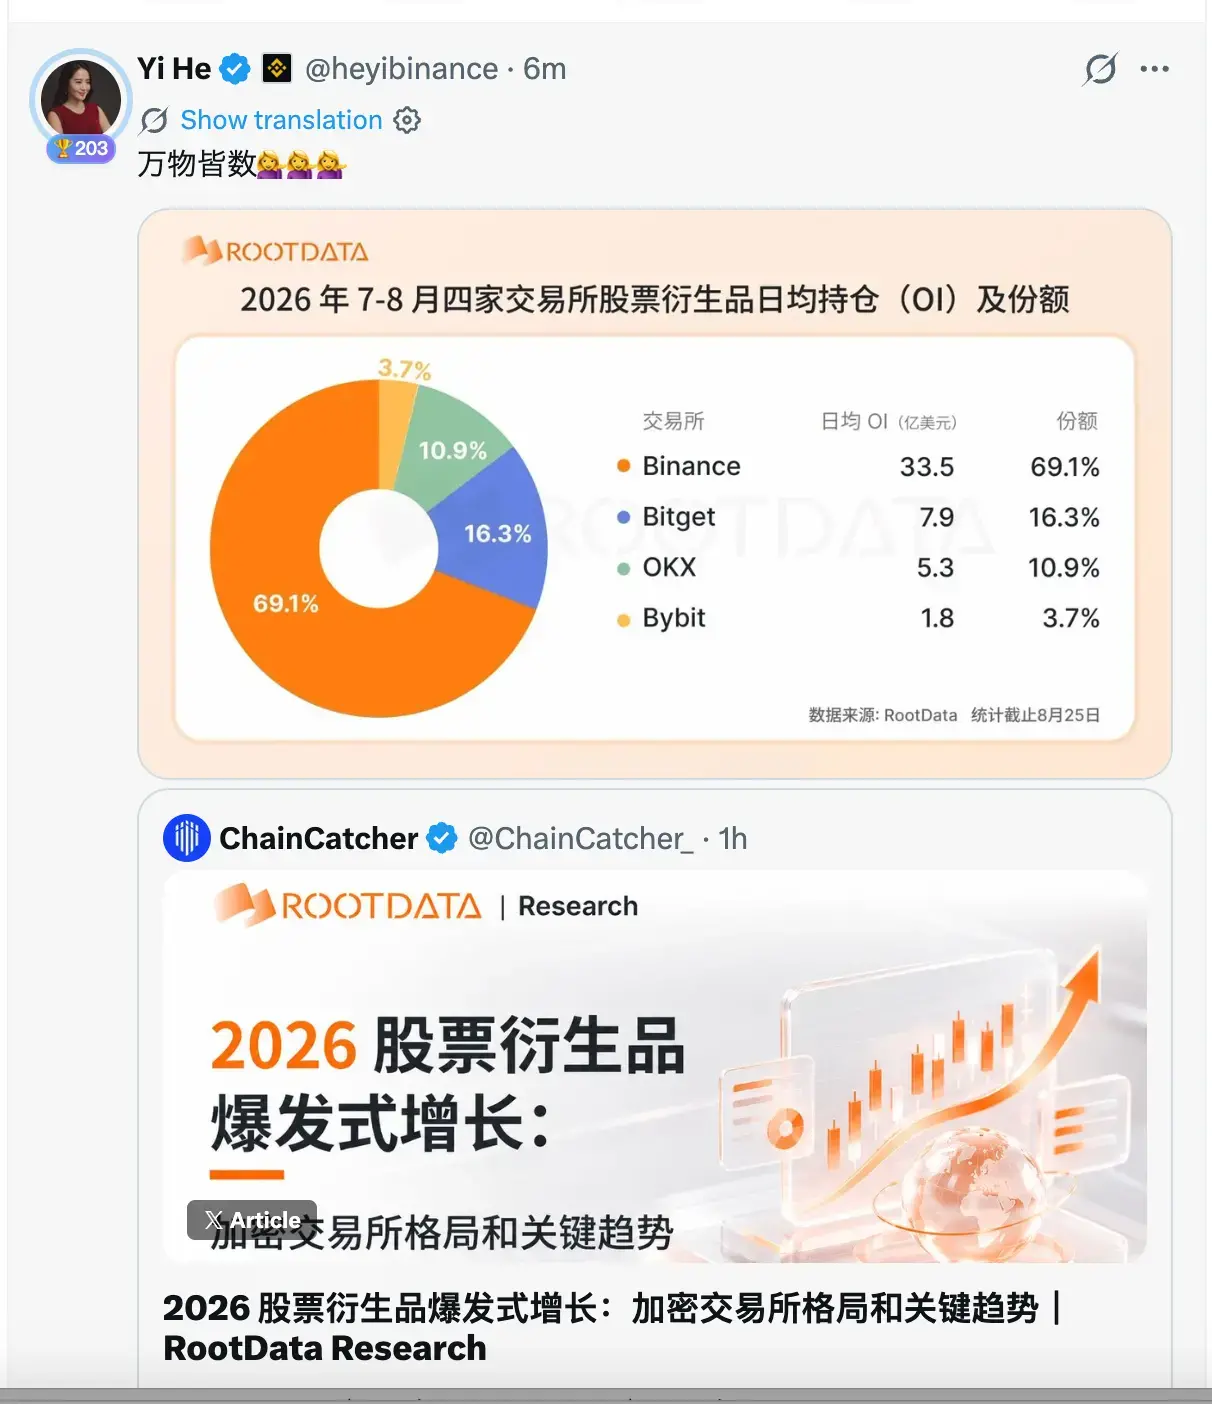
Users can discover data changes and further understand related assets and market backgrounds. This not only alleviates users' anxiety of "seeing anomalies but not knowing why" but also helps everyone complete the investment research loop of "seeing data, understanding logic, making decisions," enabling ordinary users to grasp the underlying implications of the market.
Conclusion
This homepage upgrade was not achieved overnight. Prior to this panoramic redesign, RootData had successively launched the "Tokenized Assets" section and the "Stock Business Ranking" feature, laying a solid foundation for cross-market investment research.
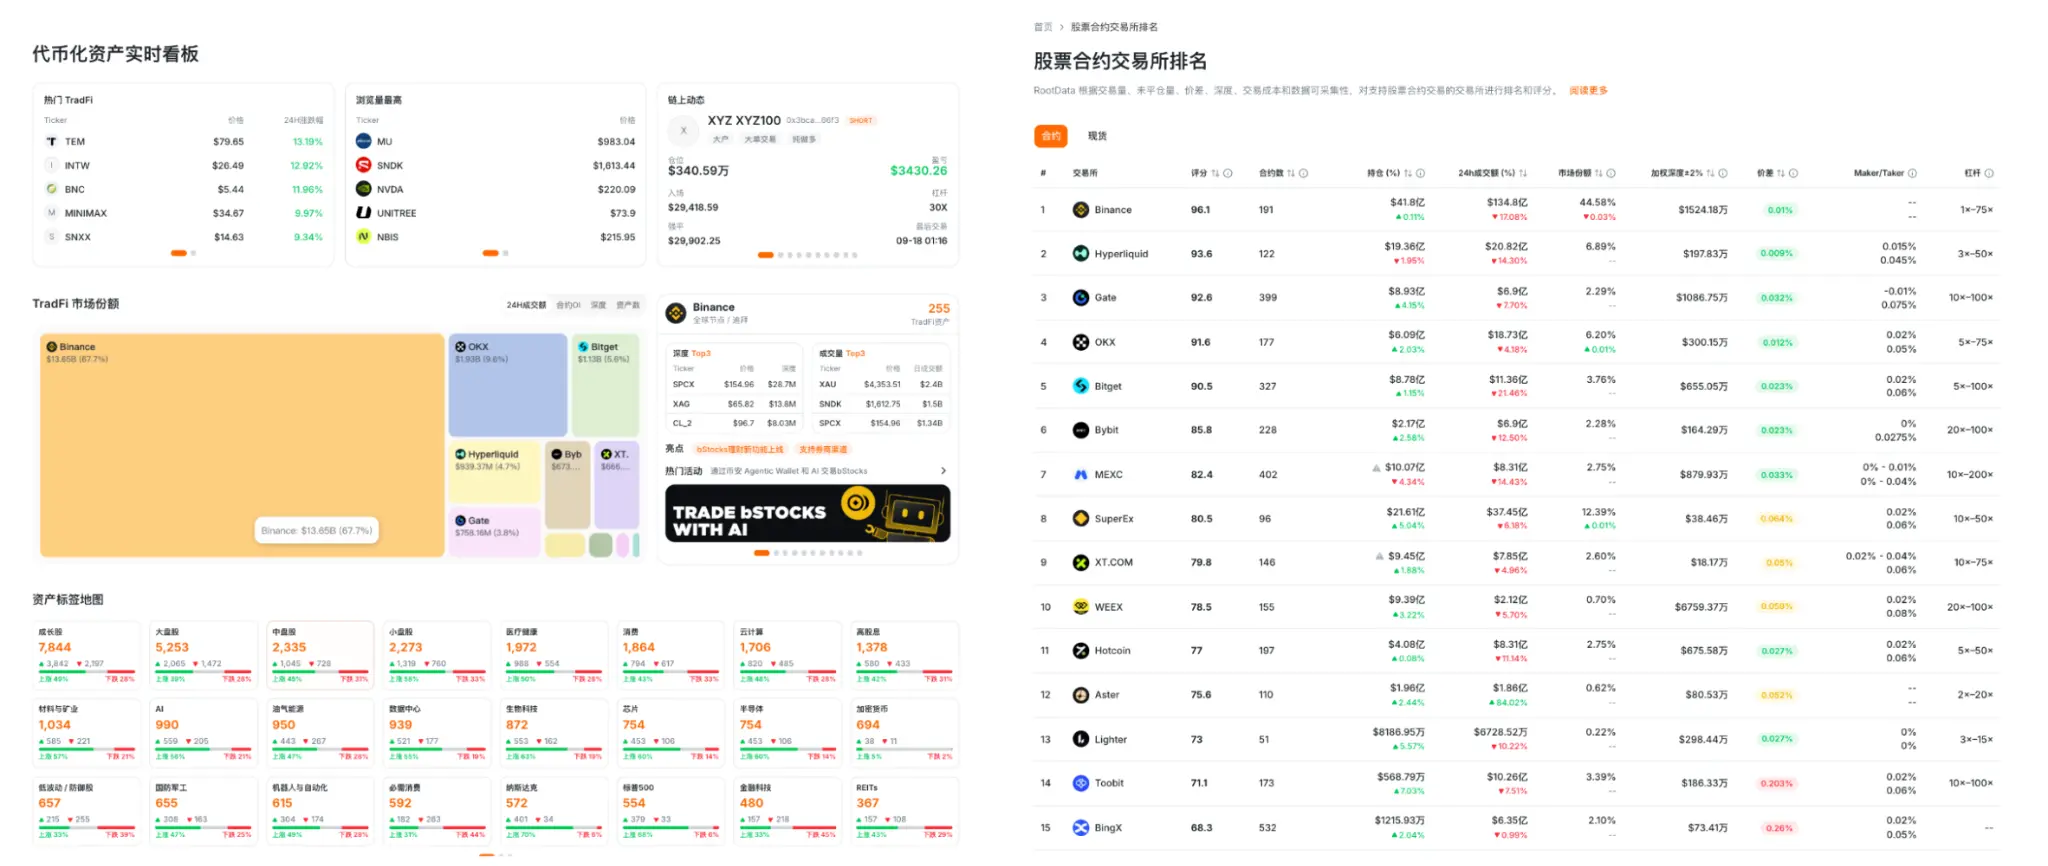
Users can directly access the "Tokenized Assets" section through the top navigation to track the latest developments in tokenized assets; the "Stock Business Ranking" deeply penetrates the performance of tokenized assets in spot and contract trading across major crypto exchanges. These well-established underlying data capabilities allow users to gain insights into the competitive dynamics between traditional brokers and crypto trading platforms, seizing opportunities in the wave of full integration between TradFi and Crypto.
In today's full integration of TradFi and Crypto, the value of data lies in connection and insight. The new RootData homepage simplifies complex cross-market data, providing users with a panoramic investment research gateway to the era of great integration. Welcome to visit RootData immediately, experience the new homepage, and start efficient investment research.
 Risk warning



Popular articles