12 Charts Interpreting the Persistently Depressed September Crypto Market
Summary:
Overall, the past month has continued to show a depressed state, with many indicators even experiencing further declines. This article will interpret the conditions of the cryptocurrency market in September with 12 charts.

2023-10-03 11:29:23
Collection
 Overall, the past month has continued to show a depressed state, with many indicators even experiencing further declines. This article will interpret the conditions of the cryptocurrency market in September with 12 charts.
Author: The Block Research Director Lars
Compiled by: Jordan, PANews
In August, most indicators in the cryptocurrency industry experienced significant corrections, but the sluggish market conditions did not improve in September. Overall, the past month continued to show a depressed state, with many indicators even experiencing further declines. This article will interpret the cryptocurrency market conditions of September with 12 charts.
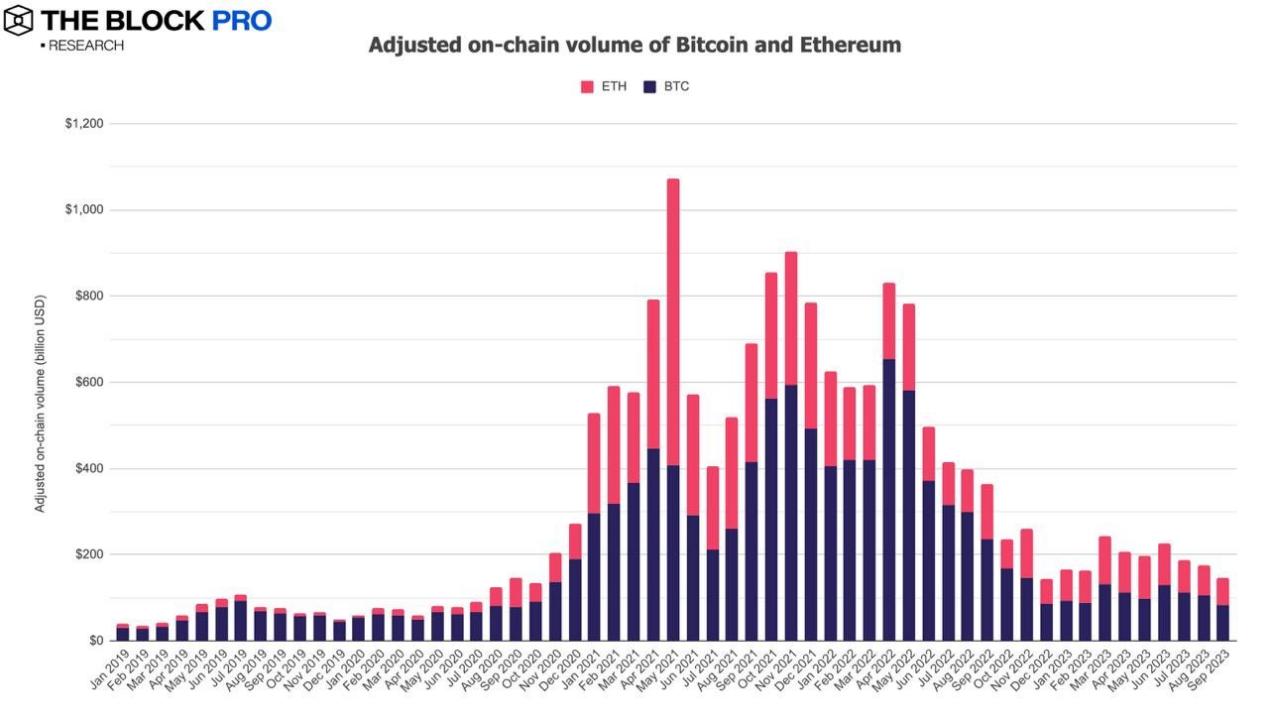
- In September, both Bitcoin and Ethereum saw a decline in on-chain total transaction volume after adjustments, with an overall drop of 17.5% to $145 billion. The on-chain transaction volume for Bitcoin decreased by as much as 20.83%, while Ethereum's on-chain transaction volume fell by 12.6%.
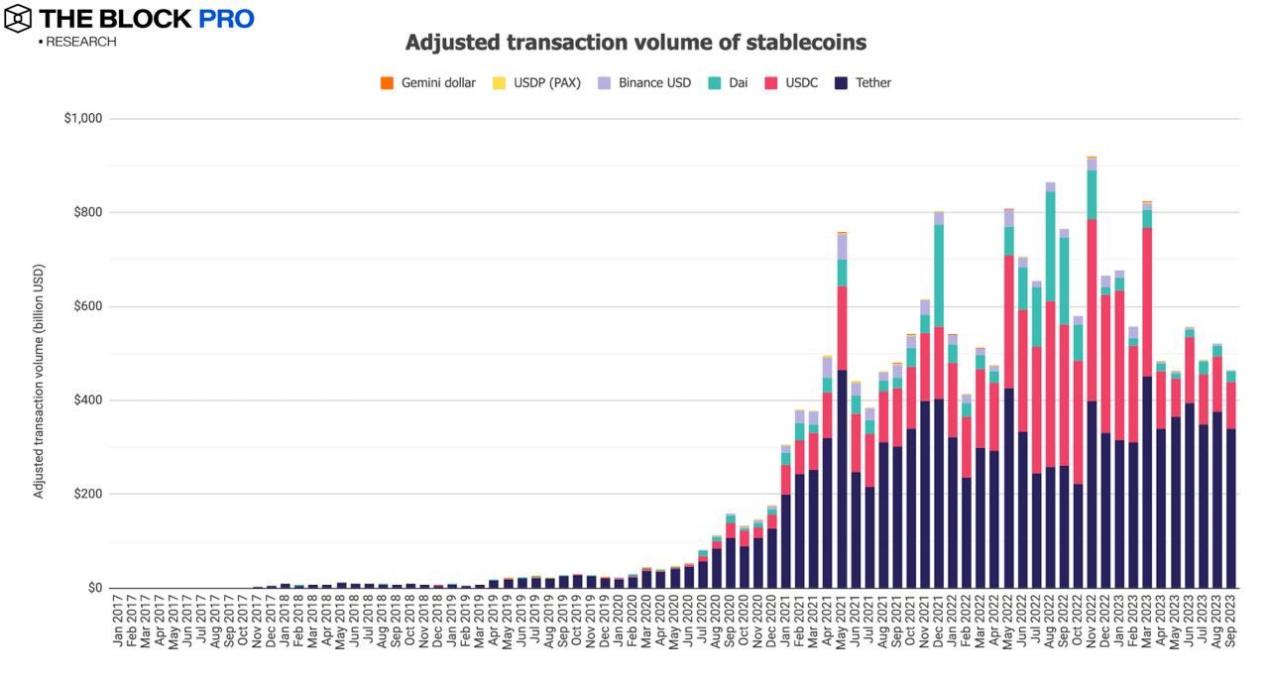
- The on-chain transaction volume of stablecoins also declined in September, dropping to $46.52 billion, a decrease of about 10.7%. However, the supply of issued stablecoins increased to $116 billion, although the growth was only 0.75%. This was one of the few industry indicators that saw an increase in September, with the market share of the US dollar stablecoin USDT accounting for 72.3% (a decrease from August), while USDC's market share further dropped to 20%.
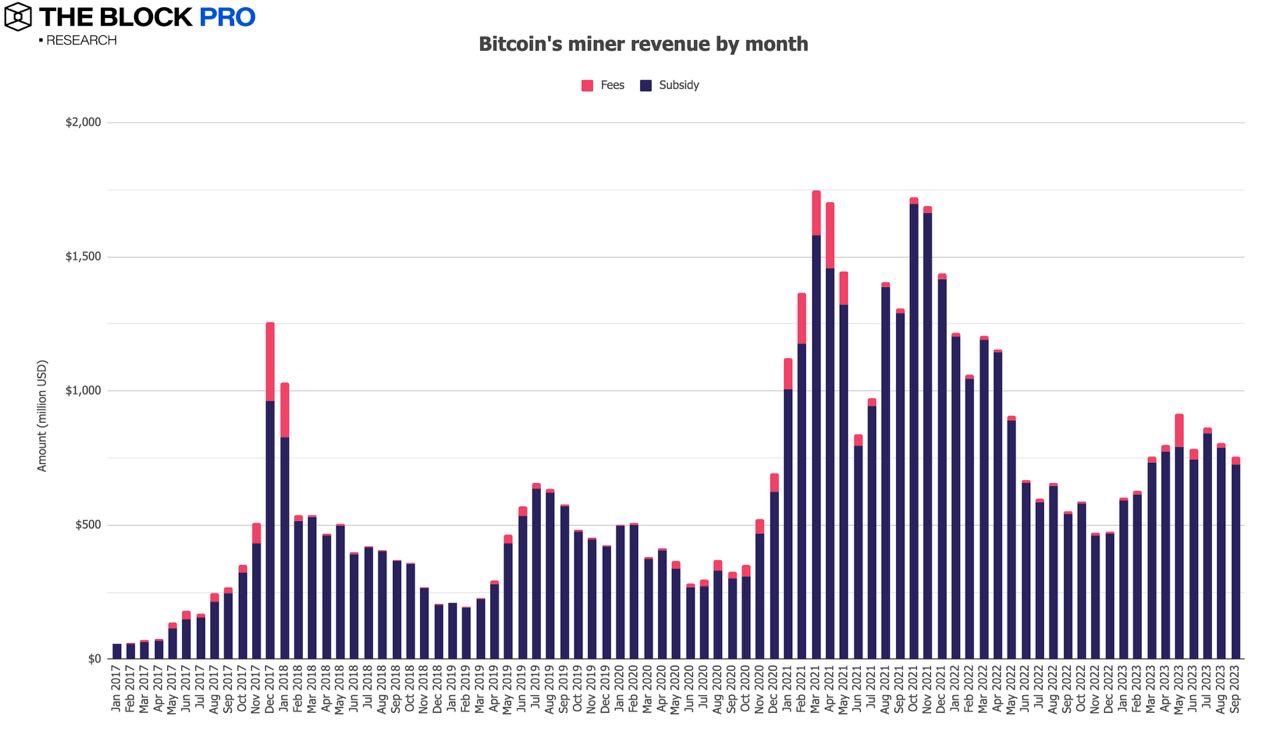
- Bitcoin miner revenue further shrank in September, falling to $753 million, a decrease of 6.4%. Meanwhile, Ethereum staking revenue also declined, dropping by 11.2% to approximately $115 million.
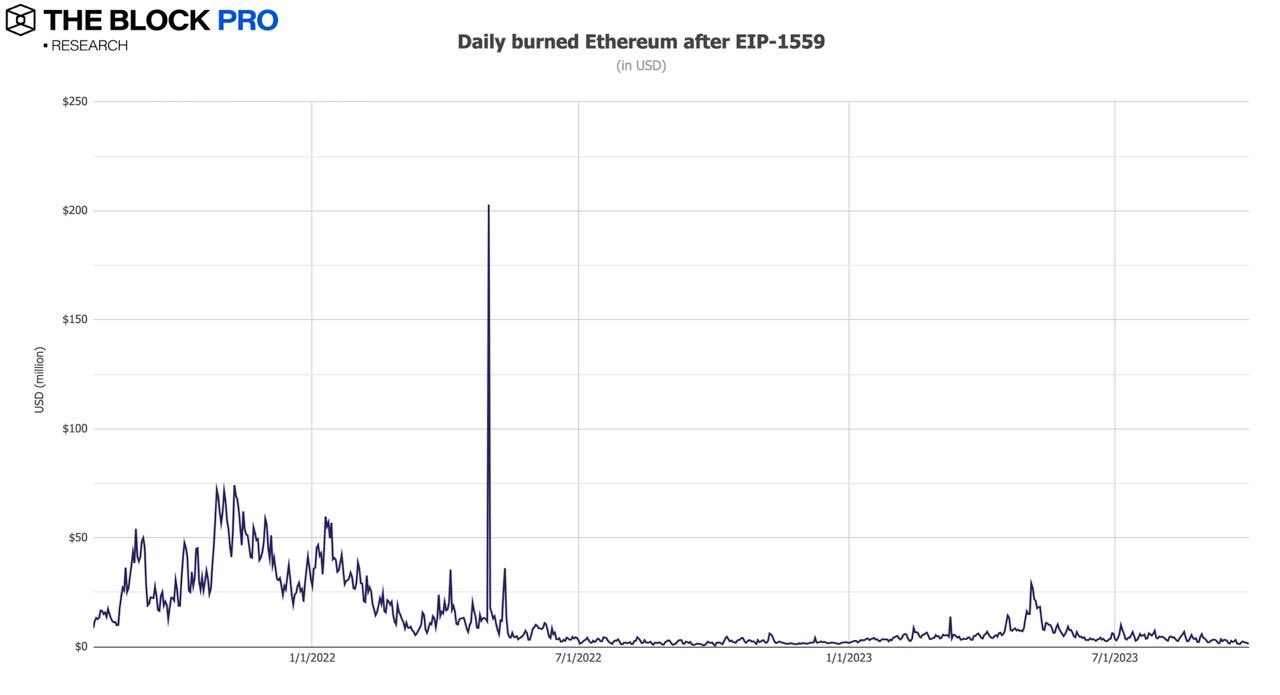
- In September, the Ethereum network burned a total of 44,267 ETH, worth approximately $71.7 million. Data shows that since the implementation of EIP-1559 in early August 2021, Ethereum has burned a total of about 3.62 million ETH, valued at approximately $10.24 billion.
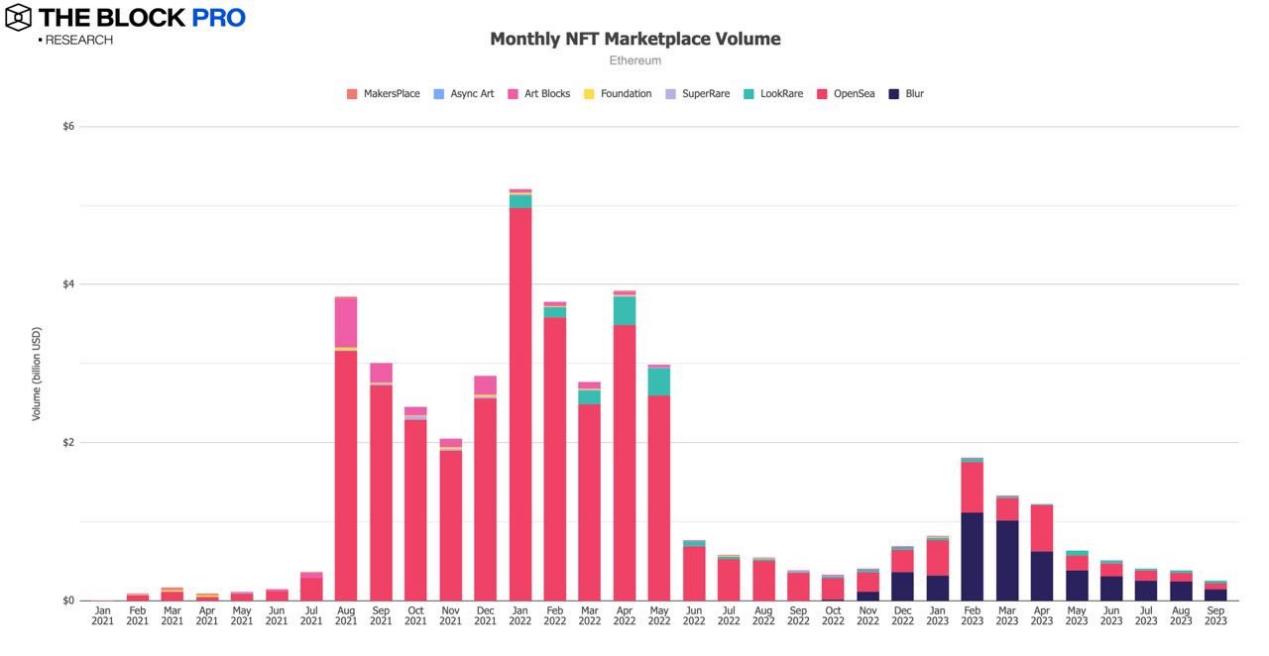
- The on-chain NFT market for Ethereum saw a significant decline in transaction volume in September, decreasing to approximately $261 million, a drop of 31.8%. However, the emerging NFT market Blur has surpassed OpenSea in monthly transaction volume and other metrics for the eighth consecutive month.
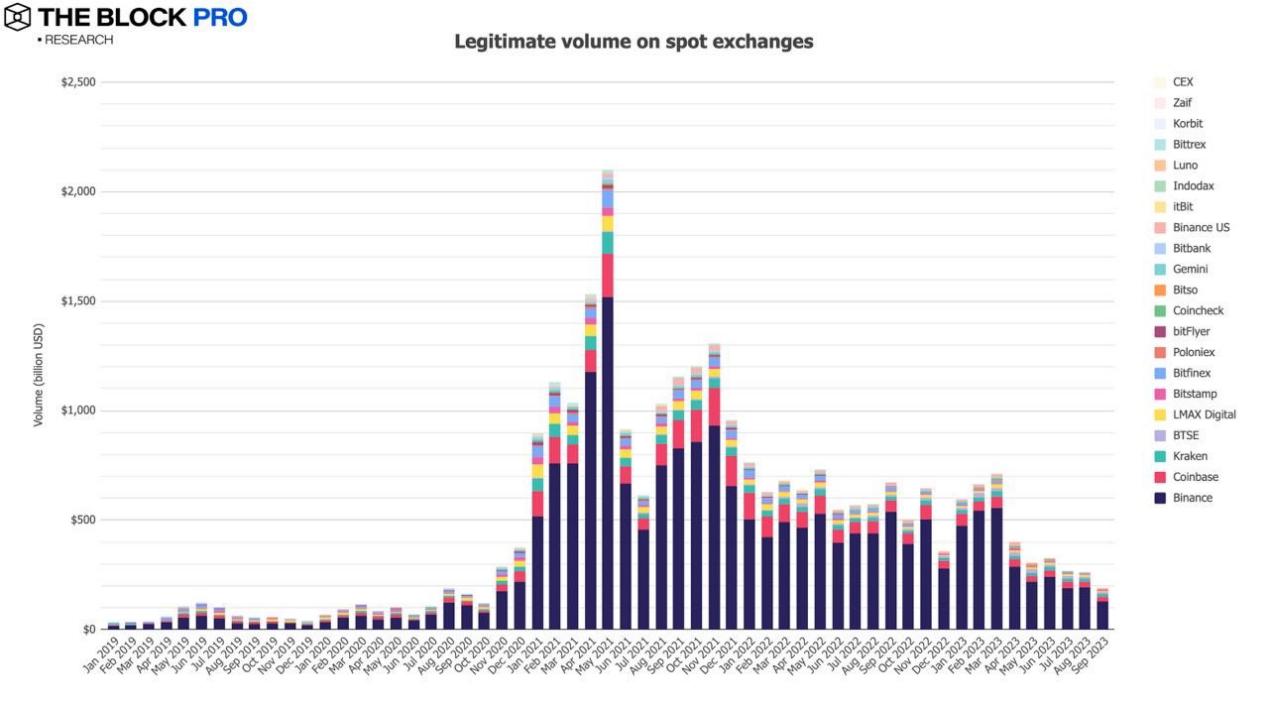
- The spot trading volume of compliant centralized exchanges (CEX) also saw a staggering decline in September, dropping by 28.3% to approximately $187.7 billion, marking the lowest level since October 2020.
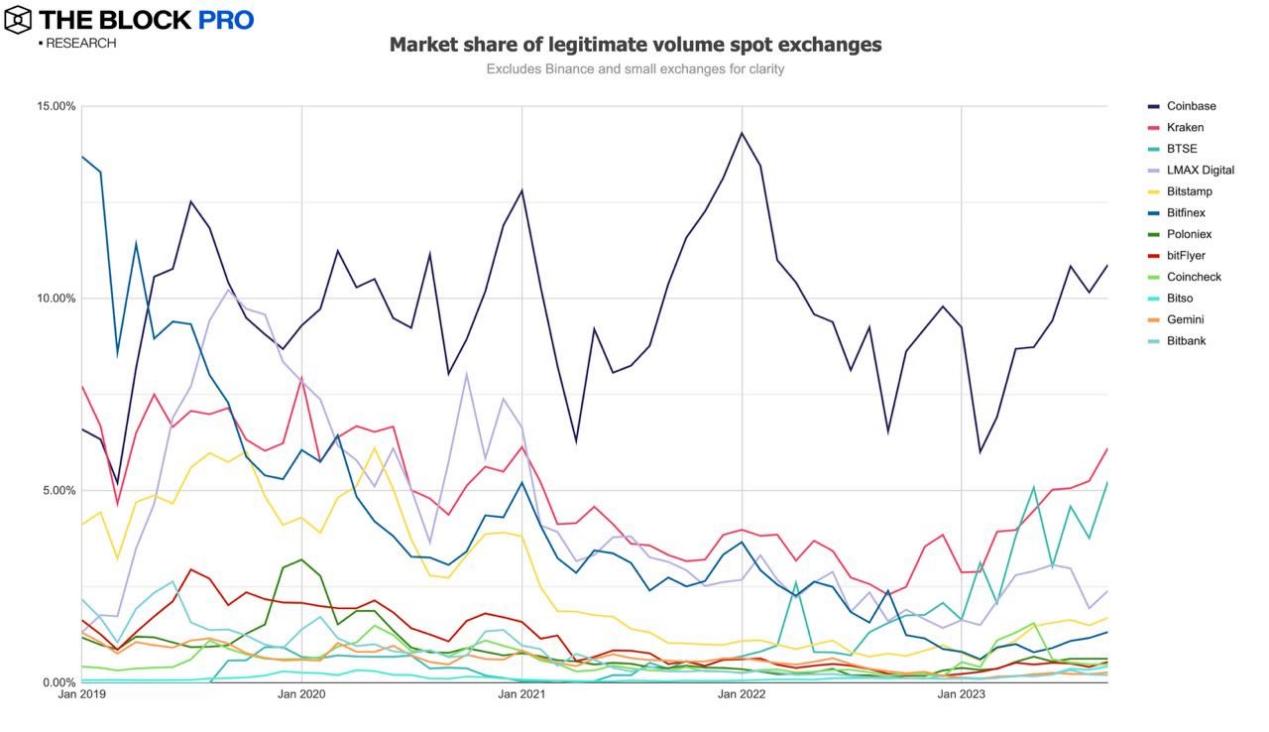
- The ranking of spot market shares among major cryptocurrency exchanges in September was as follows: Binance at 69.3% (a decrease of about 5 percentage points from August), Coinbase at 10.9%, Kraken at 6.1%, BTSE at 5.2%, and LMAX Digital at 2.4%.
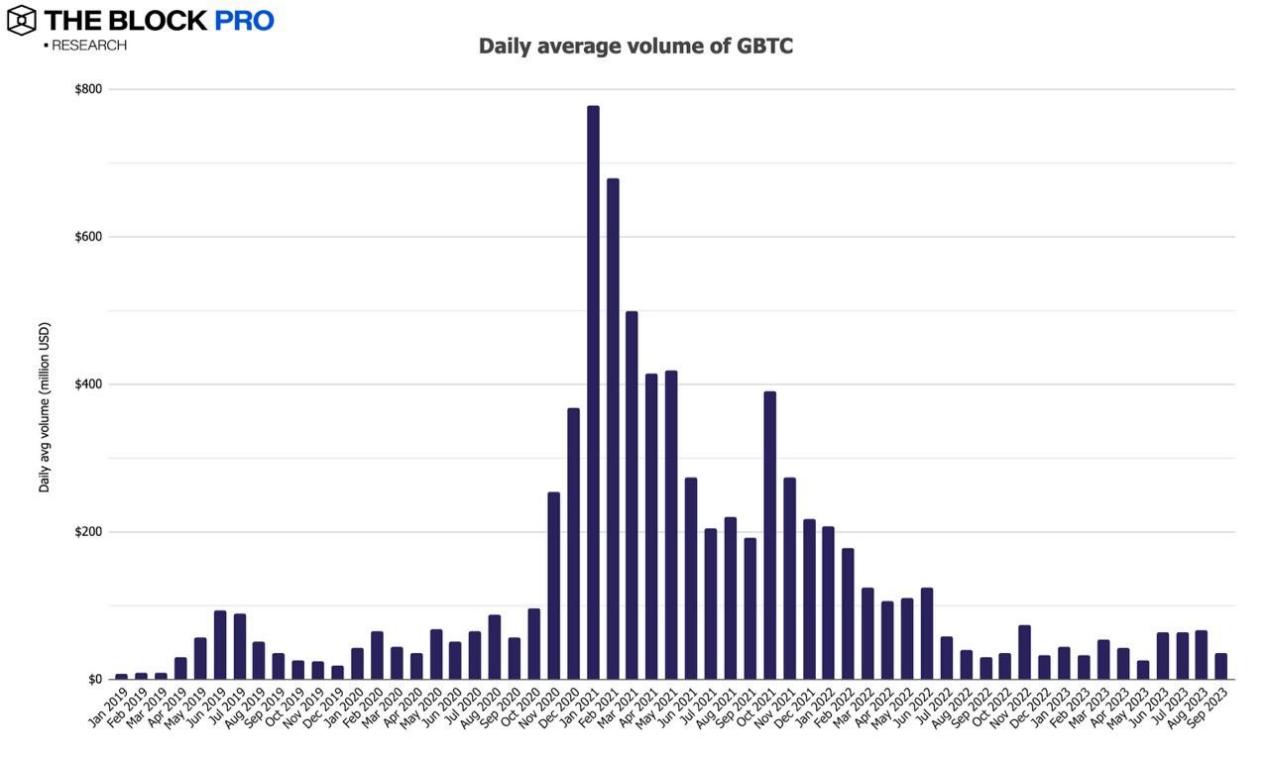
- The average daily trading volume of Grayscale's Bitcoin Trust (GBTC) nearly halved in September, dropping to $36 million, a decrease of 46.9%.
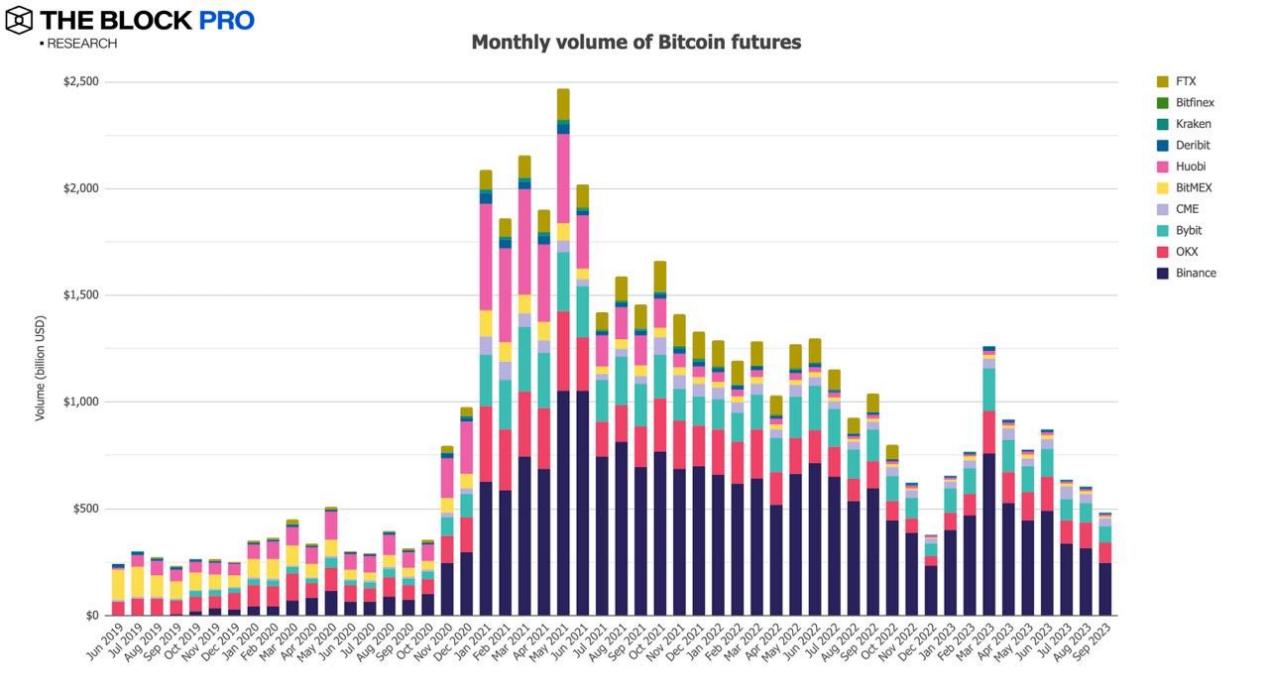
- In terms of cryptocurrency futures, Bitcoin futures open interest increased by 3.9% in September, while Ethereum futures open interest rose by 11.4%. In terms of trading volume, Bitcoin futures trading volume in September decreased by 20.2%, falling to $481 billion.
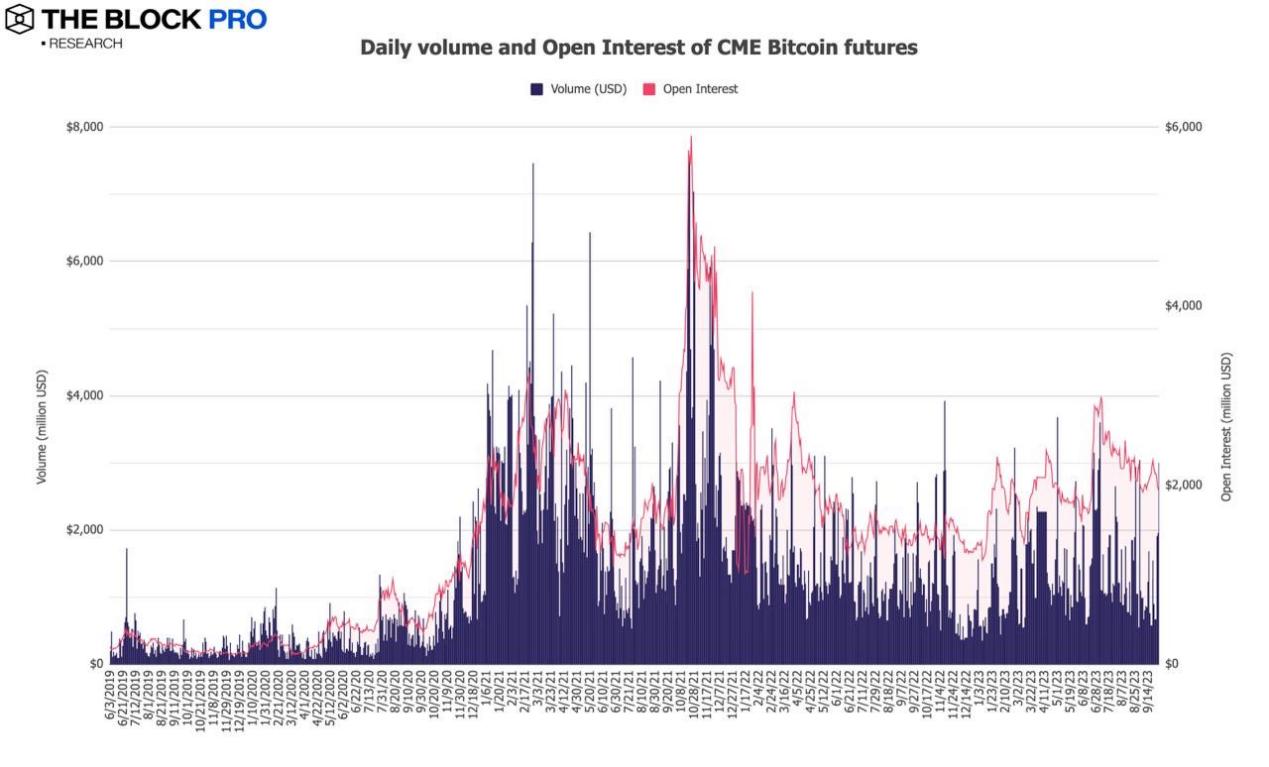
- In September, the open interest of Bitcoin futures on the Chicago Mercantile Exchange (CME) decreased by 12.8%, falling to an average daily trading volume of $1.95 billion, with a larger drop of 16%, down to approximately $1.15 billion.
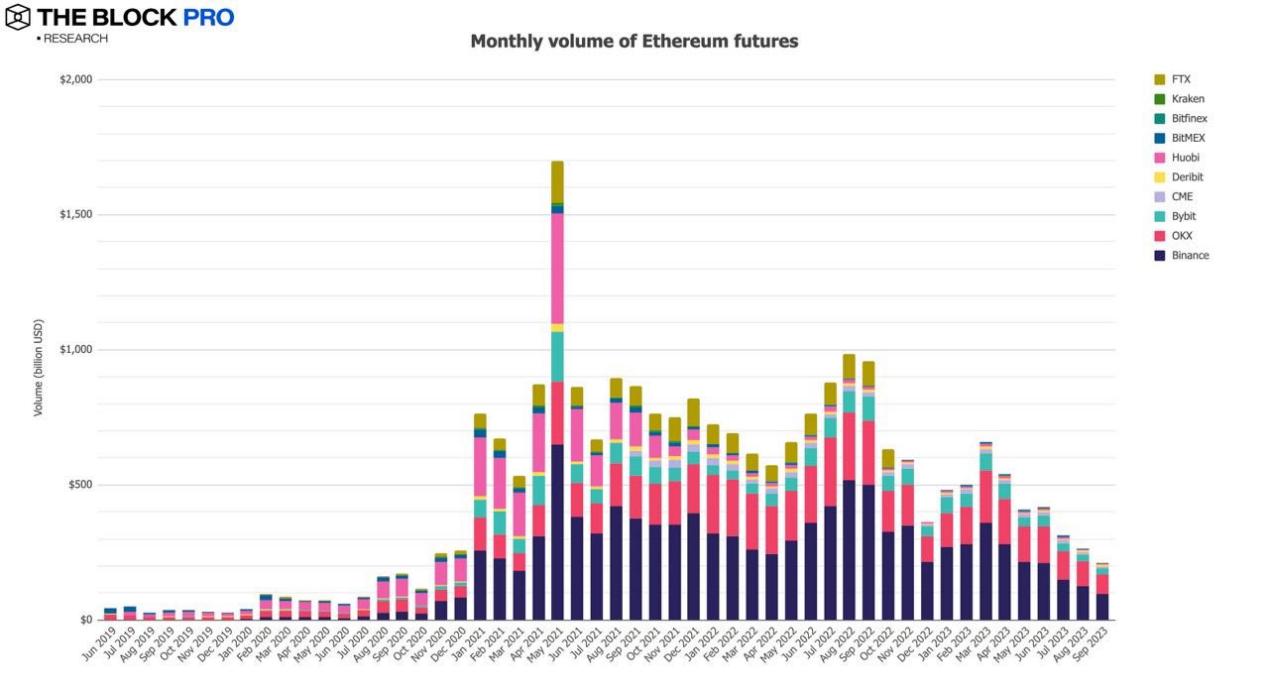
- The average monthly trading volume of Ethereum futures dropped to approximately $209.7 billion in September, a decrease of 20.6%.
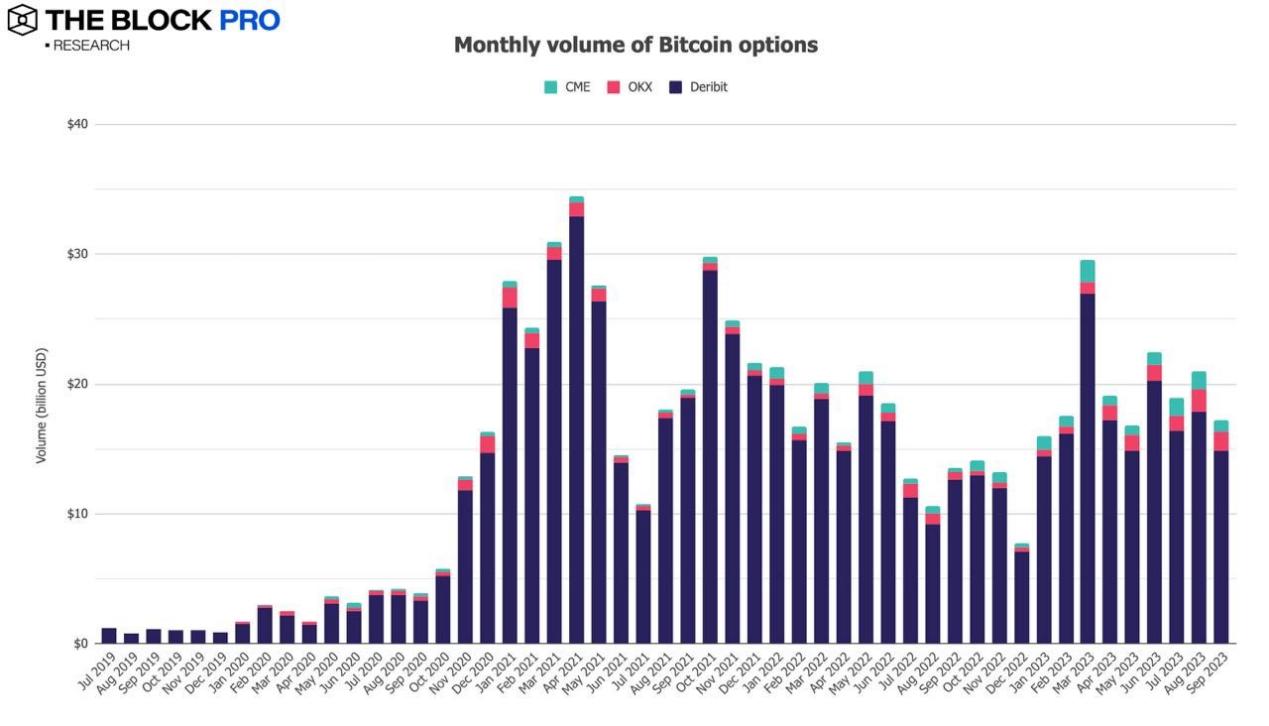
- In the cryptocurrency options market, the open interest of Bitcoin and Ethereum options saw a widespread decline in September, with Bitcoin options open interest dropping by 15.6% and Ethereum options open interest falling by 6.4%. Additionally, in terms of trading volume, Bitcoin options trading volume decreased by 17.9% in September, down to $17.3 billion, while Ethereum options trading volume fell by 10%, reducing to $10.1 billion.
 Risk warning Risk warning
Related reading

Mining company stocks are drifting further away from cryptocurrency
9 hours ago

Daily Observation of Cryptocurrency Concept Stocks: FATF Warns of Billions in "Underground Integration," Organized Crime Develops "Custom Stablecoins" to Resist Freezing
17 hours ago

The Era of Restraint: Cryptocurrency Venture Capital Risks in the First Half of 2026
2026-07-16