Metrics Ventures Market Observation: The Crypto Bull Market Has Arrived

 The bull market of 2024 has arrived, focusing on chip sentiment and continuously maintaining a high degree of alignment with the market through social experiments.
Source: Metrics Ventures
Market Observation Guide from the Secondary Fund Metrics Ventures:
After the official approval of the ETF, Bitcoin experienced slight fluctuations. The medium to long-term bullish structure is solid, and a new bull market can still be expected. Below $40,000 is a zone for accumulating positions.
Ethereum successfully broke through a year-and-a-half pressure zone, initiating a bullish technical pattern. The sentiment has been fully released, and future performance looks promising. $2,855 is the next target.
The biggest realization of 2023 is "don't overthink," just go with the flow. The 2024 bull market has arrived; pay attention to chip sentiment and continue to maintain a high degree of alignment with the market through social experiments.
This market observation was published relatively late because the author only began writing after the ETF was approved.
Before the dust settled on the ETF, even though we all knew it was highly likely to be approved, the market expectations were quite chaotic before the actual results came in. Some anticipated a large sell-off after the positive news, while others expected new funds to rush in. There were many opinions, and we didn't want to predict what would happen before the ETF was truly finalized, as anything was possible. We also didn't want to write a report only to have to tear it up and rewrite it (haha). It was better to wait for the dust to settle and then respond based on the market's real reaction.
This report focuses on market trends and trading aspects, so we won't evaluate the significant implications of the ETF approval but will highlight our general assessment of the market's major trend in the coming period.
After the ETF was finalized, BTC experienced two days of high trading volume but relatively small fluctuations, without the dramatic rises and falls that everyone defined. Instead, ETH showed a strong bullish candlestick. This trend was not beyond expectations; it was one of the scenarios that the market generally considered to have the lowest probability among many anticipated situations. Even with our understanding of the reflexivity in the crypto market, we often find ourselves pleasantly surprised by such interesting and counter-consensus movements.
Regardless, compared to the mindless guessing before the ETF approval, we believe the current medium-term market trend is relatively clear, and we have a more confident response strategy.
We often emphasize in our monthly reports that rather than predicting price fluctuations, we should focus on identifying the current market cycle's position and the distribution of chip structures.
Regarding the current position of the market cycle, we believe we are in a phase of rapid development, having reached a position close to September 2020, which is the accumulation phase before the main upward wave starts.
From the perspective of chip distribution, since the current BTC rally began, the long-term main cost zone has been around $30,000, while the short to medium-term cost has risen to around $39,000-$40,000. As can be seen from the chart below, since November 21, 2022, BTC has formed a very clear long-term ascending parallel channel lasting over a year. This parallel channel has a large amplitude but a slow slope, indicating that over the past year, BTC's chip structure has been very stable, and the trend of major funds going long has been very determined, thus forming a long-term upward trend that is much stronger than that of 2019-2020. Of course, this decisive trend is also related to the strongest expectations surrounding the ETF approval.

As for the market's general expectation that there might be a dramatic rise or fall after the ETF approval, I hesitate to predict in advance because:
Even without the interference of the ETF, BTC's price has already reached around $48,000, which is both the upper boundary of the long-term upward trend and a dense trading area from April 2021 to April 2022. The intersection of these two resistances makes it very difficult to break through even with significant positive news; at the same time, similar long-term wide fluctuations typically result in false breakouts without sufficient (lasting several months) accumulation preparation, and are likely to be pulled back to the middle of the channel (currently around $40,600). We saw that after the ETF began trading, BTC's price briefly surged to $48,000, breaking the upper boundary, but was quickly pushed back into this trading range due to intense selling pressure, which is a result of this chip distribution.
Conversely, I am also hesitant to predict a significant decline because, at the beginning of January, the market violently cleaned out leverage, causing contract rates, borrowing rates, and open interest to quickly drop to negative values. The emotional indicators cooled down before the major positive news landed, and the widespread liquidation of long positions reduced the fuel for a significant drop.
Now that the biggest stone has fallen, predicting and responding to future trends becomes even more important. I still emphasize that the bullish trend from the end of 2022 to now has proven to be very strong, and this will not change even with the positive news landing; the bull market trend is undoubtedly confirmed and will continue.
From the perspective of chip distribution, the resistance around $48,000 is significant, and the accumulation of profits is substantial. A fluctuation or pullback is reasonable. The psychological premise for dealing with fluctuations or pullbacks is that the fluctuations or pullbacks in the next month or two will be the final preparation before the market enters the main upward wave, similar to the adjustment phase after the DeFi sentiment collapse in September 2020, so there is no need to panic.
As for the pullback trend, it may follow the yellow curve in the chart above to form a converging triangle or retract to the middle of the large parallel channel (green dashed line), around $38,000-$40,000. Regardless of which specific trend occurs, as long as BTC's price approaches the weekly MA30, it will be the best buying point. Once BTC breaks through $48,000-$49,000, there will be no significant resistance below the historical high of $67,000, marking the starting point for a strong upward momentum. This moment currently seems to be something we will have to wait for until after the halving.
Since ETH has shown strong momentum, I will take a moment to discuss it separately. The long-term cost accumulation zone for ETH is around $2,140, formed by the dense cost zones in June 2021, January 2022, and April 2023. This cost accumulation zone was broken in mid-December 2023, indicating that ETH's bull market had already started at that time. This is a breakthrough against nearly a year and seven months of resistance, which is sufficient to consider it a time window for launching a comprehensive bull market.
In August 2020, ETH also broke through a new high after a year and a half, directly starting a bull market from a price of $385, but faced an adjustment in October due to the DeFi sentiment collapse. The historical cycle that ETH is currently in is also quite close to BTC's position, with no significant misalignment.
Since we say that ETH has started a comprehensive bull market in December 2023, the reason it has continued to struggle for the next month boils down to one reason, as can be seen from the chart below: the selling pressure around $2,450 is very severe and needs to be digested through continuous fluctuations. There are also claims in the market about Celsius selling coins, but I am not concerned about who sold how much ETH; the market trend will naturally answer this question. After a month of sedimentation and digestion, ETH finally broke through to a new high on January 10.
I believe that even without the BTC ETF landing or any other events, ETH would have eventually broken through on its own. However, the ETF landing quickly drove funds to push ETH to break through, which is a good opportunity. Therefore, this breakthrough for ETH is very real and strong, and in the future, regardless of fluctuations, it is unlikely to see ETH below $2,450 again.
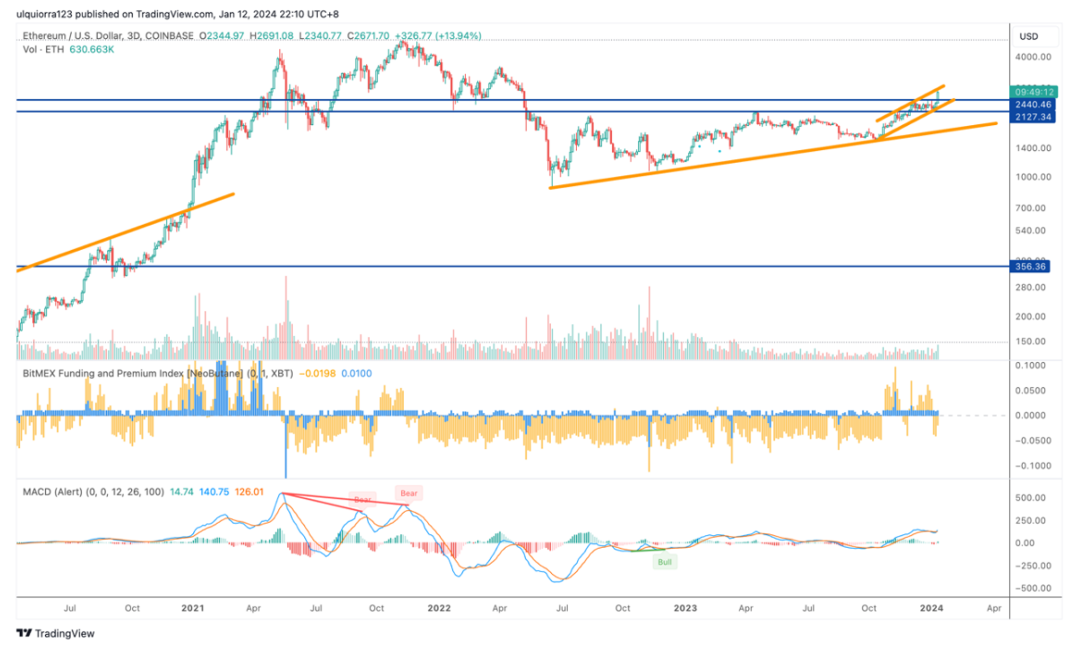
From the chart above, we can also see that ETH has formed a highly efficient parallel channel. I believe ETH will oscillate within this channel for a while, with strong resistance at the $2,855 level above. Therefore, I think that even though ETH can currently stand out and attract funds, it still needs to continue oscillating and accumulating below $2,855. Once it breaks through $2,855, we will soon see ETH at around $3,500. Rest assured, ETH holders, you will also have a (long-awaited) smooth experience like those who held Sol last year.
We have not reviewed 2023 in our monthly report. At the turn of the New Year 2023-2024, we see many friends feeling quite confused about the sudden market rhythm, the difficulty of letting go of bearish thinking, the arrogance and prejudice towards new things, and the regret of missing out, including the meme frenzy and the disillusionment of value investing during each cycle transition. None of this is important; everything is still early. However, as a fund focused on secondary investments and trading, the most important lesson we learned in 2023 is "don't overthink." Price is the output result of a series of factors such as chip structure, themes, narratives, and sentiment. Over the past year, we missed many opportunities because of thoughts like "this team is out of touch," "the fundamentals are weak," and "this is too low IQ," etc. 2023 taught us to let it ride, and we hope to invest more smoothly in 2024.
Logically, there should be some outlook for 2024 here, but we are a fund that adheres to the "Bayesian principle." The so-called Bayesian principle means that our investment behavior is based on posterior probability distributions, and we do not believe in so-called forward predictions. Many people looking back at their 2023 outlook will find it wildly inaccurate, and we believe that by the end of 2024, many will open their current well-articulated outlook and find it even more absurdly wrong. Yes, AI, multi-chain, BTC ecosystem, gaming, and so on are all themes we recognize. Is it important? Predictions of hundredfold coins for 2024? Those labeled as hundredfold coins are generally not hundredfold coins. We should continue to focus on managing the inputs and outputs of multiple factors such as chip distribution, themes, narratives, and sentiment, which is also the most interesting part of our "zeroing fund" social experiment.
Finally, I wish everyone a Happy New Year, as this year will mark the beginning of a bull market, and I also wish everyone happiness throughout the year.
 Risk warning Risk warning


Popular articles