SignalPlus Macro Analysis Special Edition: Unstoppable

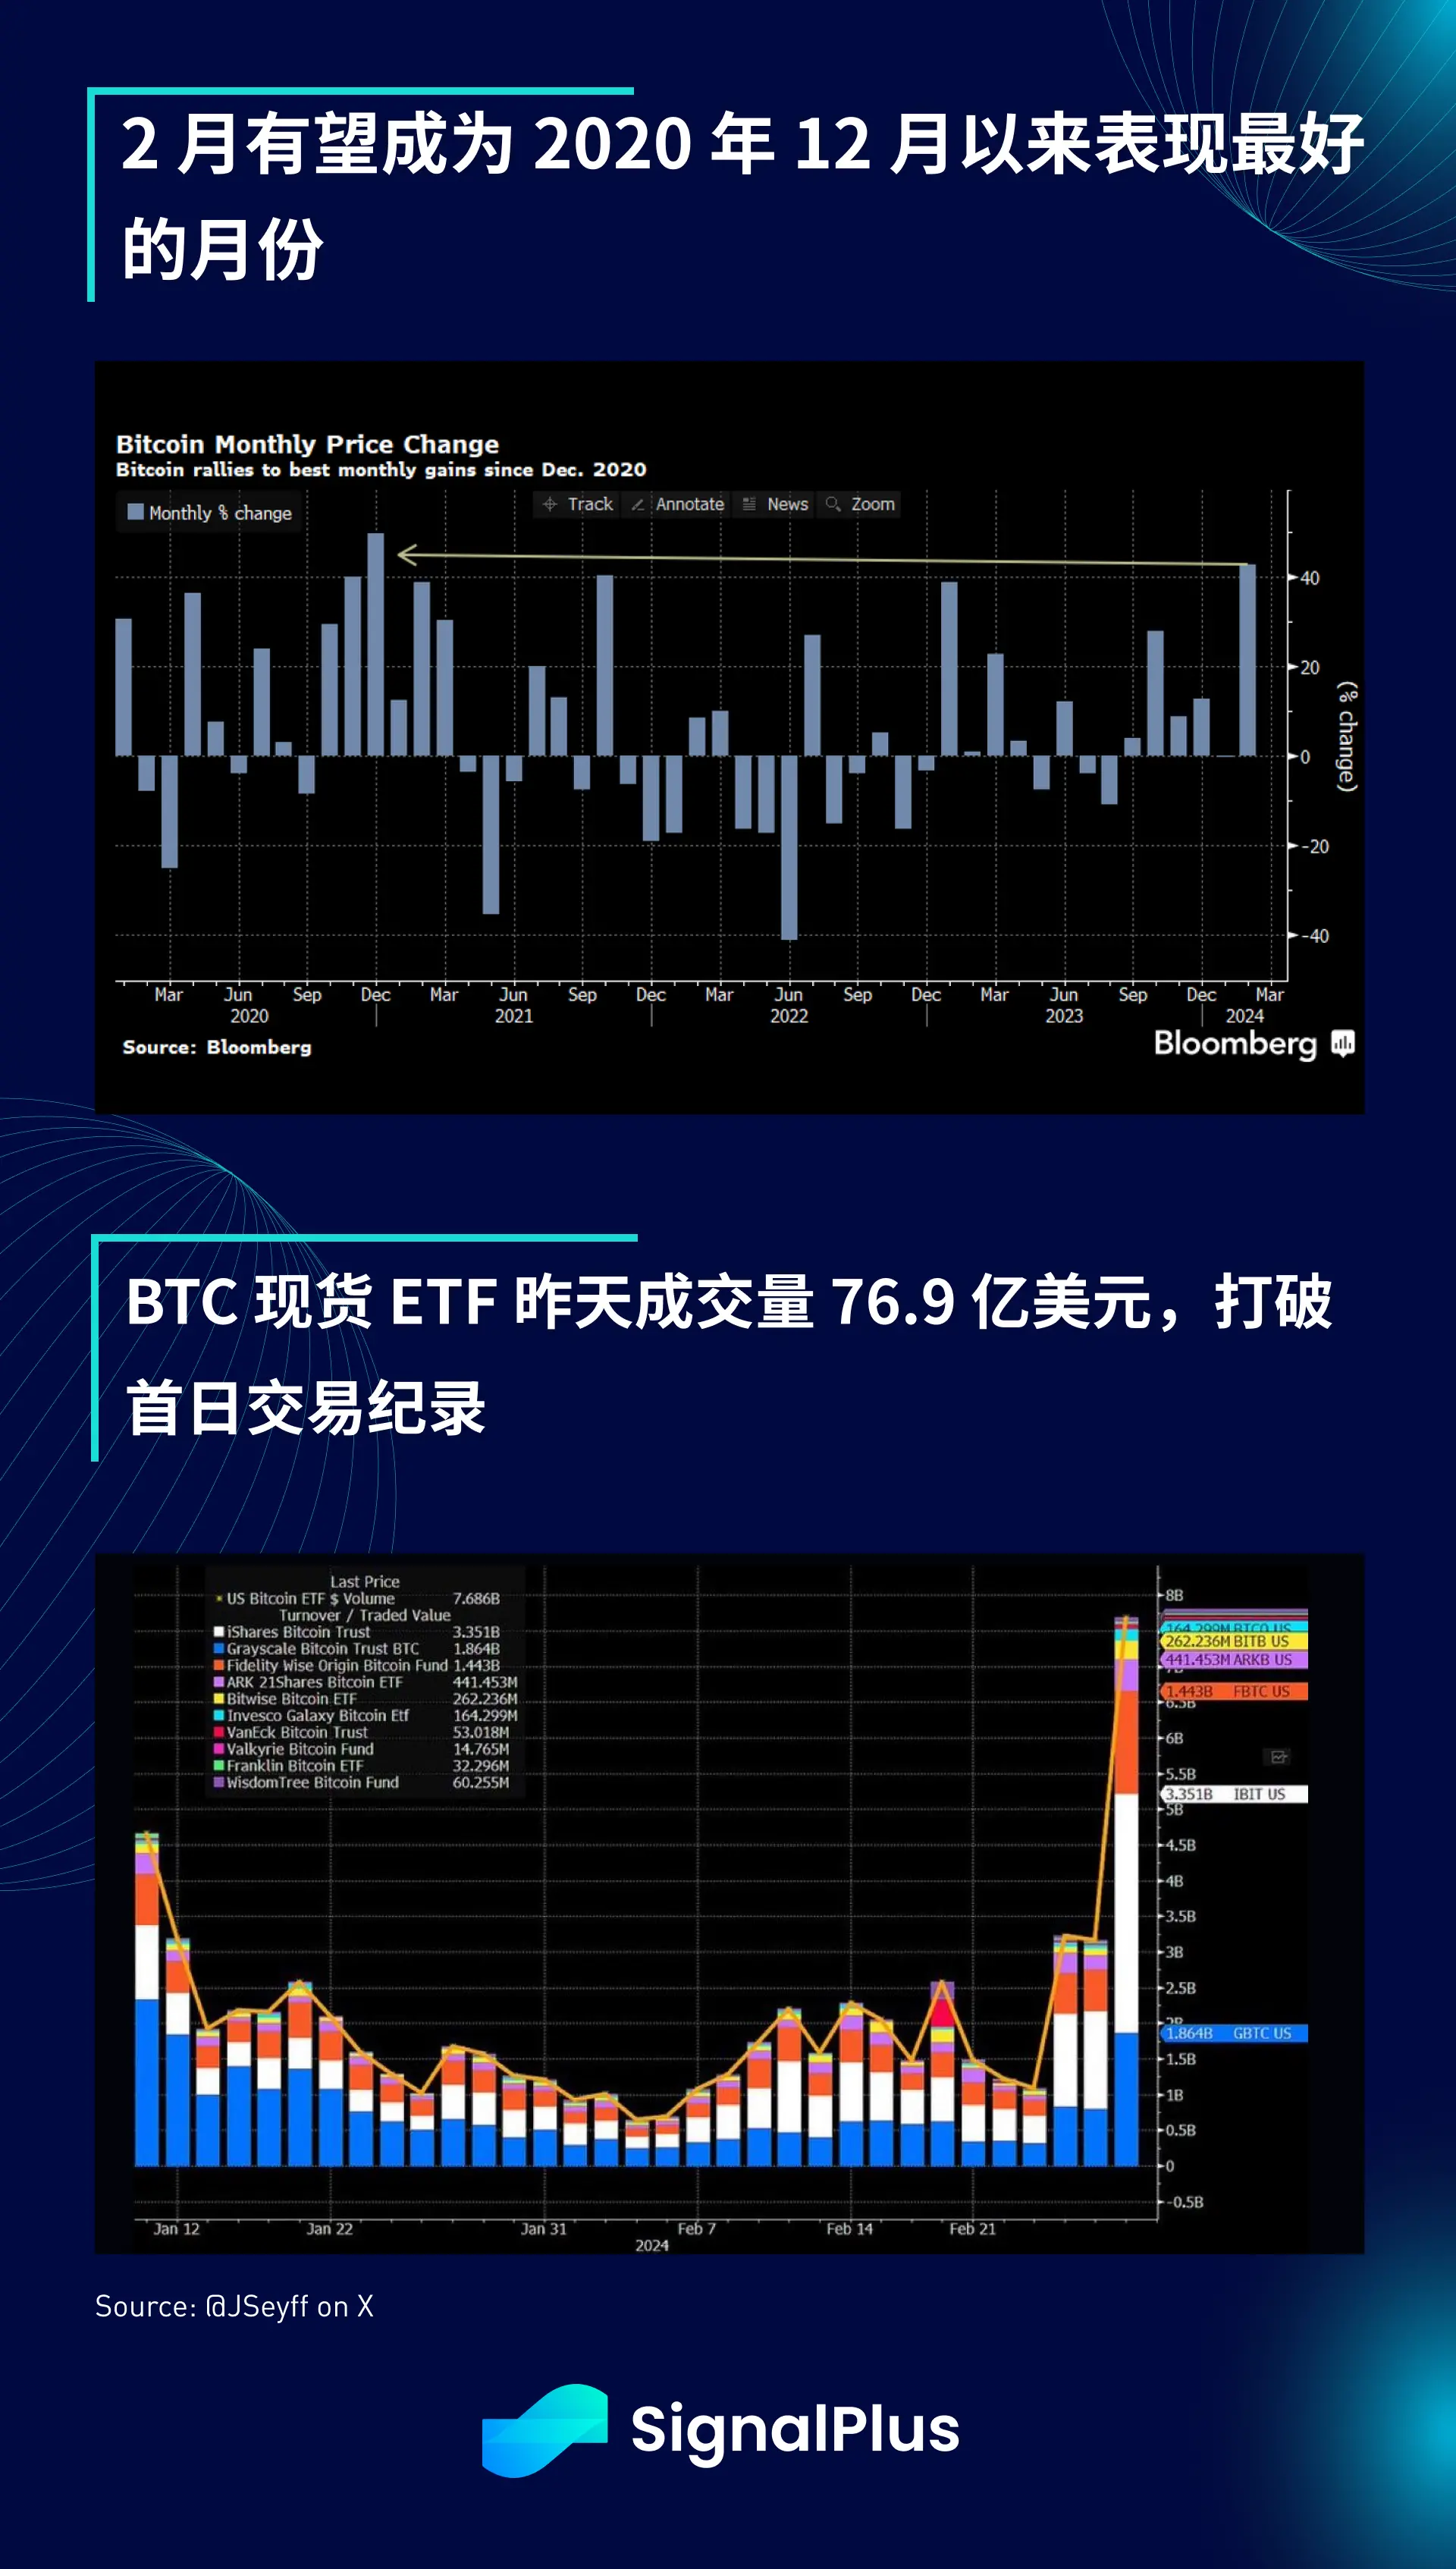
 As people began to worry that the current risk rebound might become a bubble, Bitcoin surged from around $57,000 to about $64,000 within 24 hours, with February expected to be the best-performing month for BTC since December 2020, with an increase of over 40%.


As concerns about the current risk rebound potentially leading to a bubble grow, Bitcoin surged from around $57,000 to about $64,000 within 24 hours. February is expected to become the best-performing month for BTC since December 2020, with an increase of over 40%. As the FOMO craze spreads, the trading volume of spot ETFs has also skyrocketed to $7.69 billion, far exceeding the record of $4.66 billion on the first trading day.
Retail trading activity in the U.S. is so active that the Coinbase website experienced an incident where customer balances showed as $0, causing prices to suddenly plummet over 5% from around $64,000 to about $59,000 within minutes. Coinbase CEO Brian Armstrong acknowledged this platform incident on X and reiterated that investor balances are safe, stating they were not prepared to handle a sudden increase in traffic of over 10 times, leading to widespread trading interruptions.

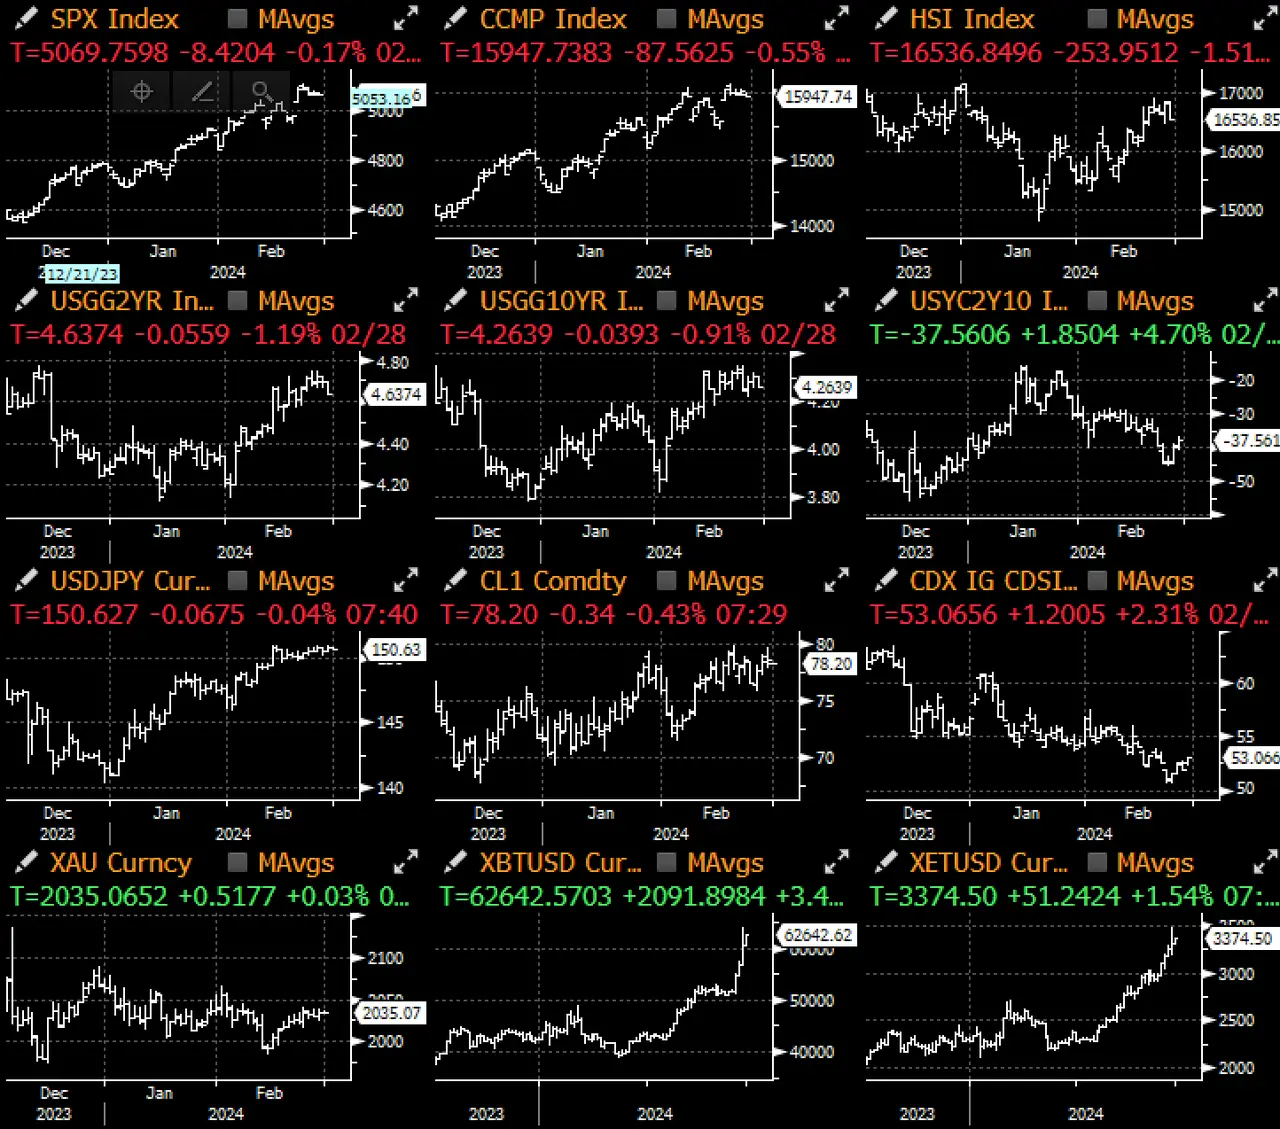
The parabolic trend of Bitcoin has prompted some macro observers to comment on the current loose financial conditions and question the rationale behind the Federal Reserve's current dovish stance. Notably, many other asset classes have also reached similar historical highs, indicating that the current "wealth effect" is not limited to cryptocurrencies.


Amidst a market filled with risk appetite, Citigroup posed an interesting question: "Where is the money coming from?" Traditional M2 liquidity indicators remain at 2023 levels, while global quantitative tightening (QT) continues unabated. The central bank's balance sheet is expected to shrink from a peak of $7.6 trillion to about $5.6 trillion by the end of the year. Therefore, unlike the zero-interest rate policy/quantitative easing era of the past decade, the current rise in asset prices is not driven by loose central bank monetary policy.

Additionally, surprisingly, despite the high market risk sentiment, the amount of cash held in money market accounts has surpassed $6 trillion, setting a historical high, and the monthly asset management scale continues to rise. If everything is rising, including stocks, credit, cryptocurrencies, and even cash, then where is the new money coming from?

The stock market is not a zero-sum game; the wealth effect can be created through GDP output or the expansion of technological productivity (AI). However, the rapid rise in stock prices with almost no pullbacks is still rare. Since the low in October, the SPX has risen over 20% (annualized over 40%!), and the realized volatility (RV) is at historical lows, which sharply contrasts with the significantly increased volatility when Bitcoin rose from $40,000 to $63,000.

As Citigroup concluded in its report, the only place where liquidity can be seen to be withdrawn is in the decline of reverse repo balances (leading the Federal Reserve to begin discussing a slowdown in quantitative tightening) and the continuously expanding fiscal deficit of the U.S. However, the decline in reverse repo balances ($1.5 trillion) and the increase in the fiscal deficit ($1.8 trillion) still lag far behind the rise in stock market value ($5.5 trillion), not to mention the performance of the credit market and the dramatic growth of the cryptocurrency market (+$0.7 trillion). Currently, aside from natural growth factors such as EPS/economic outlook/valuation multiple expansion, we do not have satisfactory answers. In any case, this is indeed a historic rebound worth recording in history, so let us enjoy this moment.


 Risk warning Risk warning