
The Great Immortal said: Bitcoin and Ethereum closed the monthly line on May 31. Will the new month bring a bull market?

 On June 12, the CPI data for May will be released. If the CPI data released in June slows down compared to the previous month, Bitcoin will surpass the historical high set in March.
Follow the trend, spend all your time studying the correct trends in the market, and if you remain consistent, profits will roll in -- Gann

On May 15, the U.S. Labor Department announced that the year-on-year Consumer Price Index (CPI) for April was 3.4%. The May CPI data will be released on June 12. If the CPI data released in June shows a slowdown compared to the previous month, Bitcoin will surpass the historical high set in March. If the CPI drops to 3.3% or lower, Bitcoin will be able to set a new historical high.
Ethereum 4-Hour Chart
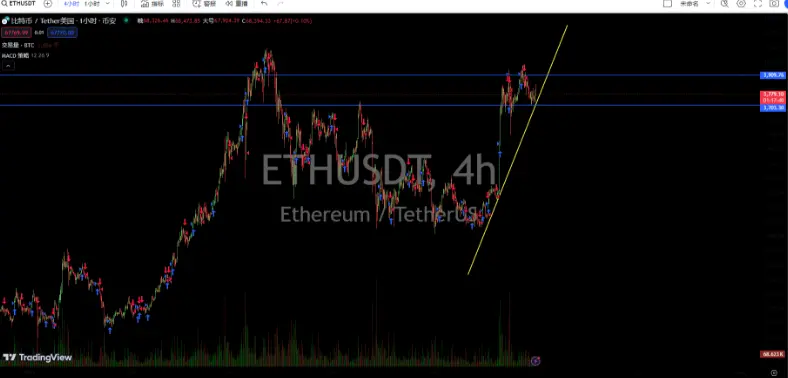
From the 4-hour chart of Ethereum, the current market trend seems to show some contradictory signals. First, from the MACD indicator, the DIF line is running below the DEA line, which usually indicates that the market is in a bearish trend. However, observing the MACD histogram, we find that the green bars have started to decrease, which may indicate that the bearish strength is gradually weakening. This could signal a potential price rebound. Another indicator worth noting is the KDJ. The K line and D line are forming a golden cross, which usually indicates that the price is about to rise. At the same time, we observe the Bollinger Bands indicator, where the current price is above the middle band and close to the upper band, indicating that the current price is at a relatively high level. However, the position of the upper band is around 3888, which may mean that the price faces some pullback pressure.
Comprehensive analysis: Based on the decreasing MACD green bars and the KDJ's upcoming golden cross signal, we can see that Ethereum's price is about to rebound. However, since the price is close to the upper band of the Bollinger Bands, if the price faces pressure at the upper band, it will encounter some pullback pressure.
Bitcoin 4-Hour Chart

From the 4-hour chart of Bitcoin, the MACD indicator shows that the DIF line and DEA line are approaching and showing a tendency to converge in recent movements, indicating that Bitcoin's price is experiencing small fluctuations in the short term, with the market currently in a wait-and-see state. The histogram shows that the current bars are running near the 0 axis and are relatively short, indicating that the buying and selling forces in the market are balanced, with no obvious strong direction. This may mean that the market is looking for a new direction, and the price may continue to consolidate sideways for a while. In the KDJ indicator, the K line value is hovering around 50, while the D line and J line values are at mid-levels, indicating that the market does not show obvious overbought or oversold conditions. This means that price fluctuations are relatively small, and market sentiment is stable. The price may continue to fluctuate within the current range until a new catalyst appears. The Bollinger Bands indicator shows that Bitcoin's price volatility is low and is running between the upper and middle bands. This indicates that the current price is at a relatively high level, but the pressure from the upper band poses a certain challenge to the price.
Comprehensive analysis: Bitcoin is currently in a consolidation pattern near the current price level, with no obvious direction in the short term. At the same time, there is relatively strong support near the middle band of the Bollinger Bands, and there is certain resistance near the upper band. If the price breaks through the upper band, there may be a new upward trend; conversely, if the price falls below the middle band, it will face further downward testing of the lower band's support.
In summary, the following suggestions are provided for reference:
Ethereum Strategy 1: Go long near 3720, target 3880, stop loss at 3690
Strategy 2: Go short near 3880, target 3720, stop loss at 3910
Bitcoin Strategy 1: Go long near 67200, target 68900, stop loss at 66750
Strategy 2: Go short near 68900, target 67200, stop loss at 69350 (the above points are as of the time of writing)
Giving you a 100% accurate suggestion is not as good as giving you the right mindset and trend. After all, teaching a man to fish is better than giving him a fish. Suggestions may earn you temporarily, but learning the mindset will earn you for a lifetime! The focus is on the mindset, grasping the trend, and planning the layout and positions. What I can do is use my practical experience to help everyone, guiding your investment decisions and management in the right direction.
Time of writing: (2024-05-31, 22:00)


