BTC Volatility Review (October 6 - October 27)
Summary:
The market has clearly indicated a high point of about $126,000 for wave B, after which the price has been testing the support level of $109,000 to $104,000 for most of the past two weeks, but has now risen again to the resistance level of $114,500 to $117,500.

2025-10-29 22:38:03
Collection
 The market has clearly indicated a high point of about $126,000 for wave B, after which the price has been testing the support level of $109,000 to $104,000 for most of the past two weeks, but has now risen again to the resistance level of $114,500 to $117,500.
Key Indicators (October 6, 4 PM HKT -> October 27, 4 PM HKT)
- BTC/USD -6.4% ($123,450 -> $115,600)
- ETH/USD -7.5% ($4,540 -> $4,200)
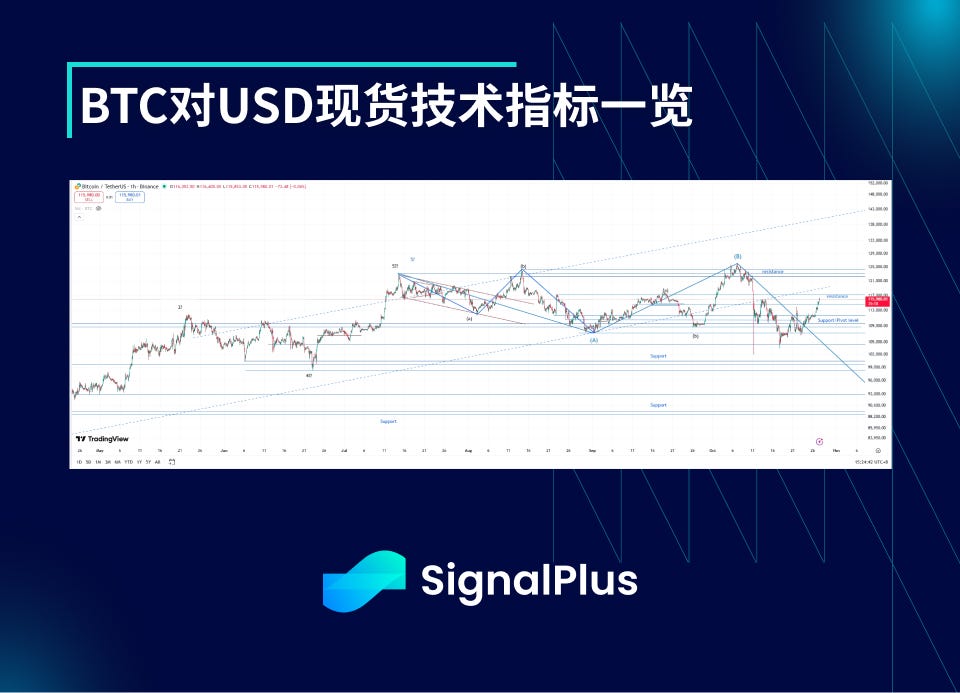
- The market has clearly indicated a B wave high point of about $126,000, after which the price has been testing support levels between $109,000 and $104,000 for most of the past two weeks, but has now rebounded to resistance levels between $114,500 and $117,500. Our view is that this is likely the second sub-wave of a large-scale five-wave downward movement below $95,000, but considering the impact of the flash crash on October 11, it is difficult to assess accurately, and there is a possibility of entering a more complex adjustment phase, which may test the B wave high point again (and then correct downward again). The support levels below are at $109,000, followed by $107,000 and $105,000 to $104,500; on the upside, the initial key resistance level is at $117,500, with stronger resistance in the $121,000 to $125,000 range.
Market Themes
- The past few weeks have been eventful for cryptocurrencies and even the global stock market. The confidence in risk assets surged at the beginning of October ("Rally October") but faltered when faced with reality, as Trump threatened via Twitter before talks with China that if no progress was made on the agreement by November 1, he would reinstate a 155% tariff. This triggered significant de-risking volatility, with cryptocurrencies being victims, as aggressive liquidations occurred during a liquidity-strapped period in the early hours of October 11 HKT, centered around Binance. BTC plummeted to a low of $102,000 (having reached as high as $123,000 that day), while some altcoins experienced even more extreme volatility. In the following days/weeks, order book liquidity significantly decreased, leading to sustained high actual volatility until macro risks stabilized, at which point liquidity finally returned to the market.
- Looking ahead, Trump and President Xi Jinping are finally scheduled to meet face-to-face in South Korea on October 30, and the main negotiating representatives from both sides have communicated on key issues, suggesting the market is preparing for an agreement. Risk assets opened strongly this week, with BTC also rebounding above $115,000. The Federal Reserve is expected to cut rates by another 25 basis points, as the committee sees no reason to deviate from the dot plot expectations from the last meeting based on last Friday's good CPI data. With quantitative tightening policies also expected to end soon (JPMorgan will hold a conference call this week), the combination of these factors along with a trade agreement could lay the groundwork for a rise in risk assets in the coming weeks, especially given the lighter market positions following this month's de-risking volatility.
BTC Implied Volatility

- Implied volatility has fluctuated greatly over the past few weeks, rebounding sharply from lows after the liquidation event on October 11, with actual volatility rising from over 20% to 50%, and then maintaining above 40% in the following 10 days due to continued thin order book liquidity. However, as the price has hovered in the wide range of $100,000 to $125,000 since May, demand for options has been relatively muted, so the level of implied volatility has not shown the significant "overshoot" relative to actual volatility that we typically see in such fluctuations.
- The term structure of implied volatility initially flattened as short-term volatility surged, mainly due to the rise in actual volatility leading to increased market demand for Gamma; but as order book liquidity returned and spot prices moved back above $110,000 to $112,000, we saw selling pressure re-emerge at the front end of the term curve, although term premiums still exist, with longer-term volatility remaining above levels prior to the entire event, naturally steepening the term curve.
BTC Skew/Kurtosis
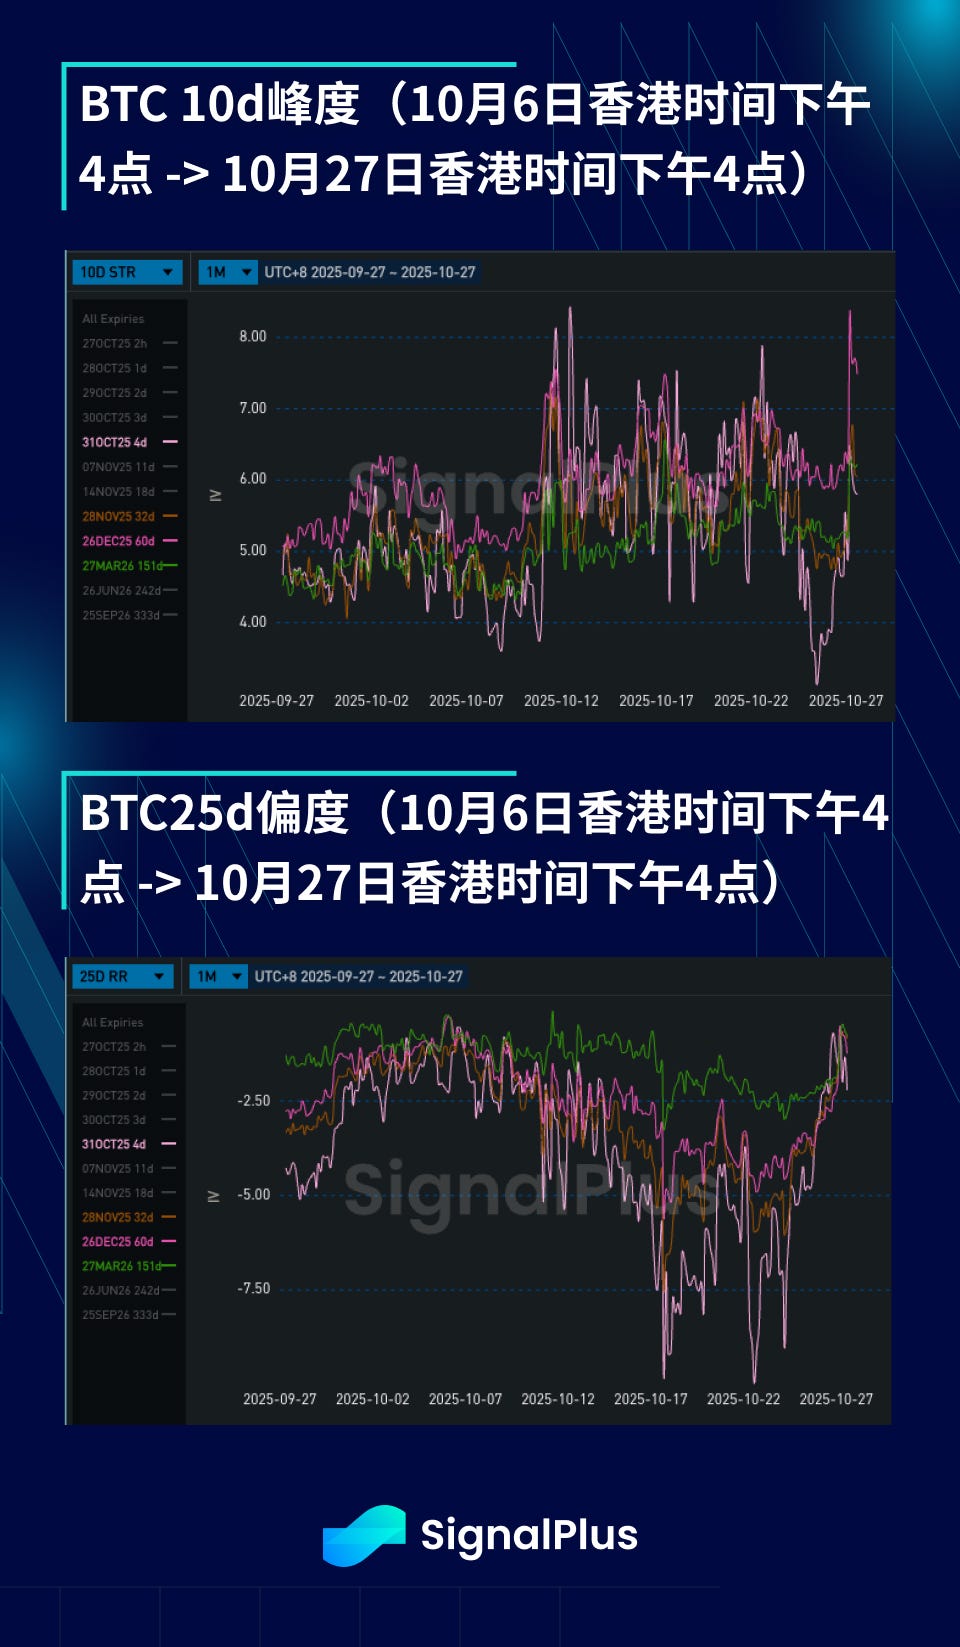
- As concerns about breaking below $100,000 have eased, and positive risk sentiment regarding U.S.-China relations this weekend has helped support spot prices back above $115,000, the skew has retreated from deep out-of-the-money put pricing levels. That said, the pricing of skew and actual performance are very consistent, with both implied and actual volatility being much higher when spot prices are low, and as prices gradually recover, both have begun to stagnate. Therefore, the skew structure leaning towards put options is likely to remain unchanged, although there may be short-term misalignments around this "fair level."
- Longer-term kurtosis prices have risen as the market has finally begun to price in "volatility of volatility" (we just witnessed actual volatility sharply leap from lows of 25-30% to 50%). Additionally, there has been demand for upside wings (call options) in the market, hoping for a significant upward breakout from the current price levels, while downside wings (put options) continue to receive support due to the evident pressure shown in previous price drop events.
Wishing you successful trading in the coming week!

 Risk warning Risk warning
Related reading

Coinbase's official silence, regulatory red lines remain unchanged: Is China really open for registration?
2026-07-16

Base founder Jesse rarely publicly admits to strategic mistakes, social dreams shattered everywhere
2026-07-16

Morning Report | Michael Saylor and Adam Back published articles opposing BIP 110; Forbes released a list of the top 10 cryptocurrencies worth investing in, including HYPE, ZEC, and others
2026-07-13