Trillion-dollar transfer scale: Who is driving on-chain transactions of USDC and USDT?
 Core Viewpoint

 This article penetrates the surface of trillion-level stablecoin transfers, analyzing the capital turnover rates of USDC and USDT, and breaking down the driving factors behind the massive transaction volumes of major mainstream public chains.
Author | Tanay Ved, Coin Metrics
Compiled by | Luffy, Foresight News
Stablecoins have evolved from trading tools into the cornerstone of on-chain liquidity, providing around-the-clock, global value storage, transfer, and settlement channels. Since 2025, the on-chain settlement scale of stablecoins has decoupled from the spot trading volume of cryptocurrencies. This year, the adjusted on-chain transfer volume of stablecoins once exceeded $250 billion daily, while exchange trading volume has dropped to about $18 billion daily.
From 2026 to the present, stablecoins have cumulatively achieved an adjusted total transfer amount of $41.7 trillion. Although the total issuance of stablecoins has recently declined, the on-chain turnover frequency of unit funds has continued to rise compared to previous years. The application scenarios are also continuously expanding, covering exchange liquidity management, DeFi collateral scheduling, as well as emerging personal payments and corporate cross-border fund flows.
This article penetrates the trillion-level stablecoin transfer surface, analyzing the turnover rates of USDC and USDT, and dissecting the driving factors behind the massive trading volumes of major public chains. The research builds on the previous article "The Peculiar Phenomenon of USDC on the Base Chain," which found that about 50% of USDC transfers on the Base Layer 2 network come from DeFi infrastructure (DEX market making, flash loans). We conducted a bottom-up analysis of the transfer composition of USDC and USDT on Ethereum, Base, and Tron.
Issuance and Turnover Rate
Issuance represents the monetary base scale of stablecoins, while turnover rate measures the frequency of funds being transferred on-chain. By combining these two indicators, one can determine whether stablecoins are in a state of frequent circulation or simply idle as a value storage tool. This distinction is also the core of the "CLARITY Act," which encourages incentives based on real trading activities and does not encourage merely holding tokens to earn returns.
From this perspective, USDC has a significant advantage. Data from 2026 shows that the annualized (adjusted supply) turnover rate of USDC is 741 times, reaching ten times that of USDT (74 times), even though USDT's market capitalization exceeds $100 billion. This means that, relative to the total circulation, the on-chain turnover frequency of USDC is much higher than that of USDT.
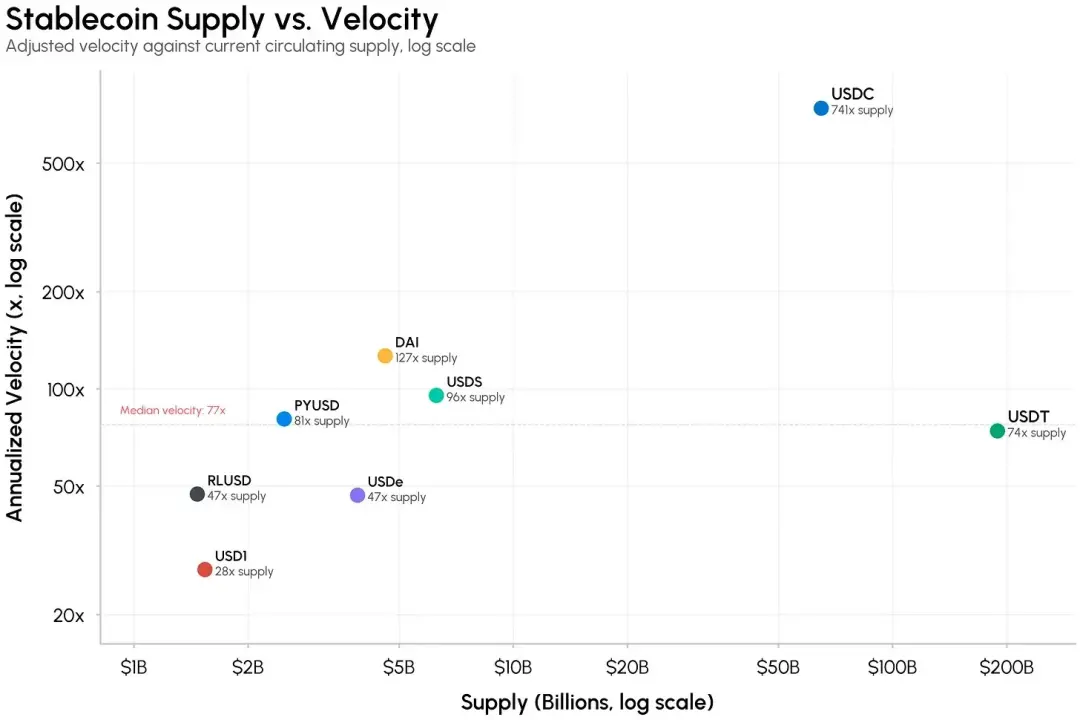
Issuance and Turnover Rate of Stablecoins
The implementation of the "GENIUS Act" in 2025 brought regulatory benefits to USDC, continuously consolidating its network effects in the compliant market in the U.S., DeFi, and institutional settlement fields. In contrast, USDT's advantages stem from its first-mover advantage, demand in emerging overseas markets, and deep binding to the Tron chain, where there is strong demand for dollar assets and cross-border remittances.
USDC, issued by Circle, surpassed USDT in adjusted total transfer volume as early as 2024, and the lead has continued to expand this year. As of August 2026, USDC's cumulative settlement transfer scale reached $32 trillion, accounting for 77% of the stablecoin market; USDT's transfer scale was $8 trillion, accounting for 19%. Although USDC still leads, the gap between the two is narrowing, with USDC's daily transfer volume falling below $100 billion.
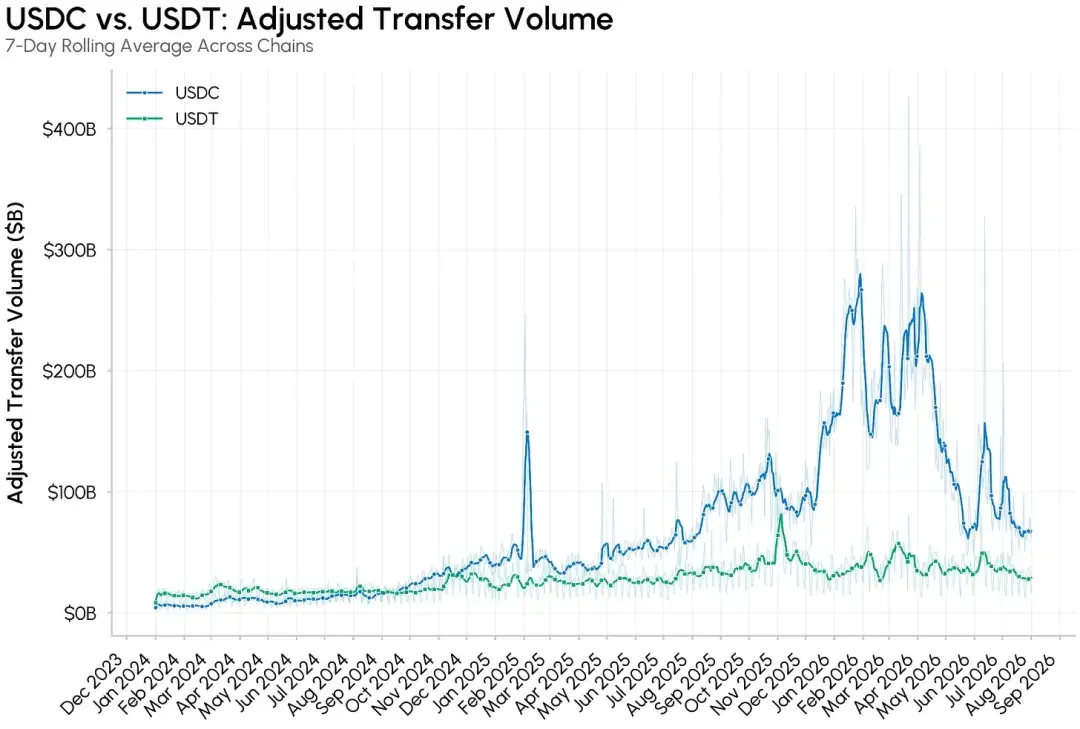
Adjusted Transfer Volume of USDC and USDT
According to Circle's Q2 2026 financial report, USDC's on-chain transaction scale in Q2 grew by 151% year-on-year, reaching $14.8 trillion, but the growth rate of circulating supply is far below that of transactions. Currently, about 95% of Circle's revenue still comes from reserve interest rather than transaction fees. Circle's self-developed Layer 1 public chain, Arc, is an important layout for creating sources of transaction fee revenue. Therefore, clarifying the underlying driving factors of USDC's transaction volume is of great significance.
The following will break down the transaction composition of USDC on Ethereum and Base networks, as well as USDT on Ethereum and Tron chains, which carry the vast majority of stablecoin transfer activities.
Transfer Composition of USDC and USDT
To explore the reasons behind the massive trading volume, we continue the research framework of USDC on the Base chain, employing a bottom-up analysis method. For each public chain and each stablecoin, we identify the core contracts that generate high-frequency mechanical transfers: leading protocols in flash loan lending markets, large liquidity pools of mainstream DEXs on each chain, and known exchange wallet addresses. All transactions are categorized into three types: flash loans, DEX liquidity provision, and centralized exchange fund transfers.
The research is based on Talos's original transfer data, which statistics the proportion of each type of transaction in the total transfer scale of the public chain. The marked classification is only a lower limit estimate, with the remaining portion including unidentified behaviors: payments, cross-chain bridge transfers, treasury fund scheduling, and other various settlement activities.
USDC on the Base Chain
The Layer 2 network Base launched by Coinbase is the main battlefield for USDC transfers in 2026. Transactions are highly concentrated, with over 90% of USDC transfers on the Base chain completed through three contracts. Throughout the year, the Aerodrome decentralized exchange contributed the largest trading volume for liquidity market making; in the second half of the year, flash loan arbitrage activities relying on the Morpho protocol rapidly rose. In June, the daily flash loan transfer scale once exceeded $500 billion. Base's low fees and ample USDC liquidity are suitable for large-scale high-frequency automated strategy operations.
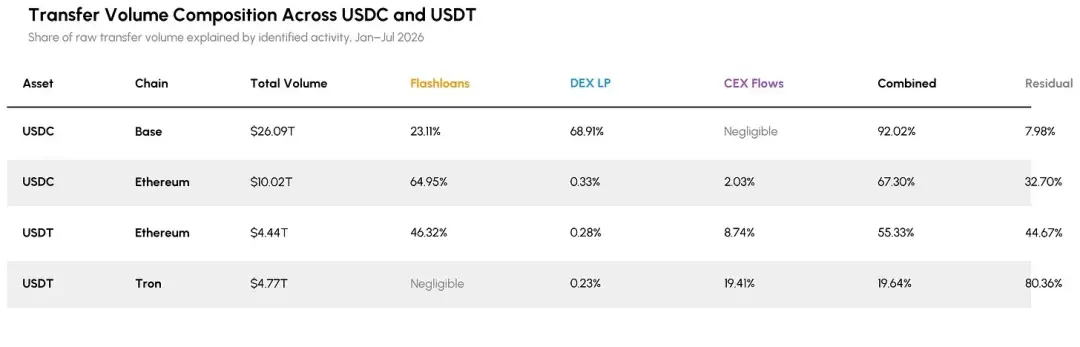
· Flash loans, 23%: Bots complete unsecured borrowing and repayment within a single transaction, leveraging Morpho's unified contract to execute cross-market arbitrage;
· DEX liquidity provision, 69%: Automated strategies continuously adjust the liquidity of Aerodrome's two major liquidity pools with price fluctuations, creating massive notional trading volume, but net funds and positions remain almost unchanged;
· Others, about 8%: Activities outside the marked flash loan and liquidity pool contracts.
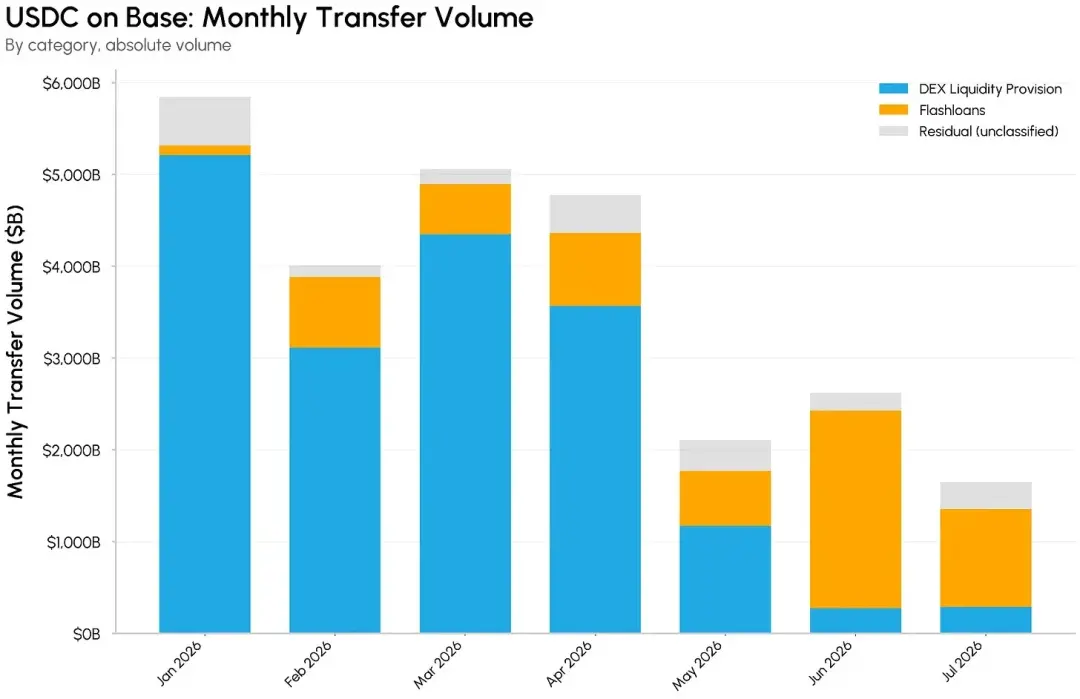
Monthly Trading Volume of USDC on the Base Chain
USDC on Ethereum
USDC transactions on the Ethereum chain are more concentrated in flash loans, accounting for 65% of the total transfer volume, nearly three times that of the Base chain. Ethereum's USDC liquidity is deep, and the lending ecosystem is well-developed, making it suitable for large-scale flash loan arbitrage; however, high gas fees make it difficult to support the continuous liquidity rebalancing behavior seen on the Base network.
· Flash loans: 65%;
· DEX liquidity provision: 0.3%;
· Centralized exchange fund transfers: 2%;
· Other unclassified activities: about 33%.
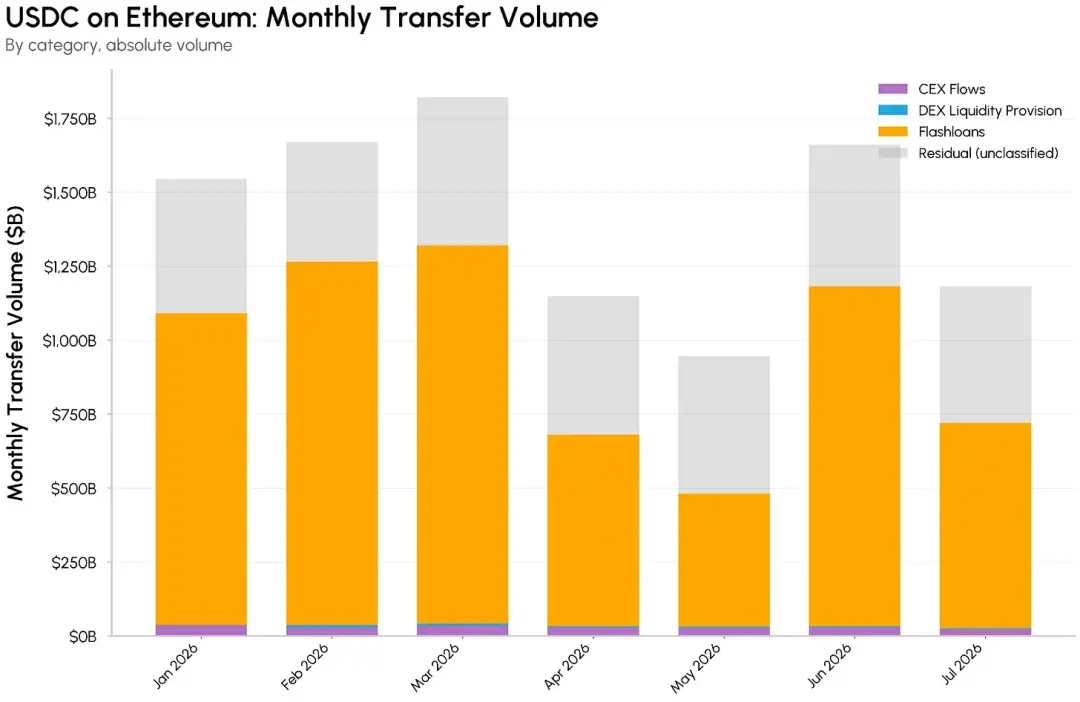
Monthly Trading Volume of USDC on Ethereum
USDT on Ethereum
Flash loans also occupy an important share of Ethereum's USDT trading volume, but the proportion is lower than that of USDC on the same chain. Centralized exchange fund transfers account for a higher proportion, aligning with USDT's long-term positioning in serving exchange settlements and liquidity allocation. The statistical scope includes known deposit and withdrawal wallets of centralized exchanges such as Binance and OKX, covering user deposits and withdrawals as well as internal transfers between exchange hot and cold wallets.
· Flash loans, 46%;
· DEX liquidity provision, 0.3%: primarily for the Uniswap V3 USDT/WETH trading pool;
· Centralized exchange fund transfers, 9%: covering deposit and withdrawal flows from over 30 centralized exchange wallets;
· Other unclassified activities, about 45%.
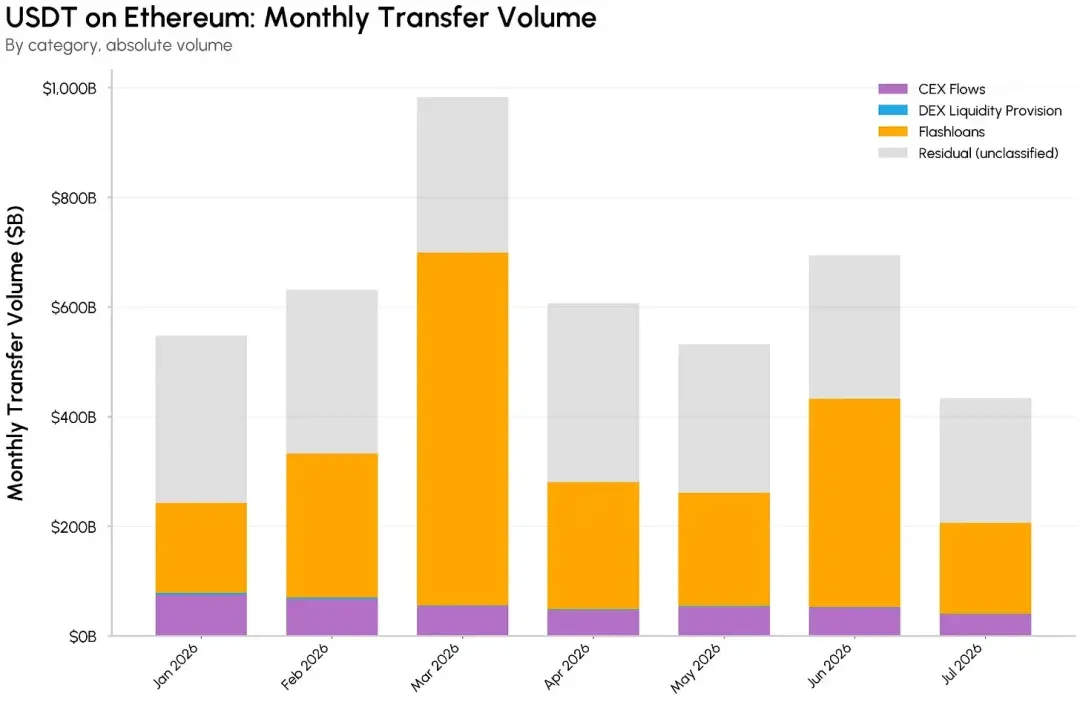
Monthly Trading Volume of USDT on Ethereum
USDT on Tron
The usage pattern of USDT on the Tron chain is entirely different. Flash loan and DEX market-making activities that drive large trading volumes on Base and Ethereum are almost negligible. Among the identified flows, centralized exchange fund transfers account for the highest proportion, reflecting Tron as a low-cost channel accommodating a large volume of exchange deposit and withdrawal business. The proportion of unclassified flow is as high as 80%, the highest among all statistical chains, likely including cross-border remittances and various payment scenarios.
· Flash loans, almost no scale: Lending protocols like JustLend have not generated significant related trading volume;
· DEX liquidity provision, 0.2%: distributed across four Sunswap trading pools;
· Centralized exchange fund transfers, 19%: covering deposit and withdrawal flows from 33 overseas exchanges including Binance, OKX, and Bybit;
· Other unclassified activities, about 80%.
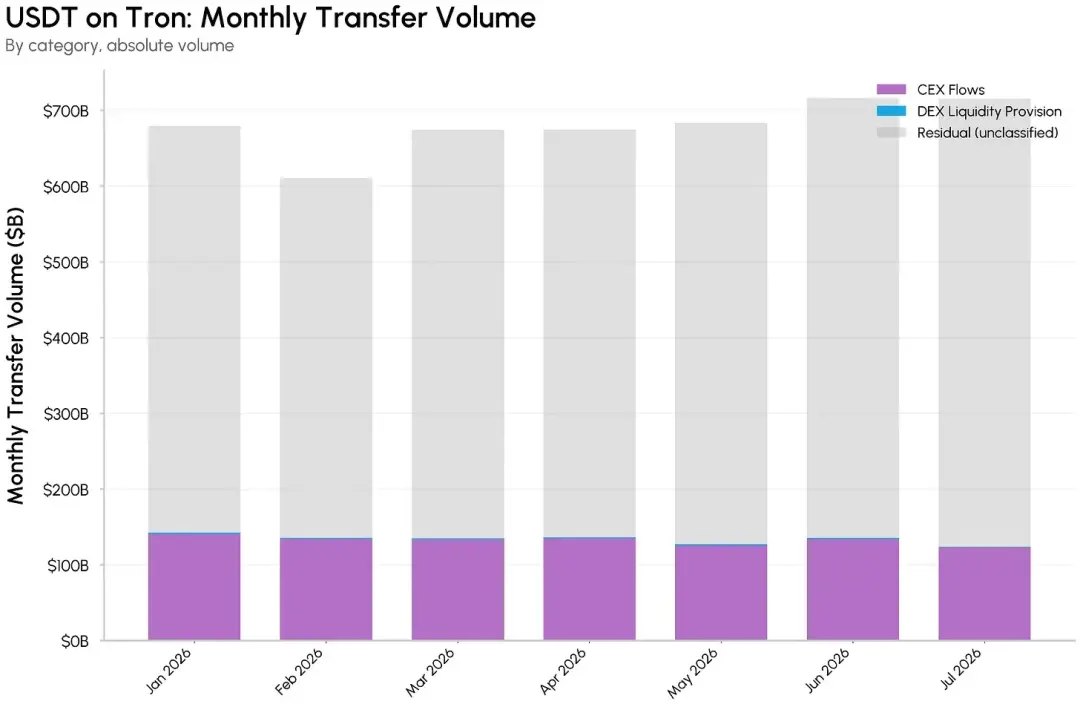
Monthly Trading Volume of USDT on Tron
The analysis results clearly show the structural differences in stablecoin ecosystems across different public chains. USDC trading volume on Base and Ethereum is primarily driven by flash loans and liquidity rebalancing; Ethereum's USDT balances flash loans and exchange fund transfers; Tron USDT has almost no large-scale DeFi trading while having the largest unmarked trading volume.
Conclusion
The scale of stablecoin on-chain transfers has reached a considerable level, often being compared to global mainstream payment networks. However, the vast majority of current trading volume essentially represents internal liquidity scheduling within the crypto market: liquidity deployment and rebalancing, arbitrage execution, and cross-platform fund settlement. These applications are real and effective, enhancing the liquidity, trading efficiency, and global accessibility of the crypto asset market.
At the same time, one cannot simply equate the surface-level massive transfer volume with personal payments or real economic activities. At this stage, stablecoins serve more as the underlying settlement layer of the crypto asset market, while payments, cross-border remittances, and corporate B2B scenarios are still being cultivated. Looking ahead, the quality of stablecoin transactions will be as important as the transaction scale. The differences in issuance and turnover rates can intuitively reflect how stablecoin funds circulate and allocate within the crypto market.

 Risk warning