Galaxy Research Report: The Profit and Loss Truth of Retail Investors Behind 1.27 Billion Transactions on Polymarket
 Core Viewpoint

 Galaxy analysis of 2.9 million accounts found that nearly 70% of retail investors on Polymarket incurred losses, totaling $339 million, and there are significant differences in profitability ratios across different trading sectors.
Author: Will Owens, Analyst at Galaxy Research
Compiled by: Jiahua, ChainCatcher
Introduction
Since its launch in 2020, the international version of Polymarket has matched 1.27 billion orders for 3.07 million wallets, with a nominal trading volume of $82.8 billion. As all transactions are settled on-chain, we can view the complete records, including every position, purchase price, holding time, and settlement income, allowing us to understand user behavior in the prediction market. This report narrows its focus to 2.9 million accounts whose trading patterns align with manual operation characteristics.
This report poses five questions regarding these accounts: After making a profit, do traders cash out or continue to ride the wave? Does profit make them bolder, while losses make them more conservative? How are profits and losses distributed? Do traders typically focus on specific areas, and does this focus yield better returns? What are the differences between profitable and losing traders?
Studying retail trading behavior typically relies on information disclosed by brokers or survey data. However, since Polymarket settles on-chain, there is no need to debate the reasonableness of the sampling scope.
The core conclusion is that 69% of retail accounts ultimately incur losses, with this group collectively losing $339 million.
In 2024, Polymarket is primarily known for the U.S. election night. Subsequently, the company returned to the U.S. market through a subsidiary licensed by the Commodity Futures Trading Commission (CFTC) and introduced a transaction fee for the first time in early 2026. The discussion below pertains to the international version of the platform, which is a completely independent trading platform from the U.S. version app, each having its own order book.
Earlier this year, Polymarket adjusted its fee structure. Since the data in this report covers the platform's complete history, some accounts conducted all their transactions before the platform began charging fees.
This is also the first complete NFL season since both Polymarket and its competitor Kalshi entered the U.S. market. Both platforms have increased their investments accordingly. At the start of the season, Polymarket invited sports stars such as LeBron James, Eli Manning, and Derek Jeter as "promotional partners," which also sparked some opposition.
Along with this promotional campaign, a social feature called Squads was launched within the U.S. version app. Squads are private groups where users can discuss the prediction market and trade based on the choices of other members, all without leaving Polymarket. This feature aims to bring discussions from group chats onto the platform. Another platform has also begun to incorporate social trading features, a similar trend can be seen in pump.fun's recent announcement.
Faced with such a large potential trading volume, both platforms are spending money to expand their user base, attracting precisely the type of traders with the worst profit performance in this report. It remains to be seen whether the composition of traders will change significantly in the coming year or if it will simply see a substantial increase in numbers.
Key Summary
Among 2.9 million "retail" accounts, 69.2% ultimately incur losses.
This group collectively lost $338.9 million.
Losses seem to increase user churn rates.
After incurring a loss, 15.2% of accounts did not trade again within 30 days.
After making a profit, this rate is 6.1%.
If traders may indeed have an advantage in a particular area, focusing on that area can yield better returns.
44.1% of traders concentrated over 60% of their trading activity in one area.
Traders focused on sports performed the worst, possibly because many of them are just amateurs or occasional participants, rather than market makers or arbitrageurs.
Traders focused on technology and science performed the best, with some possibly having insider information, while others may be experts in related fields.
Profitable traders tend to invest larger amounts per trade.
The median amount per position for profitable traders is $13.96, while for losing traders it is $10.
Research Methodology
Dataset: Polymarket settles on-chain, meaning that the complete records of every order, position, purchase price, and settlement income are publicly available. All analyses in this report are based on these records.
Research Subjects: We aim to study human behavior, so we need to exclude automated accounts that trade via scripts. While it is impossible to accurately determine which accounts are using automated trading, we can estimate this through "orders per active day." This metric equals the total number of orders for an account divided by the number of days the account has actually traded.
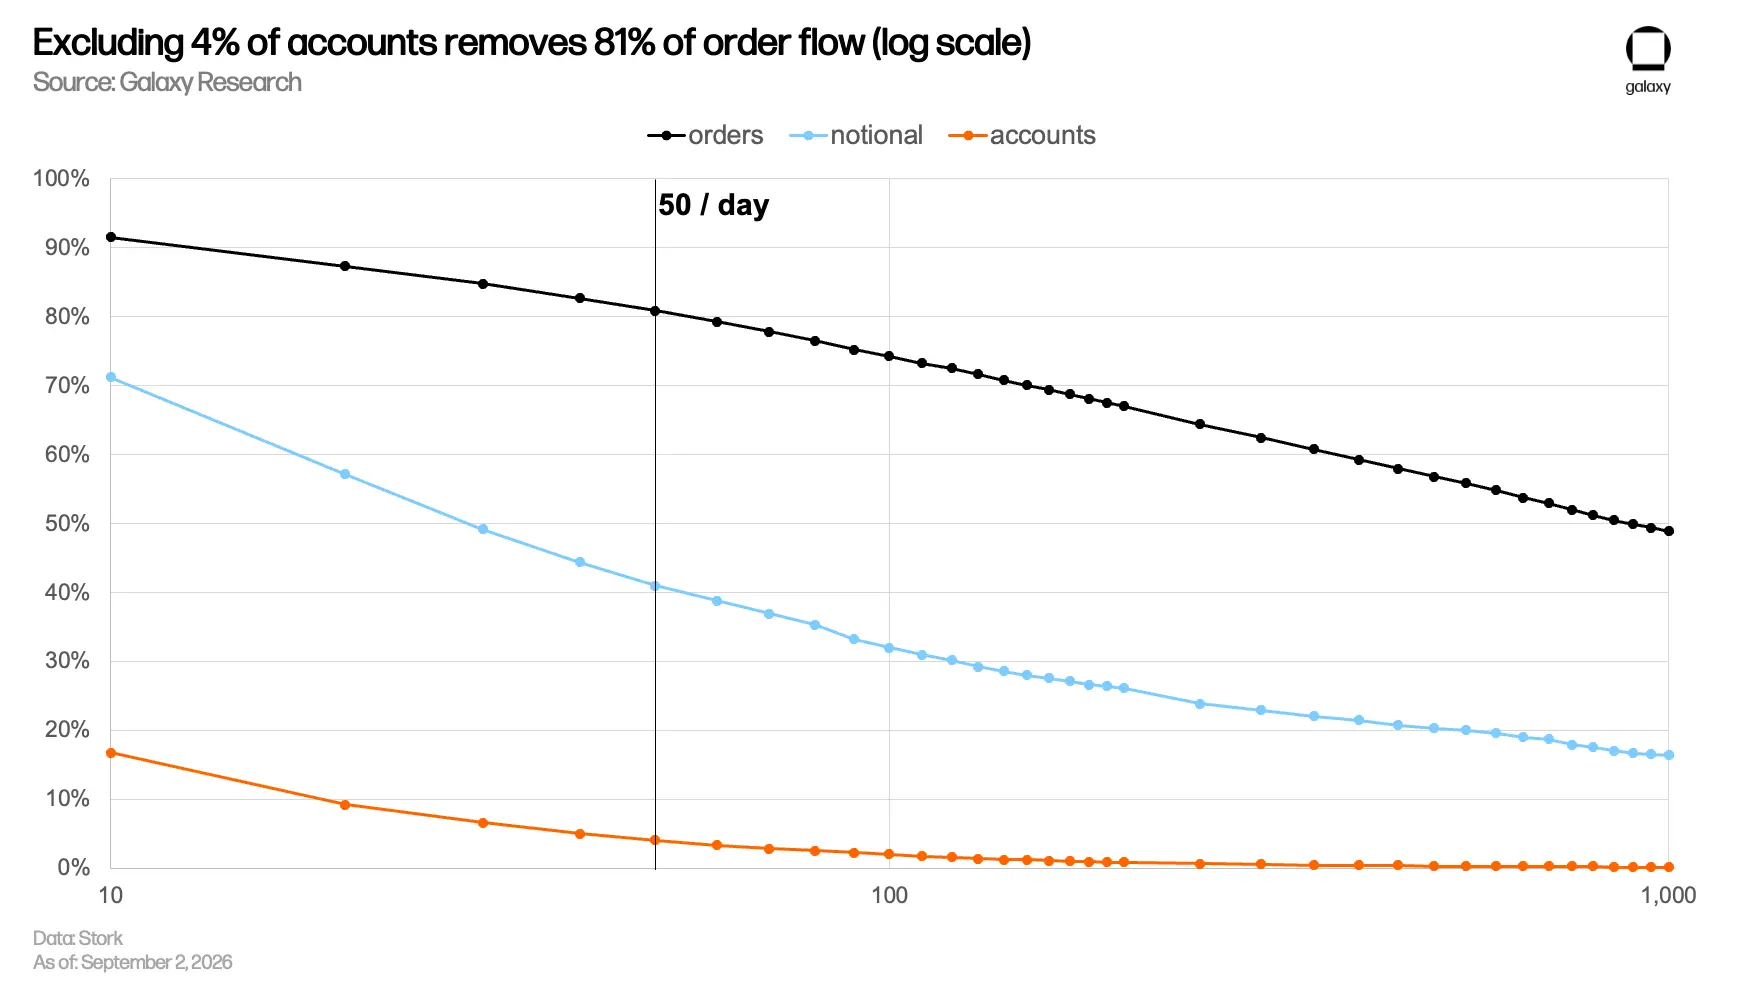
The number of orders per active day follows a continuous distribution without a natural cutoff point. Therefore, the criteria for division must be determined by the researcher. We set the cutoff at 50 orders per active day, excluding 125,429 accounts, which account for 4.1% of the total. Although these accounts "only" represent 4.1%, they contributed 80.8% of all orders and 41% of the nominal trading volume. This filtering method is designed to identify the situation where a small number of accounts account for a significant proportion of trading activity.
Retail Traders: Our filtering criterion is trading frequency. Even if a trader has sufficient funds, as long as they make their own judgments and manually place orders, they will be classified as retail traders here. Therefore, the research conclusions pertain to accounts that trade at a manual pace, rather than the economically strictly defined "retail traders."
Profit Measurement: As long as the value of an account's position at settlement is higher than its purchase cost, we consider it profitable, regardless of whether the holder actually redeems it. Positions that expire worthless are usually not redeemed, and if we only count redemption records, most losses would be excluded, making this group’s profit performance appear better than it actually is.
An important limitation of this report is that we identify traders by wallet addresses but cannot reliably determine whether two addresses belong to the same person. Therefore, a person trading with multiple wallets will be counted as "multiple accounts" in this analysis.
It is especially important to note this when understanding the conclusion that "losers are more likely to stop trading." An account that appears to have exited may simply have switched to a new wallet.
How are profits and losses distributed?
Among retail accounts, 69.2% ultimately incur losses. This group collectively lost $338.9 million.
The median profit and loss for retail accounts is approximately a loss of $3, with half of the accounts' profits and losses ranging between a loss of $36.64 and a profit of $0.40. These amounts are not enough to change anyone's life. As expected, larger profits and losses are concentrated at the ends of the distribution: the 1st percentile accounts lost $4,804, while the 99th percentile accounts made a profit of $3,381.
In terms of invested amount, accounts at the median lost about 0.5% of their invested funds, while accounts at the 10th percentile lost 90%. Overall, the vast majority of accounts lost only a small amount of money, with only a few accounts losing thousands of dollars.
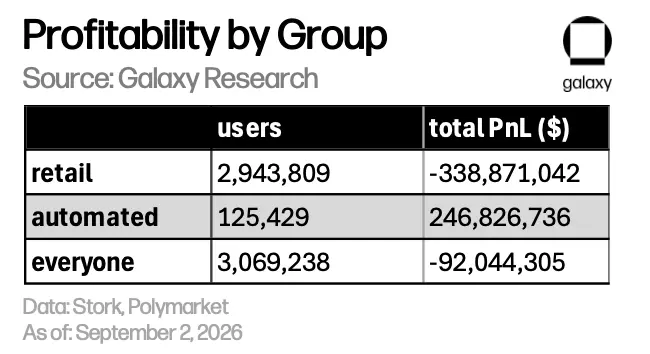
We classified 125,429 accounts as "automated accounts," which ultimately made a collective profit of $246.8 million. Their profit and loss distribution also aligns with expectations: a large number of accounts earn trading rewards through repeated trading, while accounts truly engaged in market making and arbitrage are much fewer.
The profits and losses of these two groups do not completely offset each other. About $92 million of the difference comes from factors outside the trader group, mainly from unsettled positions.
After making money, do traders cash out or continue trading?
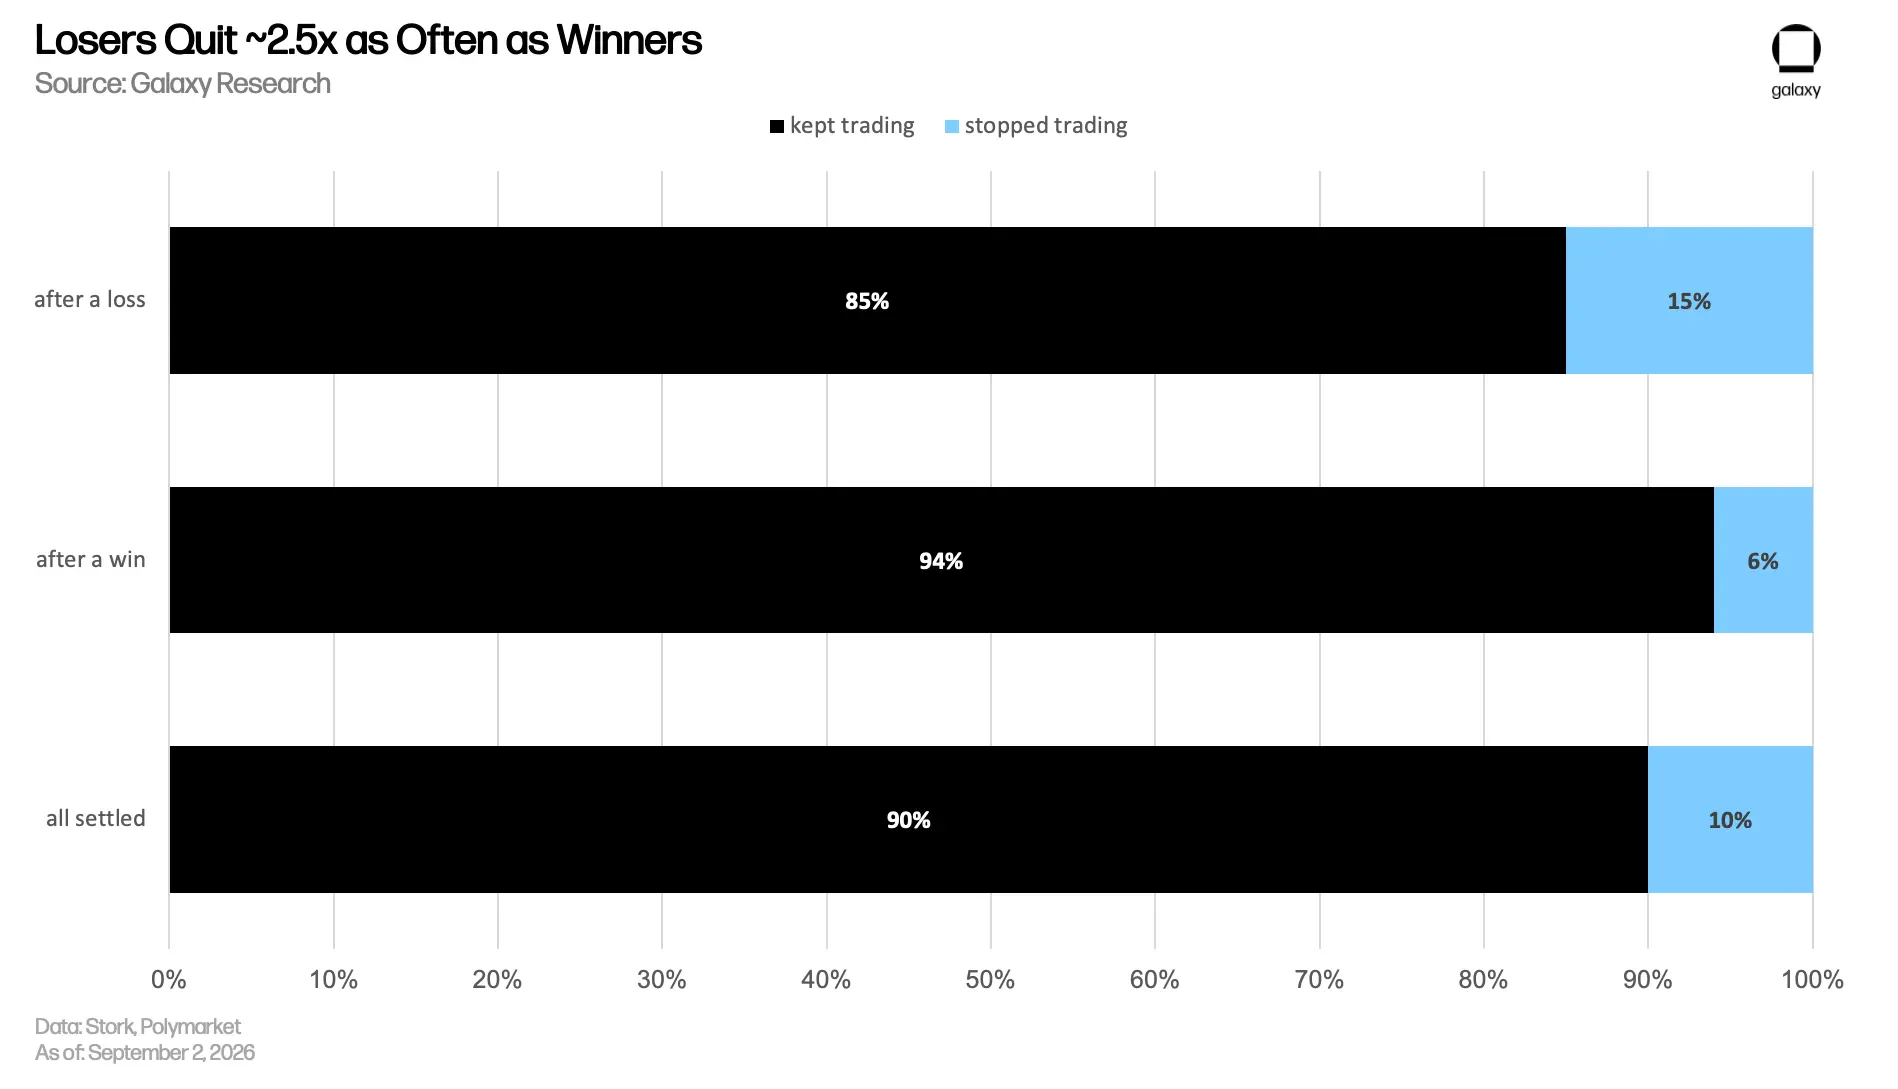
Most will continue. Profit often keeps users on the platform: after making a profit, only 6.1% of accounts did not establish a position again within 30 days; after incurring a loss, this rate is 15.2%. The likelihood of losing accounts exiting is about 2.5 times that of profitable accounts.
Intuitively, making money would lead traders to invest more in the next trade. However, the unadjusted data shows the opposite result: after making a profit, 46.6% of the next position amount is larger; after incurring a loss, this rate is 50.2%. However, this comparison is influenced by other factors.
The purchase price of losing positions is much lower than that of profitable positions, with medians of $0.43 and $0.86, respectively. Therefore, when the purchase price is lower, it is easier to increase the amount for the next trade. (If the prediction comes true, the settlement income for each contract is $1; otherwise, it is zero. Thus, a price of $0.43 implies that the market believes the probability of the event occurring is 43%; those buying at this price believe the true probability is higher.)
After controlling for purchase price, the conclusion reverses. Within the same price range, traders who made a profit are more likely to increase their investment than those who incurred a loss. This phenomenon is mainly concentrated in the price range above $0.50. Below this price, the reactions to profit and loss are almost the same, possibly because traders view these trades as low-probability attempts and do not overinterpret any single outcome.
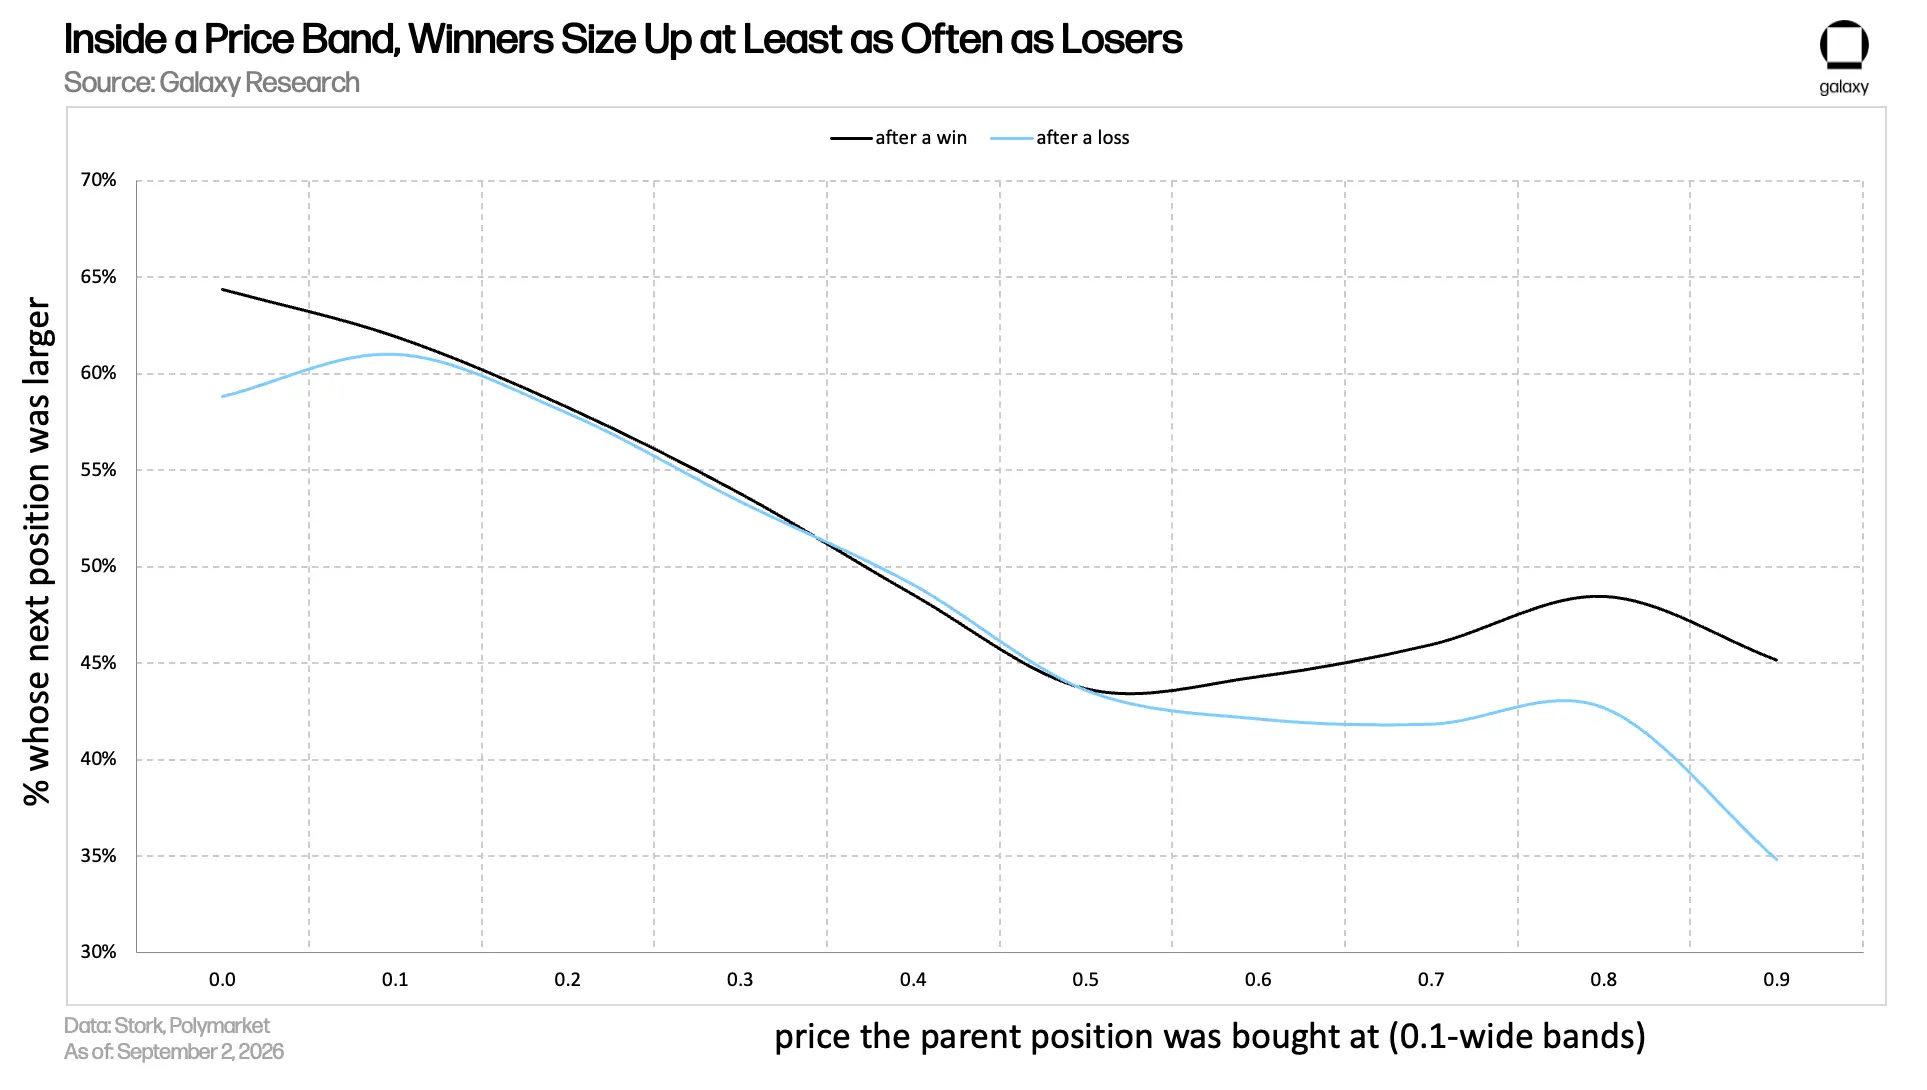
Does profit make traders more willing to take risks? Do losers increase their investments?
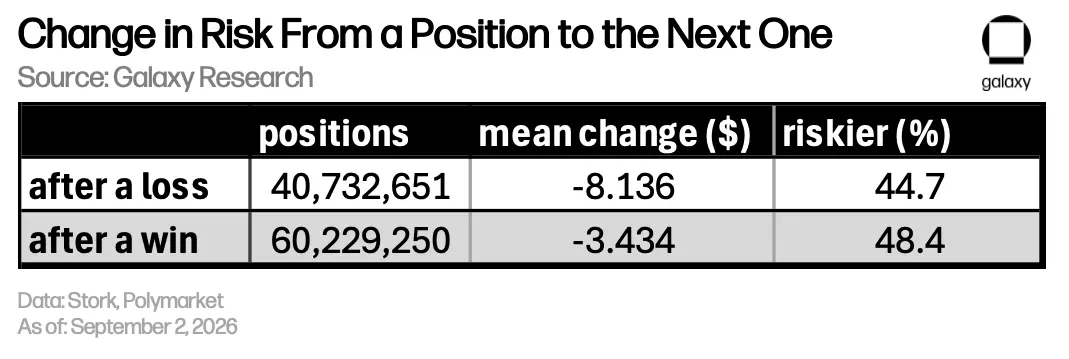
Losers typically contract. Here, "risk" refers to expected losses, not the total principal that could be lost. Assuming an average price p for buying t tokens, the buyer's expected loss is t × p × (1 − p). This means that a position with a probability of occurrence of 99% and an amount of $100,000, while large, does not qualify as a high-risk position by this standard.
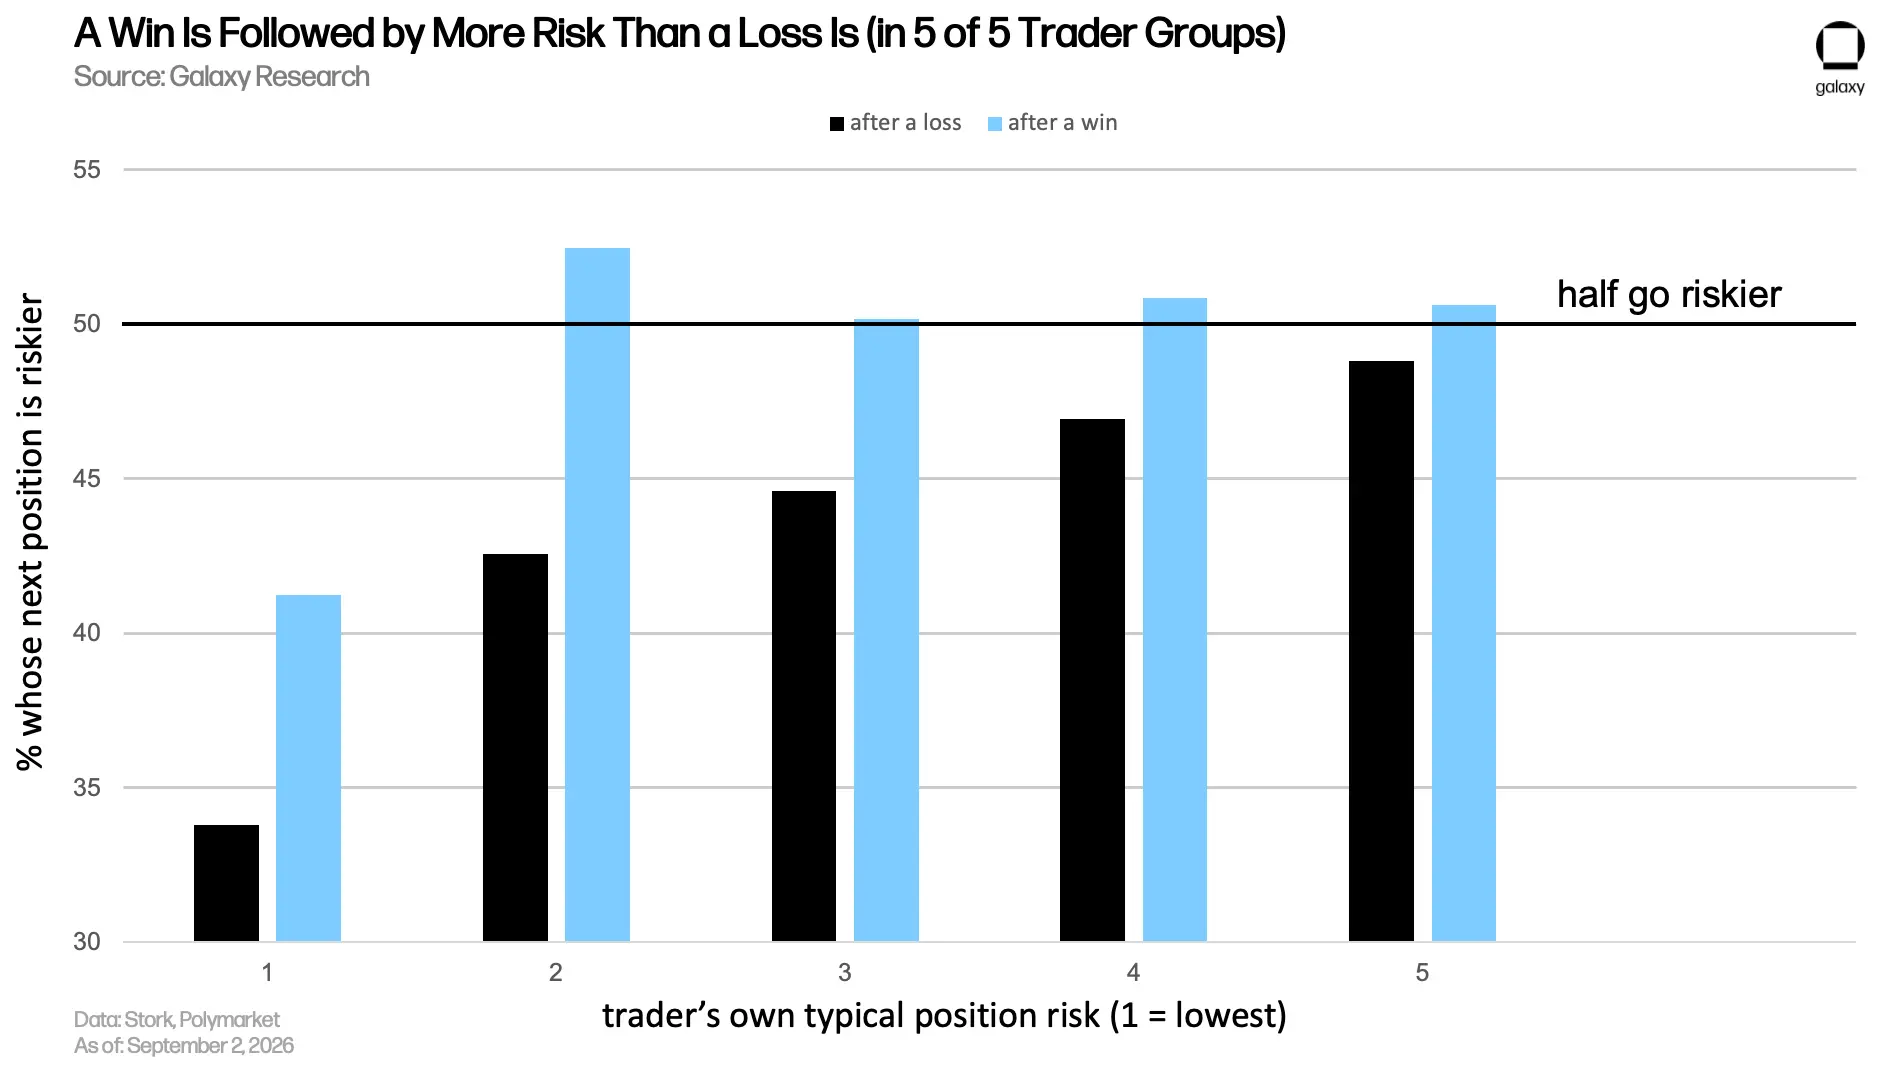
Regardless of whether the last trade was profitable or a loss, traders' risks usually decrease. When trading again, the risk they take on is often slightly lower than the recently settled position. However, the reduction after a profit is noticeably smaller: after a profit, 48.4% of the next position's risk is higher than the previous one; after a loss, this proportion is 44.7%. The median of risk changes in both groups is zero, so most traders simply return to their previous risk levels.
We categorize traders into five equal groups based on the position risk they typically take on. Q1 takes on the least risk, while Q5 takes on the most. The comparison of behavior after profits and losses is conducted within each group, thus comparing the traders' performance after different outcomes.
Do traders focus on one area or dabble in multiple areas? How does profitability differ?
We define "single-domain traders" as those who have participated in at least five classified prediction markets, with more than 60% belonging to the same domain. By this definition, 44.1% of traders are single-domain traders, while 55.9% are "cross-domain traders."
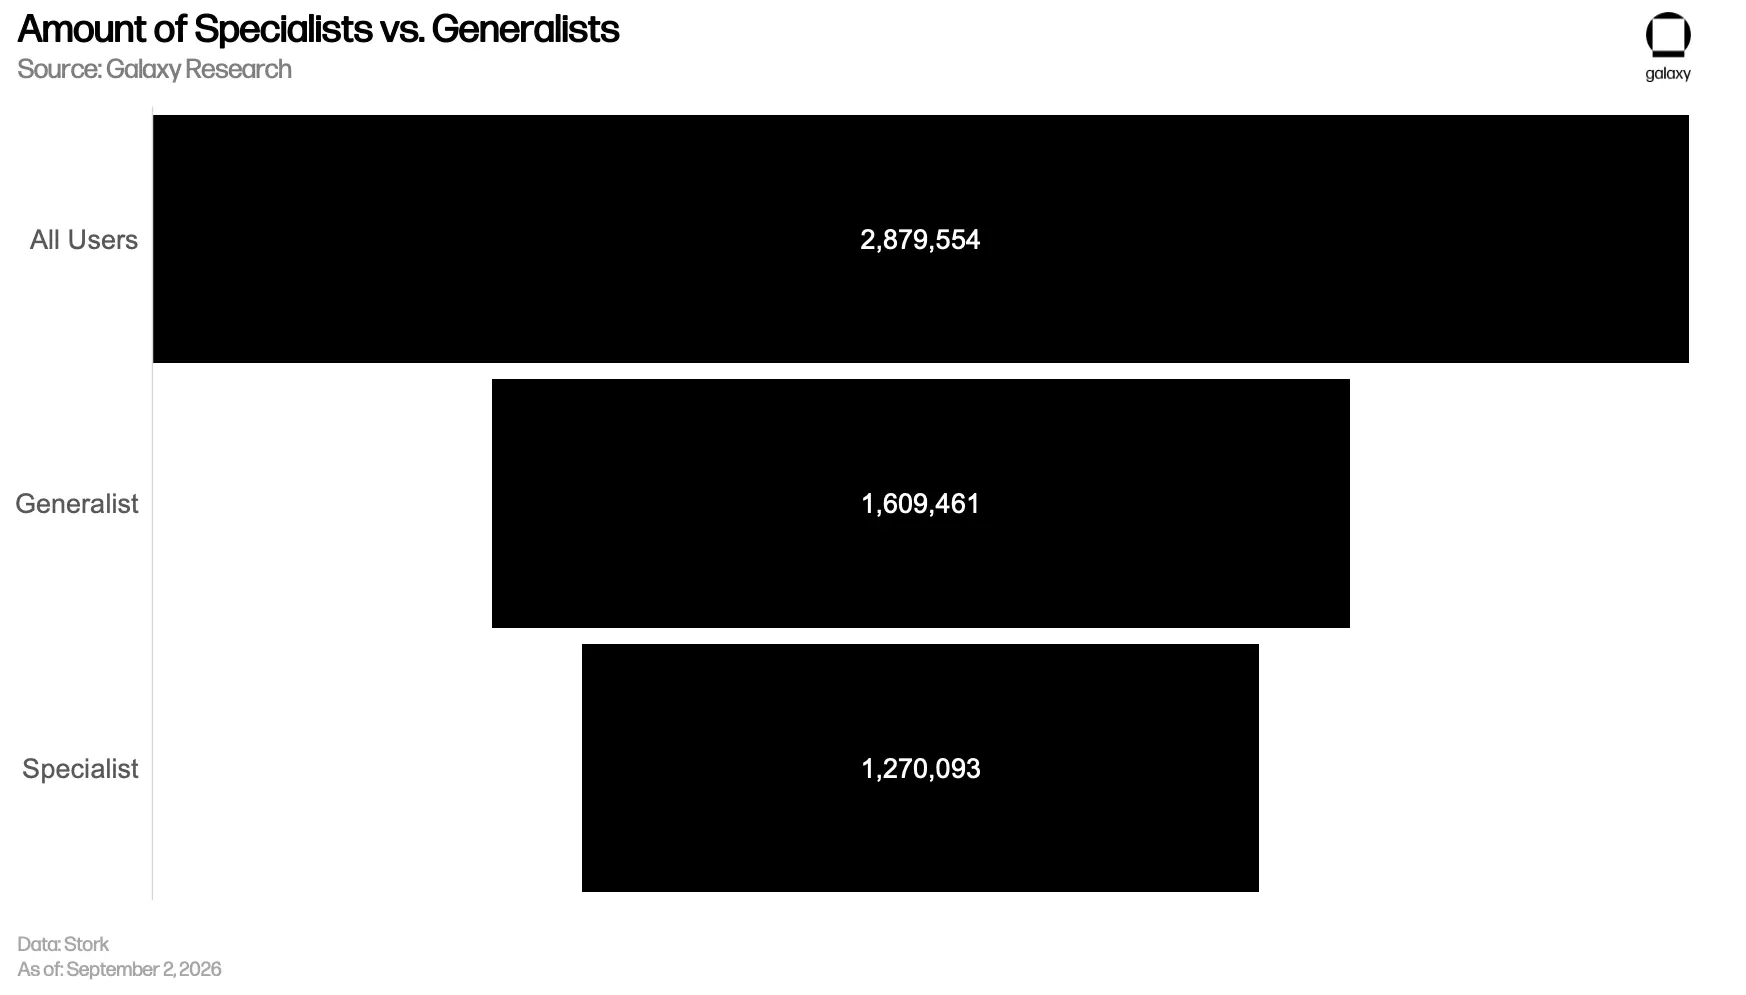
The ability to answer these questions is due to Polymarket adding labels to each prediction market. To avoid categorizing all traders as "single-domain traders," we merged these labels into ten domains: cryptocurrency, sports, politics, finance, economics, weather, culture, international affairs, technology and science, and business. Subcategories typically also carry the label of the higher-level category; for example, football prediction markets are also labeled as sports.
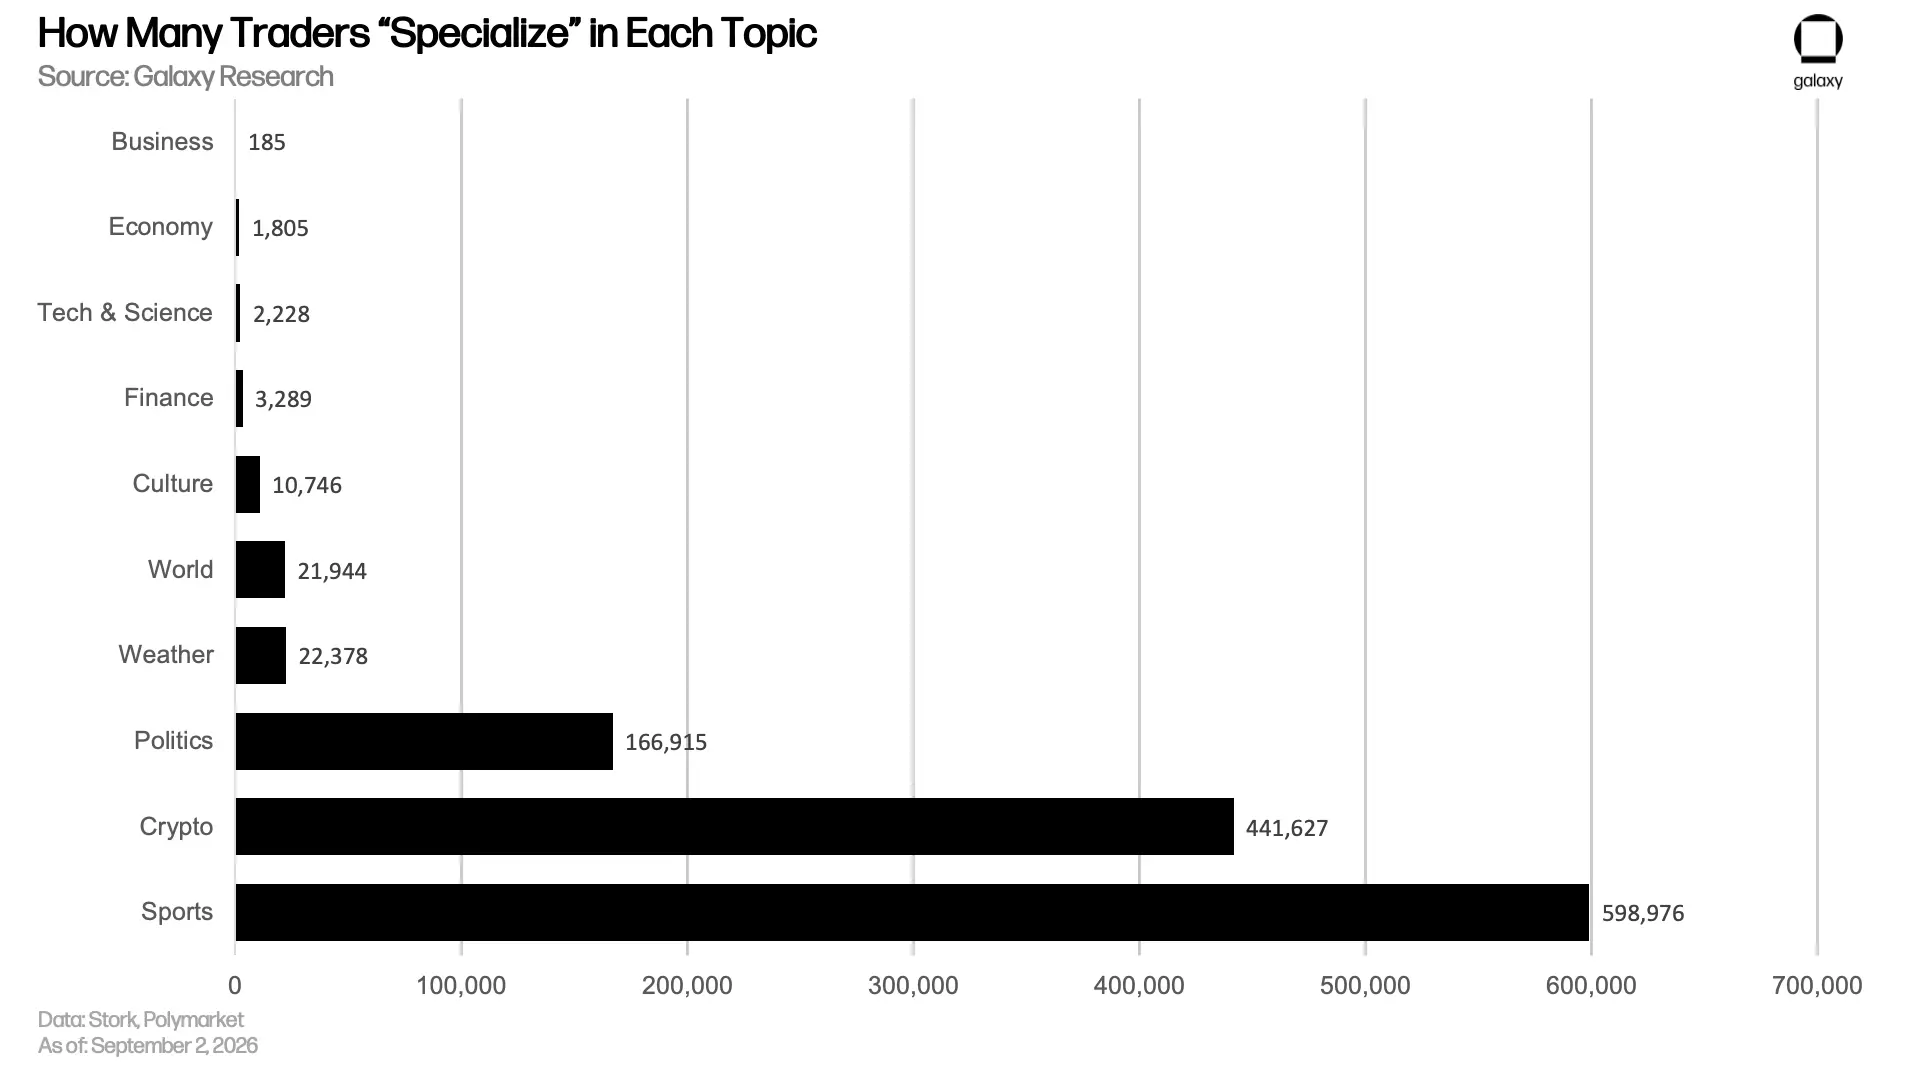
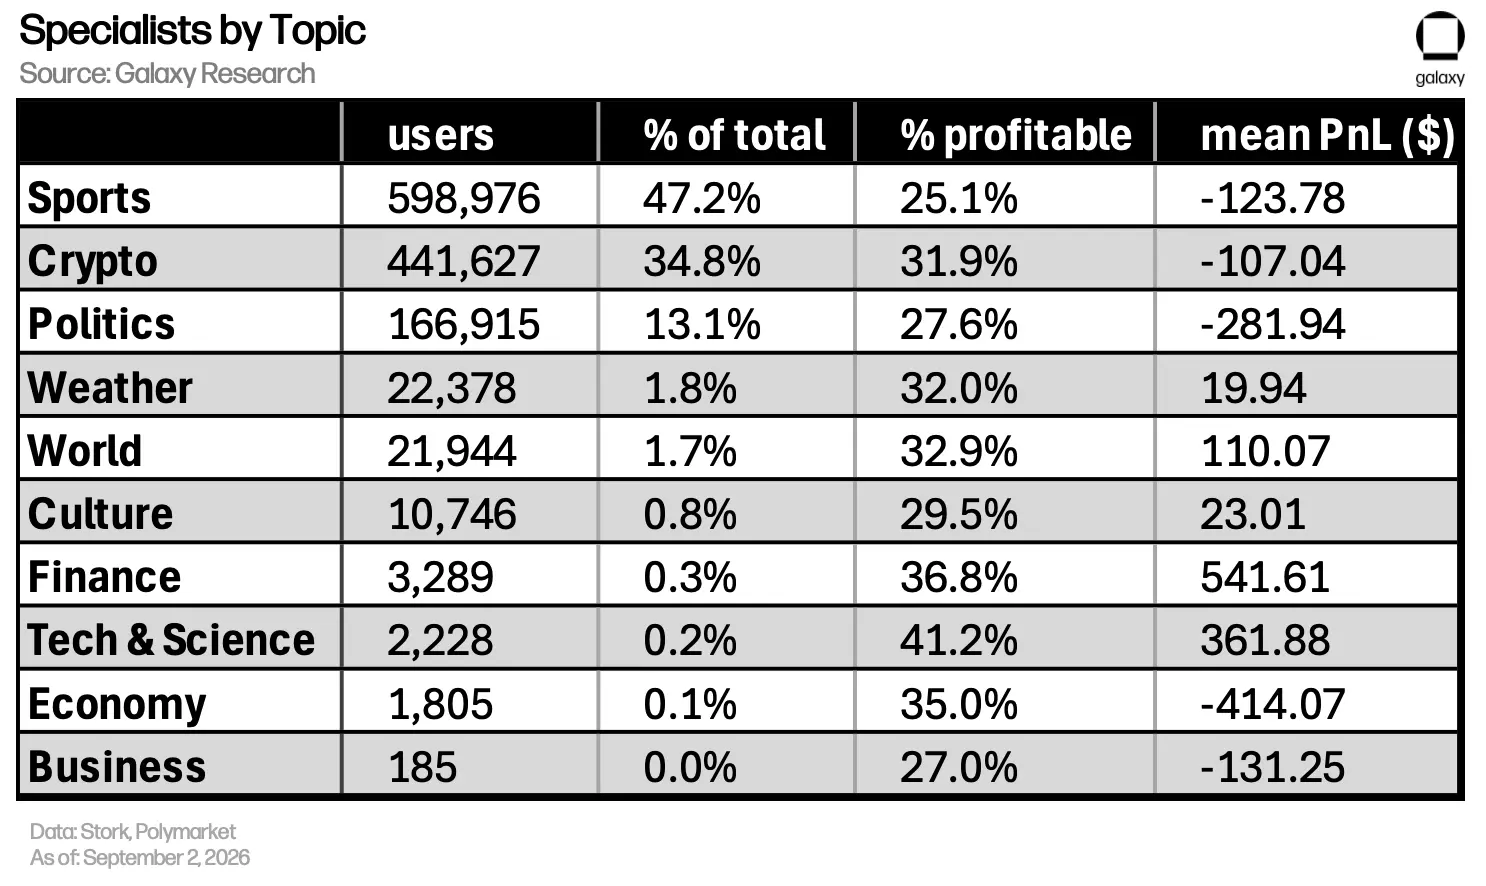
Single-domain traders perform slightly worse, with a final profitability rate of 28.1%, while cross-domain traders have a rate of 30.4%. The reason is that 61% of single-domain traders are concentrated in the three poorer-performing areas: sports, politics, and culture.
A person who only trades NFL game predictions on Sundays probably isn't doing actuarial analysis.
Clearly, if traders indeed have an advantage in a certain area, focusing on that area can yield better returns. A person who only trades prediction markets related to OpenAI model releases likely has some advantage, which may not necessarily be insider information but could simply be an ability to analyze public information well. A person who only trades NFL game predictions on Sundays probably isn't doing actuarial analysis.
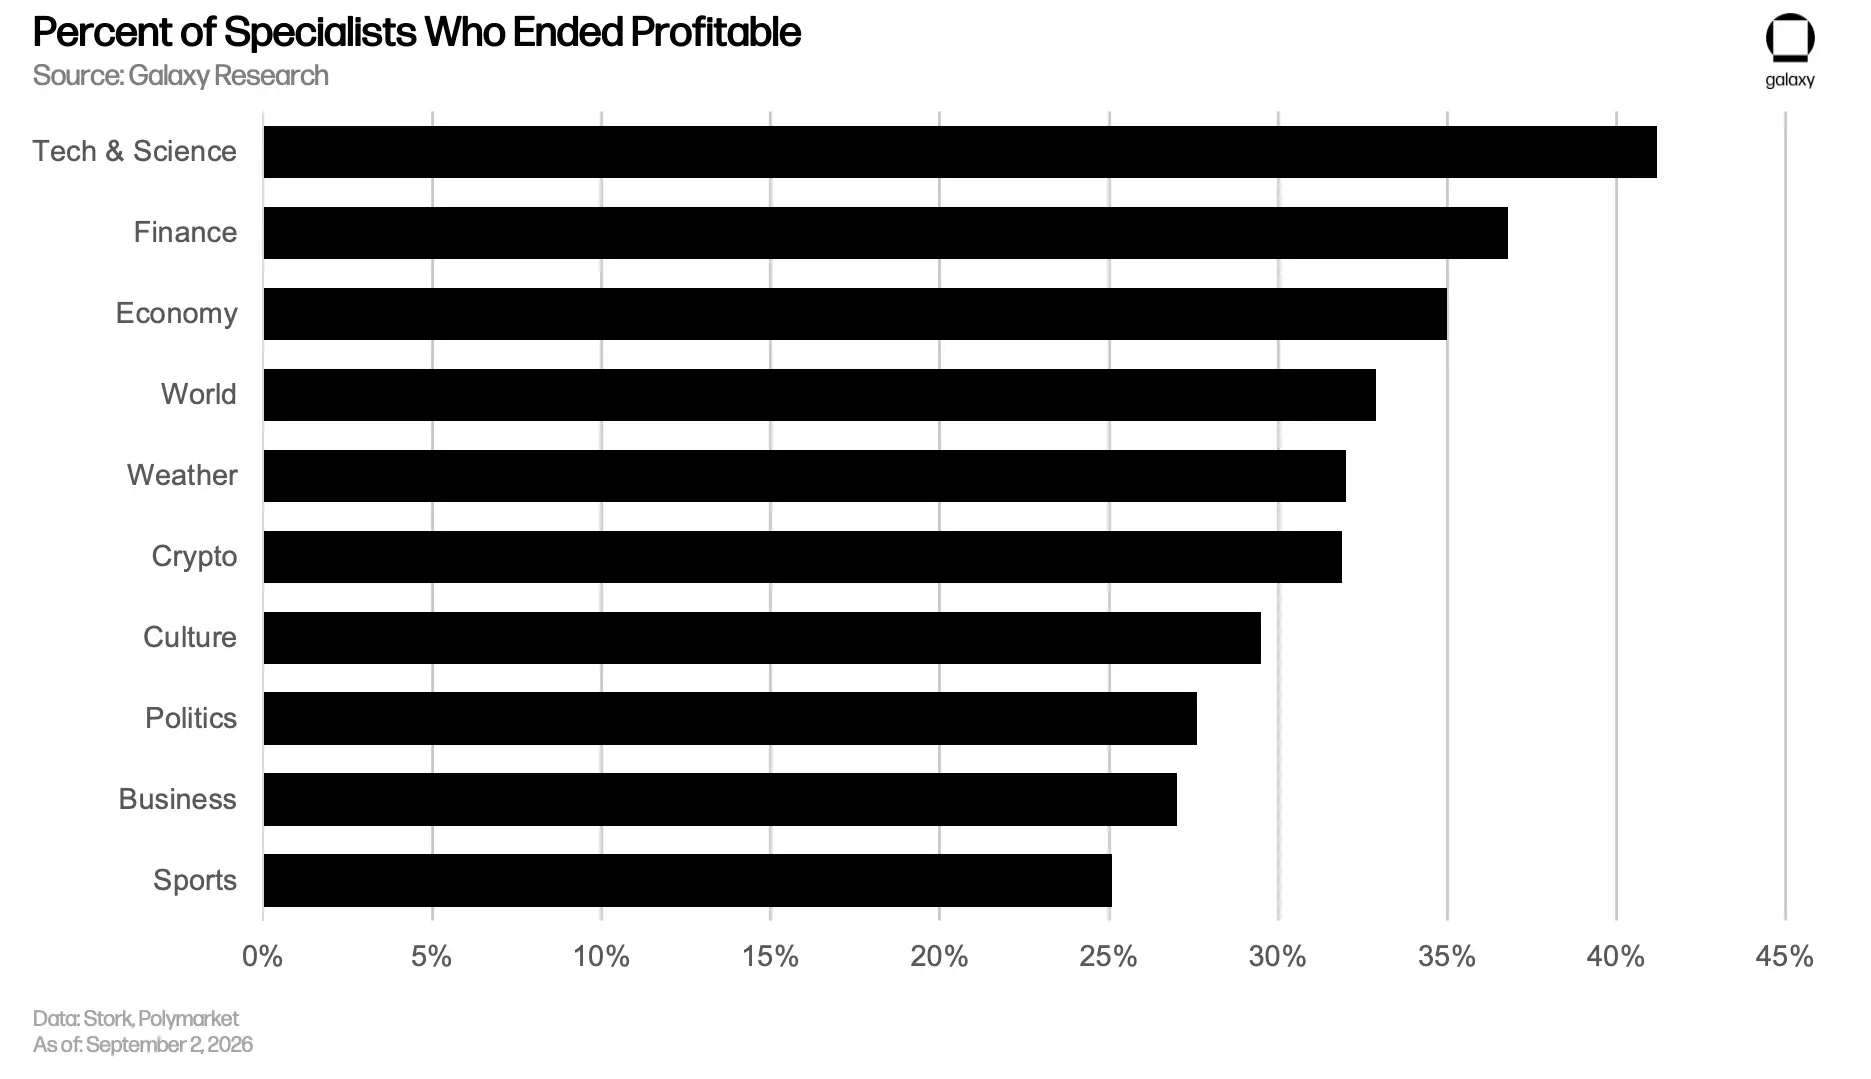
Sports alone account for 47% of all single-domain traders, with a profitability rate of 25.1%, the lowest among all domains. Excluding sports, politics, and culture, single-domain traders in all other areas have profitability rates higher than the 30.4% of cross-domain traders. Among these, the finance domain has a rate of 36.8%, and the technology and science domain has a rate of 41.2%. It is important to note that technology and science is a smaller category with fewer samples.
The median number of prediction markets participated in by single-domain traders is 18, while for cross-domain traders, it is 4. Since determining whether to focus on one domain requires traders to have participated in at least five classified prediction markets, low-activity accounts are defaulted to being categorized as cross-domain traders.
What are the differences between profitable and losing traders?
By comparing the median holding time and median position size of profitable and losing traders, several conclusions can be drawn.
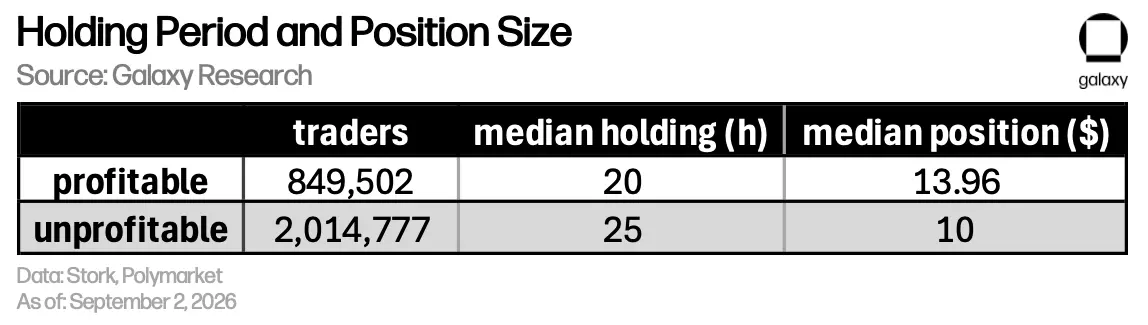
In terms of position size, the median position size for profitable traders is $13.96, while for losing traders, it is $10.00. However, profitable traders also trade more frequently, so this difference may simply be due to varying levels of activity rather than differences in the amount invested. When grouping traders by the cumulative number of positions established, in each group, the single investment of profitable traders is not lower than that of losing traders and is significantly higher in most groups.
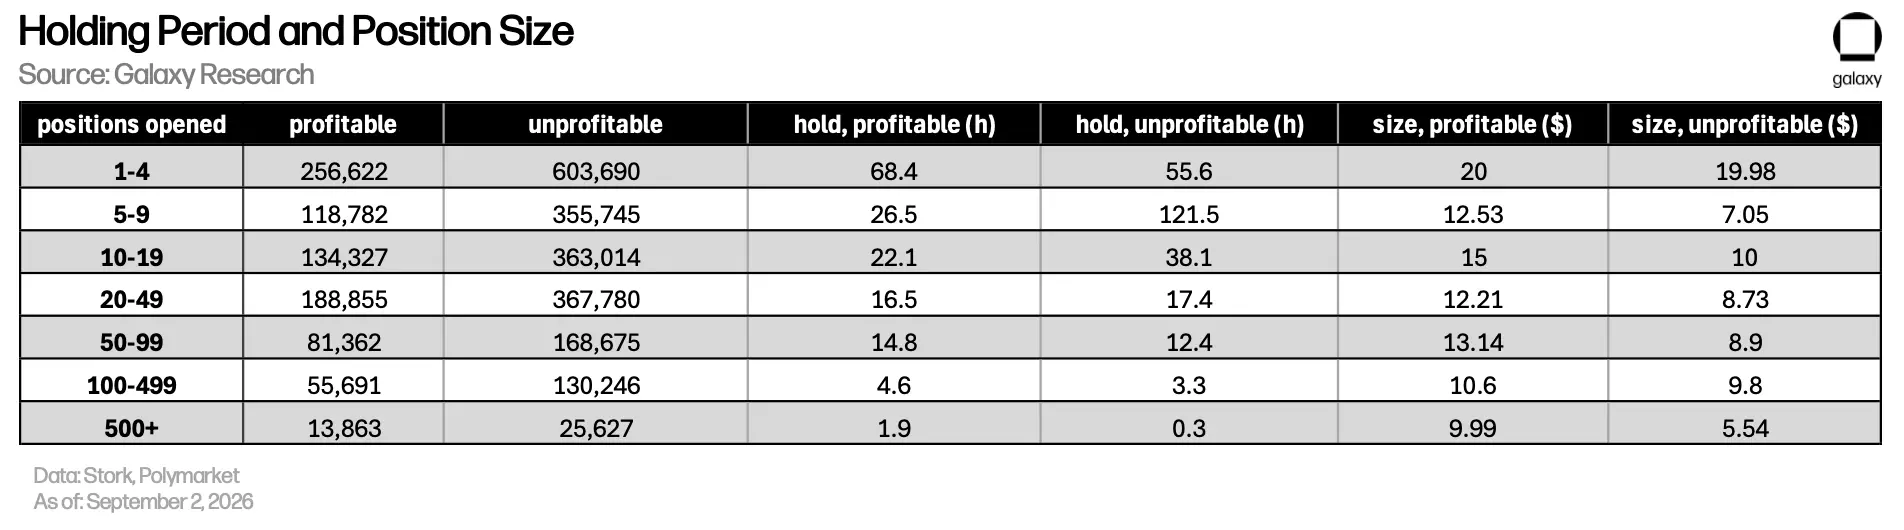
Among traders who have established between 5 to 9 positions, the median position size for winners and losers is $12.53 and $7.05, respectively; among traders who have established between 50 to 99 positions, the figures are $13.14 and $8.90.
Holding time, however, does not explain much. When looking at all traders together, profitable traders have shorter holding times, with a median of about 20 hours, while losing traders have about 25 hours.
But when grouped by activity level, the relationship of holding time changes. In some groups, profitable traders hold longer; in others, losing traders hold longer. Therefore, we cannot draw a clear relationship between "more patient" and "easier to profit" from this data.
This differs from trading in meme coins. In the meme coin market, engaging in "scalping" ultra-short-term trades or quickly trading new trading pairs yields better profitability. They are usually sniper traders or experienced traders who can quickly profit after holding for just a few seconds.
For information on these types of traders, refer to our Meme Coin Report; for the nature of KOLs and the trading behaviors that arise from it, refer to our Social Trading Report. It should be noted that this type of "trading" is quite different from trading in perpetual contracts or prediction markets.
Outlook
The original goal of prediction markets was to aggregate information and leverage collective wisdom. However, in recent years, they have increasingly been criticized as mere gambling platforms. This report presents the profit and loss distribution of Polymarket users: 69% ultimately incur losses, while the largest user group focused on a single domain primarily trades sports-related prediction markets.
Polymarket began charging transaction fees for cryptocurrency price prediction markets in January 2026, and by the end of March, the fee coverage had expanded to almost all categories. For example, at a price of $0.50 per contract, buying 100 contracts in the cryptocurrency market with an investment of $50 requires the taker to pay a fee of $1.75, equivalent to 3.5% of the single investment amount.
The rates for political, financial, and technology categories are the lowest at 2.0%; for sports, it is 2.5%. The median proportion of funds lost by retail accounts throughout the trading history is about 0.5% of total investments. Nowadays, in cases where the probability of an event is 50%, the cost of just one taker transaction is already several times this proportion.
This report does not deny the value of prediction markets as tools for discovering the truth.
It can be said that the fact that most participants incur losses without other forms of subsidy is precisely the premise for information aggregation to be realized. Funds with information advantages need to transact with traders who do not possess such advantages. If all participants in Polymarket were equally savvy, no one would trade. This report does not deny the value of prediction markets as tools for discovering the truth. Polymarket can allow most participants to incur losses while providing predictive references for those who do not participate in trading. The cost of predictions is borne by these noise traders.
This report is strictly limited to the international version of the platform. Polymarket's U.S. exchange operates independently and is a major focus of the company's recent investments. For example, the funds invested to invite LeBron James for collaboration reflect this. According to Front Office Sports, Polymarket pays James $15 million annually, about four times his NBA earnings this year. To comply with NBA regulations, his promotional content is limited to American football-related prediction markets. Jet and Manning have also signed cooperation agreements with the platform.
These marketing investments aim to attract the group with the poorest profitability performance in this dataset. From a business perspective, this is not difficult to understand. Polymarket probably does not care whether users are profitable. At least in the short term, the platform is more motivated to attract taker users who participate in trading without screening rather than more professional limit order traders.
On Polymarket, the counterparty for each trade is a public address. Anyone who disagrees with the analysis in this report can verify it themselves.
Recently, a controversy involving Kalshi is also worth noting. On September 20, a quantitative trader on X named beniduboss accused the exchange of exaggerating the trading volume of cryptocurrency perpetual contracts. This is a serious accusation.
The data cited by Beni is: the 24-hour trading volume of ETH-PERP is approximately $538.6 million, while the open contract amount is only about $3.1 million, which is extremely unusual in the perpetual contract market. In contrast, Hyperliquid's ETH-PERP typically has about $1.3 billion in 24-hour trading volume and approximately $3.1 billion in open contract amounts.
Kalshi officially denied this allegation, stating that the other party confused the number of contracts in the prediction market with the nominal trading volume of perpetual contracts. As of the writing of this article, regulators have not taken action.
It is worth noting that people outside the exchange cannot actually clarify this matter. Kalshi's public data stream does not indicate the identities of both parties in each transaction, so it is impossible to determine whether the trading parties are controlled by the same entity based solely on this data. In contrast, on Polymarket, the counterparty of each transaction is a public address. This means that anyone who disagrees with the analysis in this report can verify it themselves.
As prediction markets continue to evolve and enter regulated trading platforms that use proprietary order books, it is no longer taken for granted that outsiders can verify trading volume data.
 Risk warning



Popular articles