





Analysis of the peak of this round of Bitcoin cycle: Has the bear market ended? Where is the peak?

Summary
In the report titled "Has the Bitcoin Bear Market Ended?" released on July 17, 2026, we pointed out that Bitcoin has reached the downward target of the current C wave (the final decline in a bear market adjustment according to Elliott Wave Theory) and stated: as long as the price stabilizes above $62,900, it can be confirmed that the cycle bottom has formed. We also noted that the trend model is about to shift to bullish; this signal was triggered shortly thereafter, and Bitcoin has since been operating within a bullish trend. The weekly RSI (Relative Strength Index, which measures the momentum of price movements, with readings above 70 indicating overbought conditions and below 30 indicating oversold conditions) analysis further corroborated this judgment, showing a high degree of correlation with the bottoming process in 2022.
The weekly RSI first touched the oversold level of 35 during the continuous decline in February. When the price dipped again in June and July, the RSI failed to break below that low. This positive divergence, where the price makes a new low but the indicator does not, is a reliable bullish pattern. More importantly, our monthly cycle indicator at that time pointed to a nearing bottom, with the probability of the bear market ending increasing.
Two weeks later, we reiterated this view in "Bitcoin Approaching the Bottom," expecting the market to rebound first to $70,000 and drive several key indicators bullish. The core question now is: where will the peak of this cycle occur?
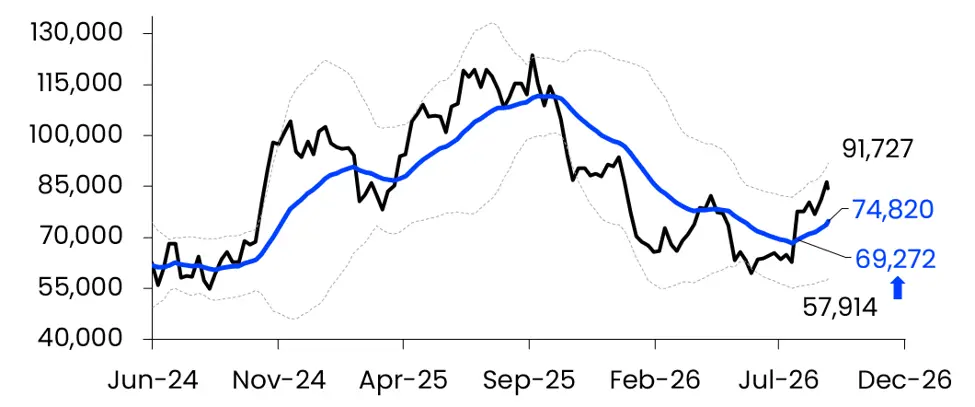
Figure 1: Bitcoin 21-week moving average, BTC enters a new bullish cycle at $69,272
Source: Independent analysts and other sources
I. Where will the peak of this Bitcoin cycle be?
For a long time, the 21-week moving average (the arithmetic average of closing prices over the past 21 weeks, often used as a trend line to distinguish between bullish and bearish markets) has been one of the simplest yet most effective measures to differentiate Bitcoin bull and bear markets. When Bitcoin crossed above this moving average at $69,272, this breakthrough released a positive signal that the bear market might be ending. When Bitcoin crossed above this moving average at $69,272, this breakthrough confirmed that the bear market had indeed ended.
In the report on July 24, 2026, we further pointed out the potential catalysts for the market: the U.S. federal debt is about to exceed $40 trillion, and the 10-year U.S. Treasury yield (the yield on U.S. 10-year government bonds, which serves as the interest rate anchor for global asset pricing) is climbing towards 5.0%, likely leading to a large-scale rotation of funds into gold and Bitcoin. The subsequent market movements aligned with this judgment. After the U.S. federal debt crossed the $40 trillion mark, Bitcoin experienced a significant rise, breaking through the ongoing downward trend line since the peak in October 2025, which fully corroborated this judgment. Once it surpassed the $40 trillion mark, Bitcoin immediately surged, breaking through the ongoing downward trend line since the peak in October 2025.
By simply overlaying Bitcoin prices with U.S. federal debt (currently at $40.1 trillion), our model estimates an implied reference valuation of about $105,000. Given that the debt scale is likely to continue expanding, even if prices experience overvaluation and undervaluation around this trend center, debt expansion may still provide long-term structural support for Bitcoin, but this relationship is not guaranteed. By simply overlaying Bitcoin prices with U.S. federal debt (currently at $40.1 trillion), our model estimates an implied fair value of about $105,000. Given that the debt scale is likely to continue expanding, even if prices experience overvaluation and undervaluation around this trend center, debt expansion itself will still provide long-term structural support for Bitcoin.
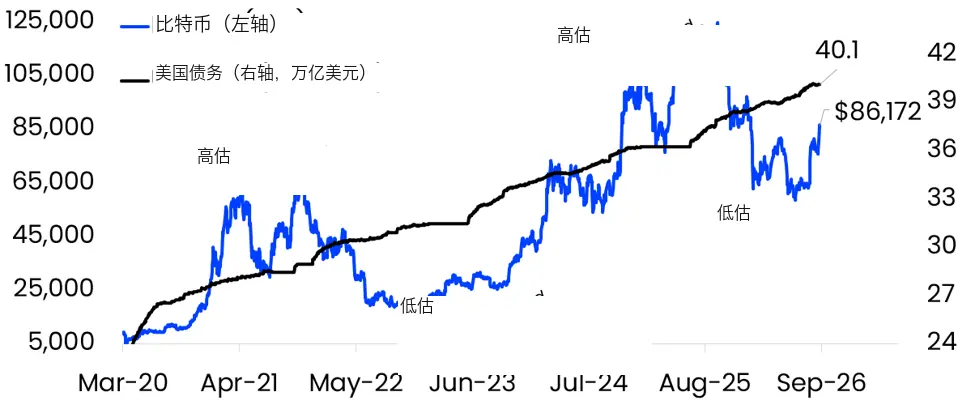
Figure 2: Bitcoin (left axis) compared to U.S. debt (right axis, in trillions), moving from overvaluation to undervaluation
Source: Independent analysts and other sources
Gold and Bitcoin rose together after breaking their downward trends, but recently gold has seen a pullback due to a stronger dollar. There are two forces driving the dollar's strength: first, traders are factoring in expectations of further interest rate hikes by the Federal Reserve; second, drone attacks have damaged key export pipelines from Saudi Arabia to the Red Sea, forcing it to cancel oil shipments to Europe in October, exacerbating energy supply concerns. Against the backdrop of uncertain supply in the Middle East, the U.S., as the world's largest energy producer and potential major exporter, has seen its position become increasingly prominent, forcing energy-importing countries to scramble to exchange dollars to pay their bills.
Expectations of U.S. restrictions on diesel exports have further amplified these concerns. Since the attack on Iran and the subsequent blockade of the Strait of Hormuz (a vital waterway for about one-fifth of the world's seaborne oil), diesel prices have doubled. Despite President Trump repeatedly assuring that the conflict would be resolved quickly, the strait has now been blocked for seven months. Historically, a stronger dollar typically exerts pressure on gold, while its drag on Bitcoin is relatively limited.
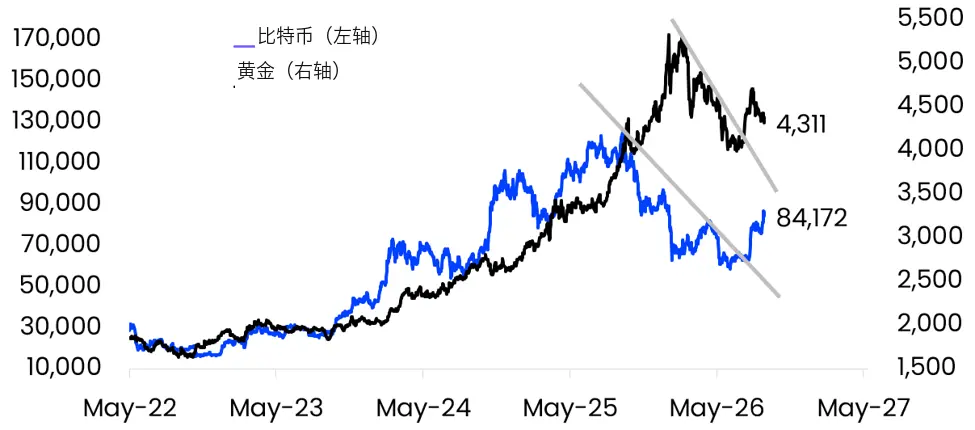
Figure 3: Bitcoin (left axis) compared to gold (right axis), both have broken their downward trends
Source: Independent analysts and other sources
On a technical level, the initial surge in this round was driven by short covering (investors who had previously shorted buying back to close their positions, which in turn pushed prices higher); once Bitcoin recovers $70,000, the first wave of FOMO (Fear Of Missing Out) sentiment will emerge. Currently, Bitcoin is trading around $84,000, having overcome several important levels, and the continued rise of FOMO is not coincidental. It has not only reclaimed the March 2024 high of $73,084 but also broken through the resistance level left by the tariff announcement in April 2025 (a price area with dense previous transactions that is prone to selling), which had triggered a significant pullback. Meanwhile, Bitcoin has regained the 1-year moving average (the average closing price over the past year, serving as support for the bullish market), which has supported the bullish trend from early 2023 to November 2025; the judgment that "the cycle bottom has appeared" is rapidly becoming market consensus. Additionally, Bitcoin has broken through the May 2026 high, forming a higher high, which constitutes a clear bullish technical signal.
Overall, Bitcoin has reclaimed the major resistance area since March 2024. In May 2026, the price failed to stabilize above this area; now, with the price operating above the 1-year moving average, the probability of an effective breakout has significantly increased.
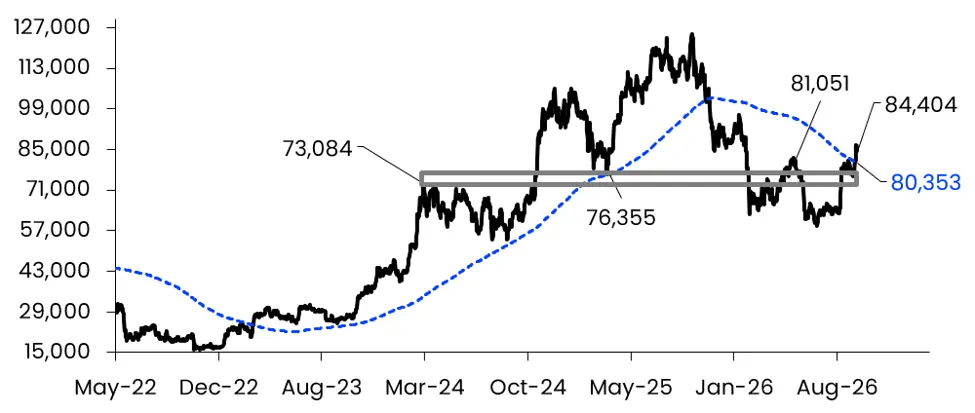
Figure 4: Bitcoin, breaking through the resistance zone and standing above the 1-year moving average
Source: Independent analysts and other sources
Our monthly cycle indicator signaled the nearing of the bear market bottom in July, which has since improved significantly, currently indicating that the market may have entered a new upward cycle. Our monthly cycle indicator signaled the nearing of the bear market bottom in July, which has since improved significantly, now confirming that the bear market has ended. Momentum is still accumulating, but Bitcoin is currently in an overbought state (having risen too quickly, with short-term pullback pressure), so a brief consolidation is not surprising. Investors should still focus on the big picture: the probability of price rising is real, and our debt model gives a fair value of $105,000. Momentum is still accumulating, but Bitcoin is currently in an overbought state, and the possibility of a brief consolidation or even a significant pullback still exists. From a medium to long-term perspective, our debt model gives a reference valuation of $105,000, but this valuation relies on specific macro and market assumptions.
As Bitcoin recovers multiple important technical levels, the price has not only risen to the level where average holders of Bitcoin spot ETFs (Exchange-Traded Funds, representing the inflow and outflow of compliant institutional funds) begin to profit but has also surpassed the average cost basis of all Bitcoin holders, which is the True Market Mean (the estimated average purchase price of all Bitcoin on-chain), currently at $76,897. Currently, Bitcoin is trading in the range of $84,000 to $86,000, and the entire market has returned to a profitable state. This is crucial: historical experience shows that traders in a loss position will continue to close positions, thereby increasing selling pressure. In October 2025, Bitcoin fell below the realized cost of short-term holders (the average purchase cost of on-chain holdings), prompting us to make a bearish judgment. Now that the entire market is back above the average cost, the return of FOMO and traders' willingness to increase leverage is only natural.
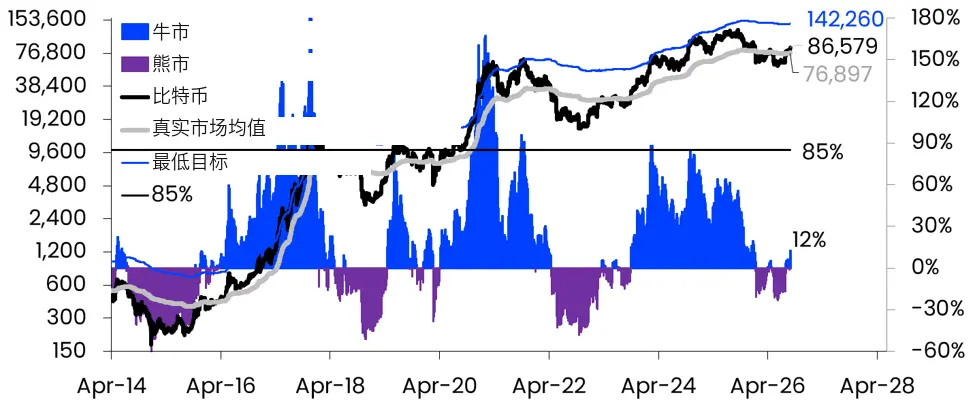
Figure 5: Bitcoin (left axis) compared to its premium over the relative True Market Mean (right axis), threshold at 85%
Source: Independent analysts and other sources
Historical data shows that in the past cycles studied, Bitcoin's premium relative to this cost benchmark has reached at least 85%. Based on the current True Market Mean, this corresponds to about $142,260. We view this as a reference level for observing the trend of this bull market, rather than a minimum target or final peak: historically, prices have continued to rise after surpassing this level, but whether a similar trend can be replicated remains uncertain. Historical experience shows that bull markets only peak after Bitcoin's premium relative to this cost benchmark (the percentage by which the market price exceeds the average cost) reaches at least 85%. Based on the current True Market Mean, this corresponds to $142,260. We consider this the minimum trigger threshold for the bull market to begin peaking, rather than a ceiling, and certainly not the final peak: historically, prices typically continue to rise significantly after surpassing this level. As Bitcoin rises and turnover (the transfer of holdings between old and new holders) increases, the average cost basis will also rise: some holders will take profits, and new buyers will enter at higher price levels, and this process itself will push up the target, indicating that the peak of this bull market should be above $142,260.
However, the premium multiples are compressing with each cycle. In the previous cycle, Bitcoin first reached an 85% premium around $73,000 in March 2024, and ultimately peaked at $126,000, corresponding to a multiple of about 1.7 times. If this multiple further compresses to between 1.3 and 1.5 times, and is calculated based on $142,000, under the above assumptions, the corresponding potential upward scenario is about $185,000 to $215,000. This calculation is merely a scenario analysis, not a price target or prediction. If this multiple further compresses to between 1.3 and 1.5 times, and is calculated based on $142,000, the corresponding upward target is about $185,000 to $215,000.
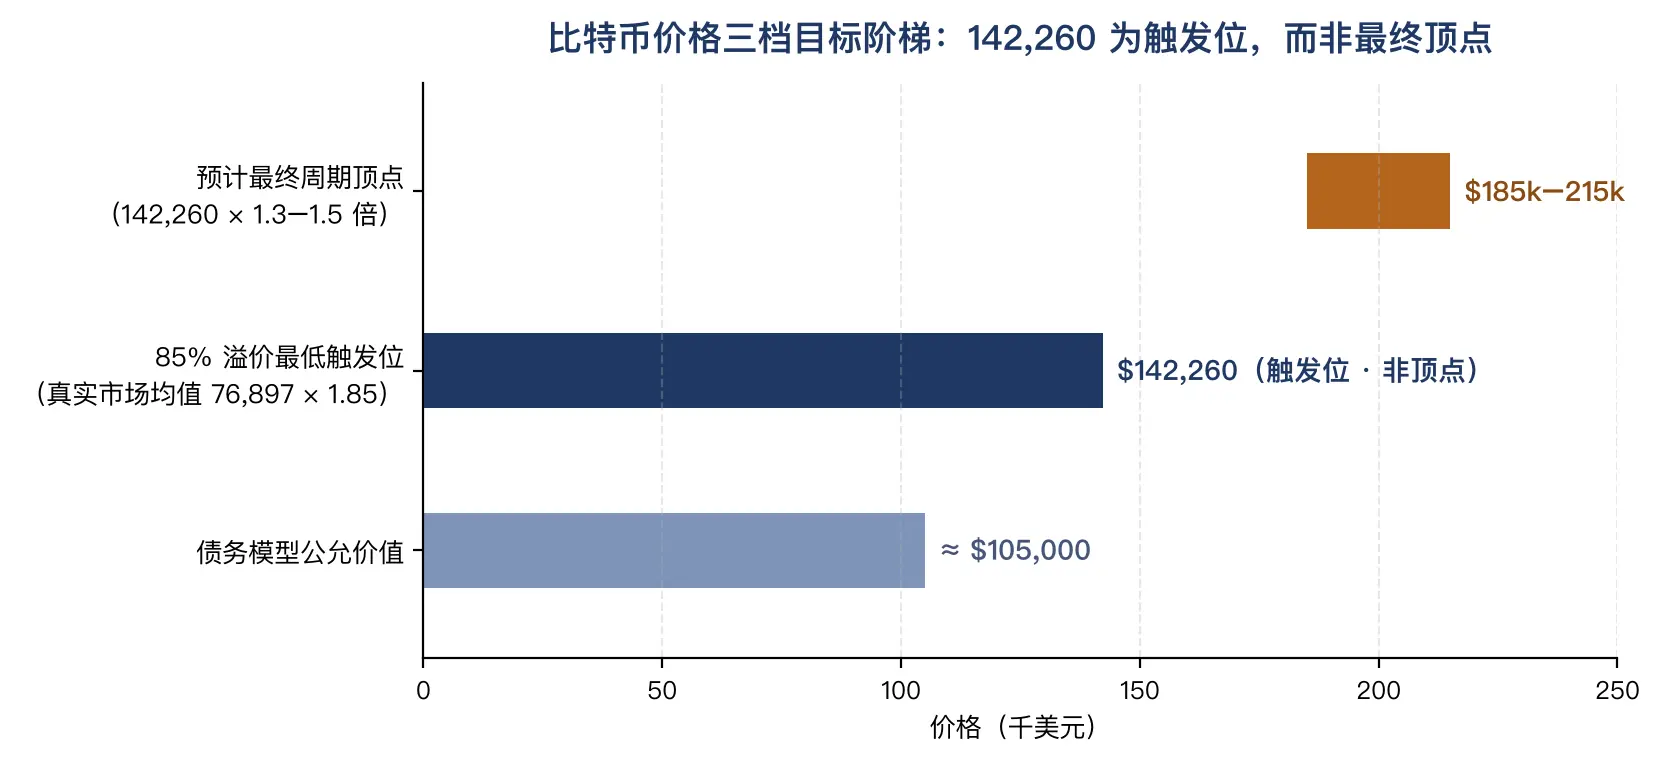
Figure 6: Bitcoin price three-tier target ladder (data source: this report's debt model and True Market Mean calculation)
Timing is also critical. The last cycle took about 19 months from the appearance of the 85% signal to the final peak, as the True Market Mean needed time to catch up with the price. Based on the time span of the previous cycle, a scenario around $200,000 may correspond to 2028 to 2029, but the actual trajectory and timing are highly uncertain. Therefore, the peak around $200,000 is more likely to be an event in 2028 to 2029, rather than imminent.
Conclusion
All the signals we indicated in July have been realized: Bitcoin has reclaimed the 21-week and 1-year moving averages, reaching higher highs and pulling the entire market back above the average cost. Monthly cycle indicators confirm that the bear market has ended. In the short term, the strengthening dollar and overbought conditions may trigger a brief consolidation.
We believe that such pullbacks may present opportunities, but further downside risks should still be monitored. As U.S. debt continues to rise, our debt model suggests a reference valuation of $105,000; the reference level under the real market average framework is $142,260. Under specific assumptions, $185,000 to $215,000 could serve as one potential bullish scenario, but this is not a price prediction or guarantee. The realization of this scenario still depends on the macro environment, market liquidity, and subsequent changes in cycle indicators, and investors should carefully assess based on their own risk tolerance. We will view any such pullbacks as opportunities rather than warnings. As U.S. debt continues to rise, our debt model indicates a fair value of $105,000; the cyclical minimum target set under the real market average framework is $142,260, with the final peak likely falling within the range of $185,000 to $215,000. This peak is still some distance away in both time and space, so investors should maintain their positions and embrace years of growth rather than trying to profit from every swing.
Disclaimer: This article is for general market research and informational reference only and does not constitute investment advice, investment offers, or recommendations for buying or selling any digital assets. The data and analysis in this article are based on publicly available information and specific model assumptions, and the relevant information may be adjusted with market changes. Historical performance, technical indicators, and scenario analysis do not represent or guarantee future performance. Digital asset prices are highly volatile and may face significant losses, including total loss of principal. Investors should fully understand the relevant market, liquidity, and leverage risks, and consult with a licensed professional investment advisor if necessary based on their financial situation and risk tolerance.
 Risk warning Risk warning